
 ?Mathematical formulae have been encoded as MathML and are displayed in this HTML version using MathJax in order to improve their display. Uncheck the box to turn MathJax off. This feature requires Javascript. Click on a formula to zoom.
Abstract
This paper aims to investigate the extent of hedging and diversification opportunities available for an Australian investor who holds a portfolio consisting of Australian conventional and Islamic indices, crude oil, gold, Bitcoin, and the Australia–US exchange rate of daily data from 2011 to 2021. The relevant time-varying and time-scale dependent techniques, such as MGARCH dynamic conditional correlation (MGARCH-DCC), continuous wavelet transform (CWT), and maximal overlap discrete wavelet transform (MODWT) are employed to discern the correlation and volatilities of the variables. The paper’s unique contribution lies in unveiling an Australian investor’s diversification opportunities of a portfolio containing Bitcoin, gold, oil, Islamic indices, conventional indices, and exchange rates. Findings from MGARCH-DCC analysis suggest that Bitcoin is the least correlated variable. However, investors may be discouraged from choosing Bitcoin as a diversification instrument due to its high volatility. The evidence further suggests that Australian investors may benefit from diversification with gold. Nonetheless, the CWT result shows that the diversification benefits effects will last for a holding period no longer than 64 days. Our research findings tend to indicate the importance of finding diversification opportunities for investors with heterogeneous investment holdings over various periods by utilising relatively advanced techniques.
PUBLIC INTEREST STATEMENT
Correlational and volatility analyses have always become the heart of investment diversification studies. The main drawback of past studies mainly lies in the strict assumption of having homogenous market players with identical holding periods, which seems too restrictive and unrealistic. Leveraging on the benefits of recent techniques of Multivariate Generalised Autoregressive conditional heteroscedasticity (MGARCH), continuous wavelet transform (CWT) and maximal overlap discrete wavelet transform (MODWT), the study offers new empirical insights on the interlinkages between Bitcoin, gold, oil, Australian conventional and Islamic indices and exchange rates across different time domains. Evidently, the study suggests that Bitcoin showcased the least correlated variable despite its enhanced level of volatility. The study also shows that Australian investors may benefit from diversification with gold. The study also suggests that diversification benefits from the portfolio could last for a maximum period of 6 months. The study highlights the significance of wavelet techniques in helping investors make timely decision making in portfolio diversification analysis.
1. Introduction
One of the core practices of investing is holding a diversified portfolio of asset classes and reducing risk exposure. Consequently, investors always search for investment instruments that do not correlate together and allow more significant hedging opportunities. In recent years, investors have been looking for geographic diversification that produces better risk-adjusted returns, particularly from emerging markets that provide high growth rates of return. Liberalisation and the ease of capital control have encouraged investors to invest across countries. Developed countries started to ease capital controls in the 1980s and 1990s (Yang et al., Citation2003), and then, emerging countries proceeded closely with the same practice. The desire to diversify investment portfolios has triggered massive capital flow across boundaries from developed to developing economies. Different groups of market participants have increased their interest in investing in developing countries as an alternative to conventional asset groups, resulting in the stock market’s financialisation where the stock markets globally are getting increasingly correlated. Therefore, investors are moving beyond the traditional assets’ boundaries by looking at new investment instruments, such as cryptocurrencies to diversify their portfolios.
In the age of technological advancement, when many people are hyping about the “Internet of Things” and are supposed to be connected with everything and anywhere, the fiat currency is also facing a similar dilemma. Currently, cryptocurrencies are becoming mainstream and paper money will be a thing of the past. Cryptocurrencies are predicted to revolutionise payments method and potentially affect the future of world currencies like the US Dollar, which is now facing challenges from the EURO and Chinese Yuan Renminbi (CNY).
Seetharaman et al. (Citation2017) inform us that in the 21st century, a more comprehensive financial market assimilation and a common global currency could arise (Seetharaman et al., Citation2017). Establishing a global currency may be signalling the natural end of the reserve currency regime. Only one money unit is recognised globally, which operates without any foreign exchange. We may have a future free from coined and paper money (Dobija, Citation2014).
Cryptocurrency is an online-based medium of exchange that adopts encryption algorithms to conduct trades. Bitcoin is a pioneer in the cryptocurrencies market. It was introduced in 2008 by Satoshi Nakamoto as a digital currency and payment system. Bitcoin ranks first in size and volume traded among the cryptocurrencies widely used. It is reported to have a market capitalisation of around US$1 trillion by the year 2021. Bitcoin is open source, decentralised and independent from central banks or government agencies. Users can trade directly without the need to authorise transactions by third parties. Bitcoin transactions use encryption algorithms that create unique hashes that are limited in number. The transaction needs a few online networks to be verified, making it akin to exchanging fiat currencies. In order to safeguard its value and ensure its rarity, the issuance of Bitcoins is confined. Currently, the number of Bitcoins circulating in the market is close to 18 million units and can be mined at a maximum of 21 million coins. As of November 2021, one unit of Bitcoin had a market value of US$65,000.
The emergence of cryptocurrencies in recent years has captured many people’s attention due to its high return. Investing US$1,000 into Bitcoins in July 2010 would generate a return of US$8.3 million by 2017. Due to its high return, we expect Bitcoin to have high volatility (Narayan et al., Citation2019) and, to verify it, we apply dynamic conditional correlation of multivariate generalised autoregressive conditionally heteroskedastic models (MGARCH-DCC) in our study. Besides that, we also are interested in investigating the movement of Bitcoin against Australian stock indices and other commodities, such as crude oil and gold to discover diversification opportunities.
Even though the interest in Bitcoin has surged as an instrument of exchange for online trading, empirical evidence on the hedging, diversification and safe haven properties of Bitcoin is still limited. Bouri et al. (Citation2017) exert that Bitcoin serves as a helpful diversifier covering most commodities and stock indices. They also find that Bitcoin preserves safe haven elements that vary between horizons in some instances. Meanwhile, Narayan et al. (Citation2019) find a robust indication that Bitcoin growth contributes to inflation, currency appreciation, and a shrinking money velocity.
Polas et al. (Citation2020) study the relationship between blockchain management systems (BMS) like Bitcoin and Islamic Banking and Finance (IBF). The studies find that BMS, like Bitcoin, would adapt to the restriction of riba (usury) and incorporate maslahah (public interest) and shared risk-sharing criteria (instead of risk-shifting). Islamic law stipulates several requirements that must be fulfilled to be considered halal (permissible). Even though cryptocurrencies are meant to be used as a medium of exchange, they have often been considered a commodity alongside tokens since they function as a store of significant value in the same manner that conventional fiat currencies do. However, it has been shown that a few viewpoints and aspects of Bitcoin are deemed halal, but if one chooses to use it for betting or other harams (non-permissible) activities, one should be aware that it would be considered as haram.
Meanwhile, gold has historically served as a safe haven and asset preservation tool for many investors. Gold is one of the most liquid commodities due to its strong demand. People prefer to possess gold because it can be used for various reasons, including jewellery, money, and investment instrument. Gold investing is seen to be low risk since it protects investors’ wealth amid economic downturns, political instability, inflation, and other unforeseeable calamities. Because of its supremacy, gold has aroused the curiosity of numerous scholars, who have explored the link between gold and other factors, such as stock market indexes, bonds, political events, inflation, and economic statistics. Several factors contribute to gold’s attractiveness as a safe haven compared to other commodities. Gold is regarded as a long-lasting item that is easy to transfer from one region to another, is well recognised by most communities across the globe, and is challenging to fabricate (Worthington & Pahlavani, Citation2007). Furthermore, gold’s reputation as a safe haven asset is enhanced by an excellent long-term return (Lucey, Citation2011).
Previous studies have also shown that gold is an excellent investment for inflation protection. According to Blose (Citation2010) and Wang et al. (Citation2011), public opinion, academia, and policymakers perceive gold as a strong inflation hedge since gold prices tend to rise in synch with the general level of prices. Moore (Citation1990) revealed that gold demand surges when expected inflation moves in upward direction in a particular country. Gold is often seen as a potential investment for portfolio diversification due to its low correlation with other assets. According to Lean and Wong (Citation2015), the poor correlation of gold with other assets is primarily attributable to the distinct drivers of gold prices.
Australia’s economy is strongly reliant on energy consumption, and this need will only expand in the future. Oil was the most significant energy source, accounting for 37% of total energy consumption in 2016. As a result, we can reasonably predict that any fluctuation in oil prices will impact Australia’s economy (Anwar et al., Citation2019). Australia is one of the largest exporters globally and currently ranks number 20. In the year 2018, Australia exported goods and services is US$327 billion and imported US$310 billion, resulting in a positive trade balance of US$17 billion. Australia’s main exports are iron ore, coal, oil and gas, education and personal travel services, gold, and wheat (DFAT, n.d.Footnote1). Since gold and crude oil are among Australia’s most important export commodities, any changes in these commodities’ prices significantly impact Australia’s economy.
Commodities represent two-thirds of Australia’s export value. These commodities’ prices significantly impact the terms of trade, the Australian dollar, national revenue, and aggregate demand. A better understanding of the fundamental determinants of commodity price movements may help us predict how long a shift in commodity prices will endure and how it will affect the Australian economy (Cunningham & Smith, Citation2019).
Asia has seen extraordinary economic growth and industrialisation in the recent decade and Australia has been well-positioned to profit from this prosperity, given its abundant natural resources and closeness to the continent. The growing interest in commodities, such as iron ore, which is used to make steel, has contributed to the mining boom in Australia, which has aided the nation to achieve a remarkable 25 years of economic growth. It has also strengthened Australia’s ties with the Asian market, with 74% of Australian exports flowing to Asia in 2015 (Rock, Citation2016).
Although much research has been done on Australia’s stock indices, literature covering the effect of the Bitcoin, gold, and crude oil shocks on Australia’s conventional and Islamic stock market returns is scarce. Referring to a report by Thomson Reuters (Citation2018) informs that the size of the global Islamic finance industry expanded by approximately 11% to US$2.4 trillion in assets in 2017 or by Compound Annual Growth Rate (CAGR) of 6% from the year 2012 to 2017. The largest Islamic finance markets are Iran, Saudi Arabia, and Malaysia (Thomson Reuters, Citation2018). Due to the high interest in Islamic finance investment, the study on the Shari’ah-compliant stock market is essential to provide Muslim investors with the potential risk and diversification benefits of investment in Australia. These investors can observe the time-varying volatilities across different time scales and the dynamic correlations between Bitcoin and Australian stock indices to find any diversification gains and lessen their risk. We apply wavelet techniques to resolve the issue.
The primary objective of this research is to investigate the dynamic causal relationship between Australia stock indices—Islamic stock index returns (ISIR) and conventional stock index returns (CSIR) with commodities, such as gold, crude oil, and Bitcoin. It will help investors select commodities and indexes relevant to their portfolios, which will boost the Australian economy in the long run. We also incorporated other control variables, such as the bilateral rate of the Australian dollar to the US dollar (AUD/USD) for the robustness test. Further, the Granger causality examines the lead-lag relationship between those six variables.
Our study offers empirical evidence of the “time-varying” and “scale-dependent” volatilities and correlations between Bitcoin, commodities, exchange rates, Islamic and conventional stock indices. By incorporating scale dependence, this research can distinguish unique portfolio diversification opportunities for diverse investors with heterogeneity in investment holding periods. Therefore, we have identified our research questions as below:
Does a cointegrating relationship exist between Bitcoin, crude oil, gold, the exchange rate of AUD/USD, and the Australian stock indices?
Does Bitcoin cause the prices of Australia stock indices and other control variables to change in which past values of Bitcoin price improved the prediction of Australia stock indices and other variables?
Which one is more exogenous at different time intervals among the exogenous variables?
Which variables and indices should investors invest in to obtain portfolio diversification benefits?
How would the portfolio diversification opportunities change across different time scales?
This research anticipates that the study’s outcomes have significant positive contributions to investors who want to diversify their portfolios in different investment horizons. By employing the latest data and relatively recent methodologies, the study tries to achieve the strategic inputs needed by investors that intend to diversify their portfolios in Australian stock indices, Bitcoin, gold, crude oil, and the bilateral foreign exchange of AUD/USD.
We organise our paper as follows: Section 2 assesses the literature explaining Bitcoin, portfolio diversification, and stock market indices. Section 3 explains the methods used to accomplish the objectives of the study. Section 4 provides an in-depth explanation on data analysis and outcomes. Section 5 summarises the outcomes obtained from the analysis using good intuitions and connecting it to the literature’s previous findings.
2. Literature review
Investment activity in Bitcoin is growing due to its strong price growth, and thus research work on the topic is also increasing regularly. Narayan et al. (Citation2019) studied how Bitcoin price growth affects inflation, real exchange rate, and money supply in Indonesia using monthly observations from 2011 to 2018. They find that Bitcoin price growth (BPG) influences Indonesia’s monetary aggregates. Their finding suggests that BPG elevates inflation, boosts Indonesia’s currency, and reduces the money supply. The Central Bank of Indonesia disapproves of the trading of cryptocurrencies, and the research findings provide the basis for the policy position concerning excessive speculation in cryptocurrency trading.
Bouri et al. (Citation2017) used a dynamic conditional correlation specification to investigate the hedging and diversification effects of Bitcoin on the stock indices, commodity index, bonds, gold, oil, and the US dollar. The outcomes show that Bitcoin is useful for diversification and poor as a hedging device. Klein et al. (Citation2018) compared Bitcoin and gold’s characteristics and found that gold and Bitcoin fundamentally differed. Both assets’ structure is different, and gold displayed an essential function in financial markets during the financial crisis. Meanwhile, Bitcoin behaves as the exact opposite of gold. Bitcoin is not an excellent instrument for portfolio diversification because it is positively correlated with a downward markets trend. The researchers also found no evidence for Bitcoin to be regarded as a stable instrument for hedging.
Hanley (Citation2013) notes that Bitcoin has a weak correlation with other currencies. Macroeconomic developments that keep shifting every day cannot affect the price fluctuation in Bitcoin. Hanley also claims that the weakness of Bitcoin cannot be managed and therefore, investors are unable to hedge their shares in Bitcoin. He also argues that Bitcoin has no intrinsic value and that fluctuation toward certain currencies is speculative as it is highly based on market valuation.
Besides Bitcoin, we are also interested in the effect of crude oil and gold against stock indices. Abdullah et al. (Citation2016) investigated the “time-variation” and “time-scale dependent” volatilities and correlations between commodities (such as corn, crude oil, and gold) and Islamic stock indices of Southeast Asian countries to identify any portfolio diversification gains. The research finds that the Singapore Islamic index leads the other Islamic indices and commodities. They also find that an investor holding a crude oil investment position can diversify his fund by investing in the Philippine Islamic stock index for the short term. This is because both the Philippine index and crude oil are less correlated. However, the Philippine index’s high volatility has reduced its potential as an instrument for portfolio diversification. They also stress that an investor who invests in crude oil can experience a high return if they include Malaysia’s Islamic stock index in their portfolio due to the low volatility and correlation of Malaysia’s index against crude oil.
Abdullah and Masih (Citation2016) studied time-varying volatilities and correlations between commodities returns. Their findings imply a theoretical connection between the sample commodities (crude oil, silver, copper, gas, gold, soybean, and corn). The study finds that the crude oil, gas, gold and copper variables lead the other commodities. The study suggests that the gas return has a minimal correlation with the crude oil in the short run, but it offsets its benefit as an instrument for portfolio diversification in the long run, owing to high volatilities. The research also finds that investors with exposure in crude oil secured gain by incorporating corn in their portfolios.
Karim et al. (Citation2021) analysed data from 2006 to 2020 to study how the association between oil and BRICS stock market performance reacts across different investment horizons. The wavelet and MGARCH-DCC analysis show that the equity markets of Russia, Brazil, and South Africa are substantially more correlated with oil price returns over different investment horizons and are much more volatile, especially during the Covid-19 period. The study also revealed that the stock market returns in China and India are less correlated with the oil price return. The result also demonstrates that the oil price leads the BRICS markets, and the two are positively correlated.
To conclude, the literature examining Bitcoin, gold, and crude oil with Australia’s stock market indices is sparse and inconclusive. Therefore, we would like to discuss this subject further to get a better understanding of it.
3. Research methodology
3.1. Data
Our data consist of daily data of Bitcoin, crude oil, gold prices return, the exchange rate of Australian dollar to US dollar (AUD/USD), and Morgan Stanley Capital International (MSCI) of Australian Islamic and conventional stock indices return from 01/09/2011 to 31/12/2021 (2696 observations). Table describes the dataset. All of the research’s data sources are provided by Thomson Reuters DataStream and TradingView.
Table 1. Description of variables
3.2. Standard time series techniques
Multiple time-series techniques shall be used to address the research objectives mentioned in the introduction section. Firstly, after running the unit-root tests to identify the order of integration and selecting the optimal VAR lag order, we utilise the cointegration tests (Johansen approach) and vector error correction model (VECM) to test whether the variables co-move in the long run and to identify the causality between the vectors. Due to the constraints of the statistical software that we use, therefore, we opt to employ Maximum Overlap Discrete Wavelet Transformation (MODWT) to test the causality relationship across varied time intervals.
The theory that we identified for this study was introduced by Markowitz and termed portfolio diversification theory. Markowitz introduced the modern portfolio theory (MPT), which suggests that the volatility of a portfolio containing a series of less perfectly correlated assets’ returns should be less than the weighted average of the volatility of the securities (Markowitz, Citation1959).
Earlier models of MPT assumed the normality of portfolio variances. However, according to Markowitz, the normally distributed variance is insufficient to quantify risk. Several specifications have been tested to capture the asymmetry and fat tail distribution properties, reflecting real-world data. In this study, we employed the MGARCH-DCC method, adopting a student-t distribution of variances to effectively address the fat-tailed distribution property of index returns (Pesaran & Pesaran, Citation2010). In and Kim (Citation2013) explain that the no priori assumptions of distributions under wavelet transform methodologies produce more realistic results.
3.3. Wavelet cross-correlations
Wavelet transformation has been widely employed in time-series analysis (Nason & Sachs, Citation1999). There are three wavelet transformation approaches (In & Kim, Citation2013), namely the Discrete Wavelet Transform (DWT), the modified version of it called Maximal Overlap Discrete Wavelet Transform (MODWT), and Continuous Wavelet Transform (CWT). Both DWT and MODWT help fragment the sample variances of time series across different time scales using squared wavelet coefficients. However, according to Gallegati (Citation2008), the MODWT-based estimator is better than DWT. Therefore, we employ MODWT in this research to obtain the best results.
Whitcher et al. (Citation2000) applied MODWT to calculate the estimates and approximate confidence intervals of wavelet covariance and wavelet correlation between variables. Wavelet covariance quantifies the strength of links between variables X and Y across different time scales. As explained by Gençay and Selçuk et al. (Citation2001b) and Gallegati (Citation2008), the wavelet covariance at scale j corresponds to the covariance between wavelet coefficients of X and Y at that particular scale j, that is . The following equation provides an unbiased estimator of the MODWT wavelet covariance where all boundary conditions are satisfied (Gallegati, Citation2008):
Next, the MODWT estimator of the wavelet cross-correlation coefficients for scale j and lag can be calculated as the ratio between cross-covariance,
and the square root of wavelet variance for variable X and Y, i.e.,,
and
as follows:
The wavelet cross-correlation estimator , has a similar property with standard correlation measure where the value lies between −1 and 1. The value approaching 1 indicates a strong positive relationship while value −1 infers a strong negative correlation on a scale-by-scale basis.
Starting from spectrum of scale j wavelet slopes, it is possible to determine the asymptotic variance Vj of the MODWT wavelet variance (covariance). Then, a random 100(1–2p)% confidence interval for MODWT estimator is built, which is robust to non-Gaussianity for
as explained Gençay and Selçuk et al. (Citation2001b) and Gallegati (Citation2008). Based on past studies on the wavelet variance, it is suggested that the number of wavelet coefficients, Nj = 128 is sufficient enough for good approximation under large sample theory (Gallegati, Citation2008; Whitcher et al., Citation2000).
3.4. Multivariate GARCH-DCC
Next, the study employs the Multivariate Generalized Autoregressive Conditional Heteroscedastic (MGARCH) model of Pesaran and Pesaran (Citation2010) to address the fourth research question. To identify which model is at the optimum level, we assessed for normal and t distributions. The unconditional correlation coefficients’ outcome should be adequate to deliver empirical evidence for our research question number four. For a comprehensive solution to address the fourth objective, we utilise the computation of conditional cross-asset correlations through MGARCH-DCC computation as below:
where qij,t-1 are given by:
In the above, is the (i,j)th unconditional correlation, φ1 and φ2 are estimated coefficients where φ1 + φ2 < 1, and
are the standardized returns.
The mean-reverting process is also tested by estimating (1—λi1—λi2). Some diagnostic tests are performed for robustness checks. To study further the model, one can refer to Pesaran and Pesaran (Citation2010).
3.5. Wavelet coherence
Our research question number five can be answered by applying the continuous wavelet transform (CWT). A few researchers have recently adopted wavelet coherence in the economics, business and finance field; for instance, Nagayev et al. (Citation2016), Dewandaru et al. (Citation2016), and Abdullah and Masih (Citation2016). The original time series contains a single variable time function. The CWT assists us to map one variable time function into time-frequency variables. One of CWT’s most significant advantages is automatically defining the number of time scales depending on the data’s length. The CWT also helps us map the series correlation in a two-dimension which elevates the ability to accentuate the hidden information effectively. Compared to the discrete approach, the CWT method has enhanced visibility due to redundancy traits, making it much easier to interpret. Thus, the analysis becomes more transparent and more comfortable for interpretation.
We employ the Daubechies (Citation1992) least asymmetric wavelet filter of length L = 8, LA (8) for MODWT and CWT. Previous research indicated that a length filter L = 8 is sufficient to handle the high-frequency data (Gençay et al., Citation2001a; In & Kim, Citation2013). Based on past studies, it is reasoned that an LA (8) filter creates smoother wavelet coefficients than other filters, such as the Haar filter. For further explanation, please refer to Gençay et al. (Citation2001a), Gençay & Selçuk et al. (Citation2001b), and In and Kim (Citation2013) for further explanation.
4. Empirical results and discussions
4.1. Descriptive of data
Figure presents raw time-series data for all selected variables. We can identify from the figure that Bitcoin price is highly volatile, wherein in 2017, the price increased and decreased significantly within a short period. We also notice that oil and gold prices are downward, indicating a low demand for both commodities. Meanwhile, the rest of the other variables are upward, except for the exchange rate of AUD/USD. The upward trend of Australia’s indexes reflects a thriving economy and a stable political landscape.
Figure 1. Dynamics of raw time-series data.
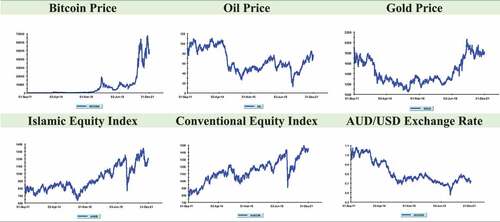
Table shows the descriptive statistics for the variables, given as rt = ln(Pt/Pt 1), where rt is the natural log series return and Pt is the price index at time t. Bitcoin outpaced Australian stock indexes and other commodities in terms of average return. Furthermore, when compared to gold, crude oil, and Australian stock indexes, Bitcoin is the most volatile asset. As a result, in terms of risk-return, Bitcoin seems to be more profitable than Australian stock indexes and other commodities.
Table 2. Descriptive statistics
Table presents the correlations between the variables under study. The highest correlation is found between the Australian Islamic and conventional indices (88%) as expected because companies listed under the Islamic index are also listed under the conventional index (AUSIS is a subset of AUSCON). The exchange rate (AUD/USD) is negatively related to most other assets indicating an inverse relationship. This presents an opportunity for diversification benefits for investors exposed to the selected assets under review. Generally, the variables are weakly linked, implying potentially beneficial portfolio diversification.
Table 3. Correlation matrix
4.2. Findings from standard time-series techniques
The first step in time-series regression is testing the order of integration of all the variables, and we found that all of our selected variables could be taken as I(1) based on ADF tests. Our result also indicated that the best lag VAR order for SBC is one. As shown in Table , the standard Johansen cointegration test was also employed. Taking reference to maximal Eigenvalue statistics and Trace statistics, we found the variables to have one cointegrating vector at a 95% confidence interval. The cointegration result signifies the non-spurious relationship between variables, implying the establishment of the long-run equilibrium. The cointegration result also suggests that the diversification benefits among the selected variables will be naturally lessened due to parallel movement of all variables in the long run.
Table 4. Johansen cointegration tests
However, the cointegration test has limitations because it cannot identify which variable is leading or lagging. A vector error correction model (VECM) with one cointegrating vector (Table ) is applied to solve this issue where VECM can determine which variables are exogenous and endogenous. Results from VECM suggest that the Bitcoin, crude oil and gold prices are exogenous variables, while the Australia stock indices and the exchange rate of AUD/USD are endogenous. This infers that the Australian stock indices and the exchange rate of AUD/USD would respond to the Bitcoin, crude oil, and gold prices. The VECM helps in identifying both short and long-term Granger causality. The error correction term is produced once the long-run cointegrating relationship is established. The joint F-test determines the significance of short-term variables and its lags under the error correction model (ECM) specification. The diagnostic checks on the ECM model (autocorrelation, heteroscedasticity, and functional form) demonstrate that the equations are more or less well-specified.
Table 5. Error correction model of Bitcoin and other variables
The extent of endogeneity or exogeneity is calculated by the proportion of the variance decomposition explained by its past shocks. However, the statistical software Microfit 5, which is used to run the variance decomposition limits the data to 150 only, whereby our total daily data are 2,696. Therefore, we employ MODWT-based wavelet cross-correlations to overcome the limitation of Microfit so that we can determine the causal relationship between the selected exogenous variables.
4.3. Findings from wavelet cross-correlations
The outcome of Figure presents the MODWT-based wavelet cross-correlations between the Bitcoin and crude oil across time scales with its estimated confidence intervals against time leads and lags for all scales. The individual cross-correlation functions correspond to wavelet scales ranging from a low scale of 1–2 days to a high scale of 128–256 days. The red lines represent the 95% confidence intervals bound for wavelet cross-correlation. The curve on the graph will indicate the lead-lag of variables under review. The first variable leads if the curve is significant on the graph’s left side and vice versa. A significant positive wavelet correlation is realized if both 95% confidence interval levels place above the x-axis. On the other hand, a significant negative wavelet correlation is produced if both 95% confidence levels are under the x-axis.
Figure 2. Wavelet cross-correlations: bitcoin price return vs crude oil price return.
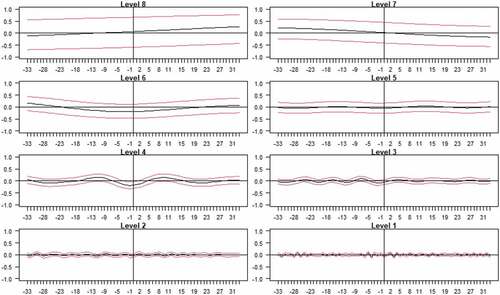
From Figure of the wavelet cross-correlation between Bitcoin price return and crude oil price return, it is observed that:
There is no clear lead-lag relationship evidence between Bitcoin and crude oil at the wavelet levels 1, 2 and 4.
We also spot the graph skewed to the left for levels 3, 6 and 7, indicating that the Bitcoin price return leads the crude oil price return.
At level 5 and 8, the graph skewed to the right, suggesting crude oil price leads Bitcoin price.
By referring to Figure , we can summarise that Bitcoin leads crude oil at almost all levels, implying the dominance of Bitcoin over crude oil. Even though Bitcoin leads crude oil, the two variables are the least correlated as indicated by Table . Therefore, there is an opportunity for diversification benefits between the two assets class. However, Bitcoin is decentralised and not regulated by any authority, which leads to its price movement being different from other fiat currencies (Dyhrberg, Citation2016). Cheah and Fry (Citation2015) summarised that Bitcoin is a speculative bubble with no intrinsic value. Therefore, investors are advised to take extra precautionary measures to select Bitcoin as a diversification instrument against crude oil.
Table 6. Estimates of λi1 and λi2, and δ1 and δ2
Table 7. Estimated unconditional volatility and correlation matrix
Table 8. Ranking of unconditional correlations
We proceed with Figure , which highlights the wavelet cross-correlation between Bitcoin and gold price returns. This diagram derives the following facts:
There is no clear lead-lag relationship evidence between Bitcoin and gold at the wavelet levels 1, 2, and 4.
The graph skewed to the right-hand-side at levels 3, 7 and 8. This may imply that the gold leads Bitcoin.
At the wavelet scale 5, it is observed that the graph skewed to the left, which implies that the Bitcoin price return leads the gold price return.
Figure 3. Wavelet cross-correlations: bitcoin price return vs gold price return.
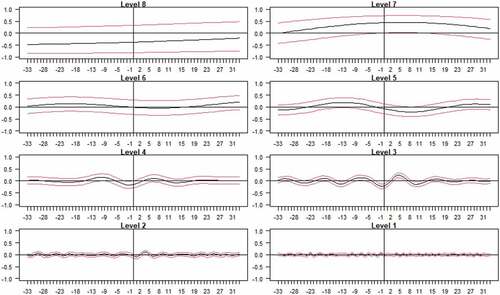
The result indicates that at a higher level, gold leads Bitcoin and this is as per our expectation that gold as one of the leading export commodities for Australia can influence Bitcoin. Our finding is also in line with Eichengreen (Citation1992) stating that gold is a safe haven asset and can be utilised as a portfolio diversification instrument and gold is also often promoted as a hedge against inflation. We can summarise that gold will lead other variables in the long run because gold is always regarded as a safe haven instrument in a good and bad times. Meanwhile, Dyhrberg (Citation2016) states that Bitcoin characteristics are parallel to gold because both assets react similarly to external shock. He also stresses that both instruments have similar hedging abilities and respond in the same direction to good and bad news.
The results from the wavelet cross-correlation between crude oil price return and gold price return as per Figure suggest that:
We find no clear lead-lag relationship between crude oil and gold at wavelet levels 1, 2, 3, 4, and 5.
The graph skewed to the left at the wavelet levels 6, 7 and 8, signifying that the crude oil price return leads the gold price return.
Figure 4. Wavelet cross-correlations: crude oil price return vs gold price return.
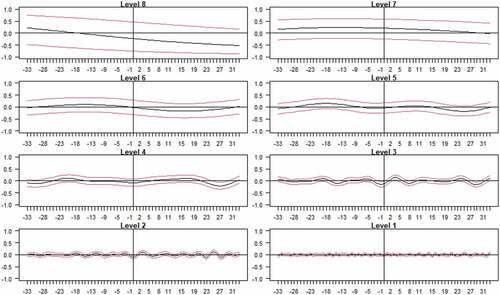
It can be concluded that the crude oil price return leads the gold price return in the long run with a positive correlation. This is in line with our expectations because crude oil is a high volume traded commodity globally and is the source of fuel and energy. Even though gold is one of the most prominent export materials for Australia, however, the significance of crude oil for the global market is glaring. Therefore, the crude oil price return drives gold price return at the higher levels is consistent with expectation.
4.4. Findings from MGARCH-DCC
We proceed with the MGARCH-DCC technique to assess the selected variables’ diversification benefits to address the fourth research question. Table presents the maximum likelihood parameters of and
for the selected variables and the
and
that compare a multivariate normal distribution with multivariate student t-distribution. The maximized log-likelihood value under the t-distribution specification is 49,732, significantly higher than the normal distribution (49,105). The degree of freedom for the student t-distribution is 7.9 (under 30), suggesting that t-distribution is suitable for capturing the fat-tailed property of stock returns.
The on-diagonal parts of Table exhibit the estimated unconditional volatilities while off-diagonal elements represent the unconditional correlations. The values shown in parenthesis represent the highest ranking of unconditional volatility to the lowest ranking. The results imply that Bitcoin and crude oil prices are more prone to fluctuate due to speculative trading. The exchange rate return of AUD/USD shows the lowest volatility, implying the Australian economy as a steady and robust market in the Asia-Pacific region. Australia’s conventional index is the second-lowest volatile variable, strengthening the assumption that Australia has a stable and robust economy.
Identifying the unconditional correlations of the selected variables is more relevant to our research objectives. Table ranks the unconditional correlations (from the highest to lowest) for all the selected variables in this study. The ranking informs us of two crucial facts. First, for almost all variables under review, the lowest correlation is with Bitcoin (see notation “a” in Table ). For optimal portfolio diversification benefits, investors should include Bitcoin in their portfolios. However, the high volatility of Bitcoin (as displayed in Table ) diminish its full potential as a hedging and diversification instrument. Second, Table also indicates that investors who invest in Australian stock indices are better off with diversification in gold than Bitcoin or other variables under review. Gold plays a vital role as an almost ideal hedge instrument against inflation (Worthington & Pahlavani, Citation2007) and it has been used traditionally as a safe haven during financial, political, and economic crises. Dyhrberg (Citation2016) pointed out that Bitcoin and gold are quite similar in many aspects where both instruments behave similarly to other variables in his study, and both instruments have similar hedging capacity and react symmetrically to good and bad news. Australia is the second-largest producer of gold in the world and therefore, gold should be a natural selection as a diversification instrument for traders with exposure in Australian indices.
The analyses and assumptions made in this study on volatilities and correlations are subjected to an unconditional basis where the volatilities and correlations values are simply measured using average values. This assumption’s shortcoming is that it does not adhere to the intuition to assume the volatility and correlation to remain constant over 10 years. It is more reasonable to expect the dynamic nature of volatility and correlation; hence it would be appropriate to apply the MGARCH-DCC model.
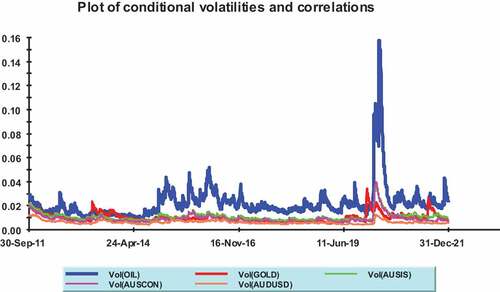
We continue our research by observing the temporal spectrum of volatility. Charts 1 and 2 depict the conditional volatilities for the six variables. Chart 1 below shows that the most volatile variable is Bitcoin during those 10 years under observation. Meanwhile, AUD/USD has the lowest volatility throughout the 10 years (please refer to Chart 1 and 2). Bitcoin price return is highly volatile (especially in June–September 2013 due to positive and negative news related to Bitcoin being published in that period) compared against other variables and it randomly volatile throughout those 10 years observation. Therefore, it is impossible to invest in Bitcoin due to its high volatility relative to other variables. Crude oil is the second-highest volatile variable and therefore, it has a higher risk than other variables (excluding Bitcoin), suggesting that it is also not suitable as a safe haven for diversification and hedging instruments. We also notice that the exchange rate of AUD/USD is the most stable variable compared to the rest, followed by Australia’s conventional stock index return (see, Chart 2). The findings from Charts 1 and 2 agree with Table , where both outcomes indicate low volatility of AUD/USD. The low volatility of the exchange rate of AUD/USD makes it an attractive instrument to be included in investors’ portfolios for diversification benefits. We can also see, from Charts 1 and 2 that throughout the early part of 2020, when Covid-19 swept the world, crude oil and Bitcoin prices were very volatile, owing to worry about the pandemic.
Chart 1. Conditional volatilities of Australia stock indices return and other variables.
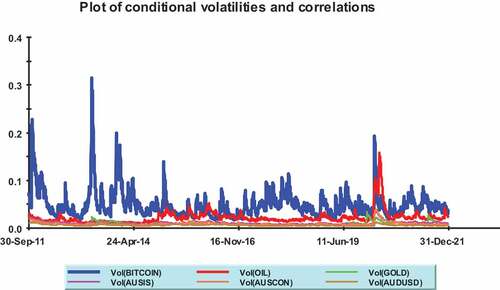
Chart 2. Conditional volatilities of Australia stock indices return and other variables (Excluding bitcoin).
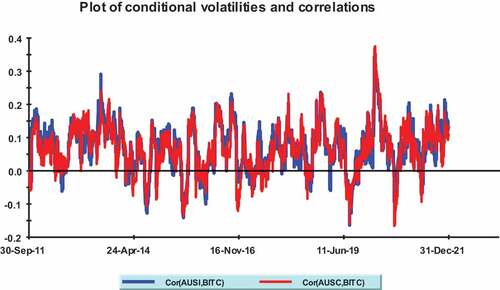
By referring to the conditional correlations as displayed in Chart 3 below, we set side by side the correlation between Australian stocks indices returns with Bitcoin. The results depicted that from 2011 to 2021, the correlation of Bitcoin with Australia stock indices return is in a stable condition. The correlation between Bitcoin and Australia’s Islamic stock index return is higher (blue colour), making it an improper choice for a diversification investment portfolio than the conventional stock index return (red colour). By referring to Table , we find that the lowest correlation of Bitcoin is with the exchange rate return of AUD/USD. Therefore, an investor exposed to Bitcoin can diversify their investment by holding Australian bonds or fixed deposits in any Australian bank.
Chart 3. Conditional correlation of bitcoin price return with Australia Islamic and conventional indices return.
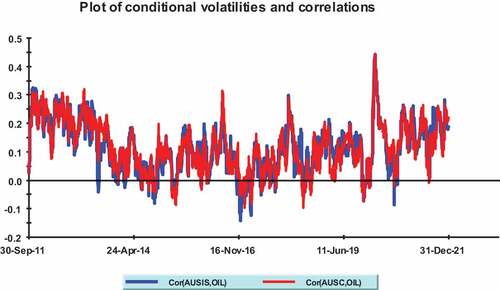
Crude oil price return displays the second-lowest correlation with Australia ISIR (please refer to Table ) and therefore, we can infer that Australia ISIR is an appropriate candidate for portfolio diversification with crude oil. Bitcoin is also a good diversification tool for traders exposed to crude oil because the latter has the lowest correlation with Bitcoin (as presented in Table ). However, both variables are highly volatile, and investors should be cautious if their portfolio consists of these two variables.
From Chart 4 below, it is observed that the correlation of crude oil and Australian stock indices return in downtrend from 2011 to 2014. However, from 2014 onward, the correlations display a slight uptrend until 2018. After that, it continues with a downward trend. The downward trend indicates a high opportunity for diversification benefit between Australian stock indices and crude oil in the future. The result also agrees with Table that crude oil depicts a low correlation with Australian indices, presenting an opportunity for diversification benefits. Charts 3 and 4 show that the variables under study are significantly correlated during the early period of 2020 due to the Covid-19 pandemic, which causes market panic. The high correlation implies that the variables had little potential for diversification during the early stages of the pandemic.
Chart 4. Conditional correlation of crude oil price return with Australia Islamic and conventional indices return.
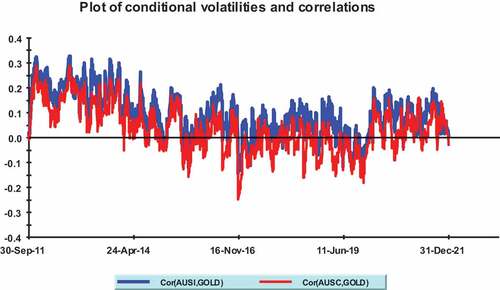
Meanwhile, the gold price returns have a lower correlation with Australia CSIR compared to ISIR. An investor holding a portfolio in gold is more desirable with diversification in Australia CSIR than Australia ISIR. This is because Australia ISIR volatility and correlation are higher than Australia CSIR, which reduces its benefit for portfolio diversification. This finding is in line with the result from Table , indicating that Australia CSIR has a lower correlation with gold than ISIR. From Chart 5 below, we noticed that the correlation of gold with Australia stock indices return is in a downward trend from 2011 to 2019. This suggests an increase of opportunity for diversification benefit between gold price return and Australia stock indices return.
Chart 5. Conditional correlation of gold price return with Australia Islamic and conventional indices return.
4.5. Correlation of Australian conventional and Islamic stock indices with other variables at different time and investment horizons
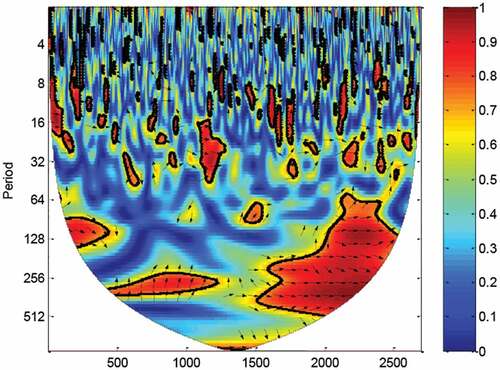
The research continues with wavelet coherence results presented in Chart 6 to 14 below, displaying the difference phase for all selected variables from wavelet scale 1 (1 day) up to scale 9 (approximately two trading years, 512 days). The trading days are shown by x-axis (please refer to Table for the date on x-axis), whereas the y-axis represents the investment interval. The curved line below which is constructed based on Monte Carlo simulation, displays the 5% significance level. The figure shows a colour code with power ranging from red (indicating high correlation) to blue (low correlations).
Chart 6. CWT—Bitcoin vs Australia ISIR.
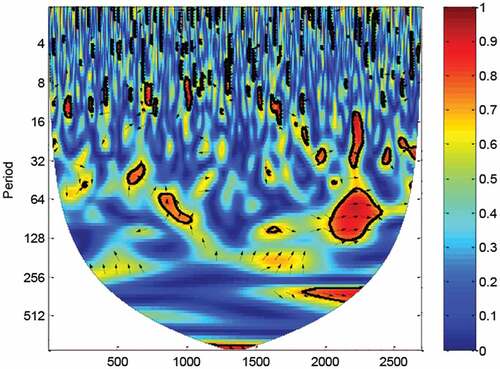
Table 9. Date for horizontal axis (September 2011 to December 2021)
The correlation between indices and other variables can be studied meticulously with this wavelet technique to ensure investors gain from portfolio diversification. Chart 6 and 7 below show that investors who invest in Australia Islamic and conventional stock indices and simultaneously have exposure in Bitcoin can hold their portfolios as long as they want because the correlation between Bitcoin and Australia stock indices is low. The result is consistent with our finding using the MGARCH-DCC method indicating that Australian stock indices have a low correlation with Bitcoin (please refer to Table ). We can also observe in Charts 6 and 7 that during the early stages of the epidemic, the correlation of Bitcoin with Australia indices is strong, which is consistent with our findings in Chart 3.
Chart 7. CWT—Bitcoin vs Australia CSIR.
Charts 8 and 9 display the correlation between Australian stock indices and crude oil. We notice that investors who hold a portfolio of crude oil and Australian stock indices should not maintain the portfolio for more than 6 months (within 1 day to 128 days) to maximise the diversification benefit. If their investment is beyond 6 months or more than 128 days, they will be exposed to a high correlation between the variables mentioned. We find that crude oil’s correlation with the Australia Islamic stock index is higher than the Australian conventional stock index in the period beyond 128 days. Even though the correlation between crude oil and Australia ISIR is lower than CSIR (as indicated in Table ), it is only relevant in the shorter time frame within 1 day to 128 days as identified by Chart 8 and 9. This could be due to many companies involved in crude oil and energy being listed under the Islamic stock index. We also notice that Australian stock indices are more reactive to the crude oil price fluctuation compared against Bitcoin price fluctuation because Australia is a net importer of crude oil, her primary energy source. During the Covid-19 pandemic phase beginning in 2020, the correlation between crude oil and the indexes is strong from 64 days onward. The significant correlation persisted for a few months at the start of the pandemic before returning to normal.
Chart 8. CWT—Crude Oil vs Australia ISIR.
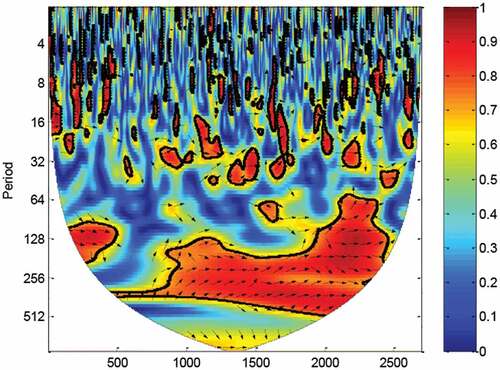
Chart 9. CWT—Crude Oil vs Australia CSIR.
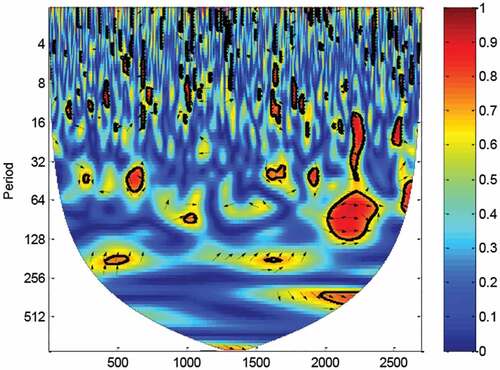
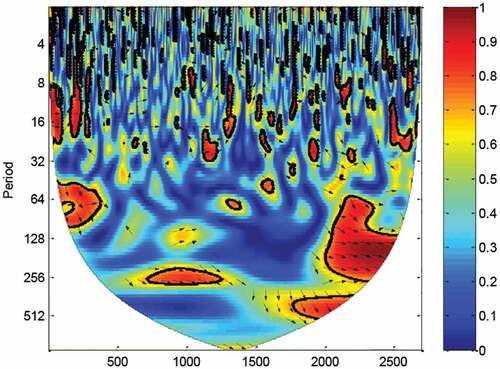
The correlation between the Australian stock indices and the gold price is quite identical to the correlation between the crude oil price, with the difference that the Covid-19 pandemic era did not effect on the gold price correlation with the Australian indices. Based on Chart 10 and 11, investors can gain diversification benefits under the low-scale regime below 64 days holding period because the correlation between the stock indices return and gold prices return low in that time frame. At the high-scale period from 64 days onwards, the correlation between the variables is soaring, minimising the portfolio’s diversification benefits. Between 16 days to 64 days, the high correlation among the variables is scattered in a certain period, but most of the time, the two variables’ correlation is low. Using the MGARCH-DCC technique, it is found that the degree of association between gold and Australia conventional stock index is the lowest among all variables under review (please refer to Table ). This implies that gold is the best instrument for hedging and diversification with Australia conventional stock index, but investors will obtain the most diversification benefits at the holding period of 64 days and below. Beyond that period, the correlation between the two variables is peaked as shown in Chart 10.
Chart 10. CWT—Gold vs Australia ISIR.
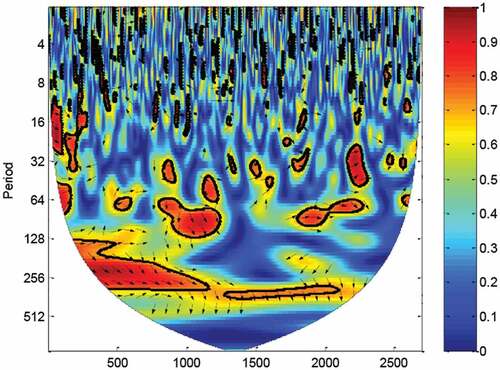
Chart 11. CWT—Gold vs Australia CSIR.
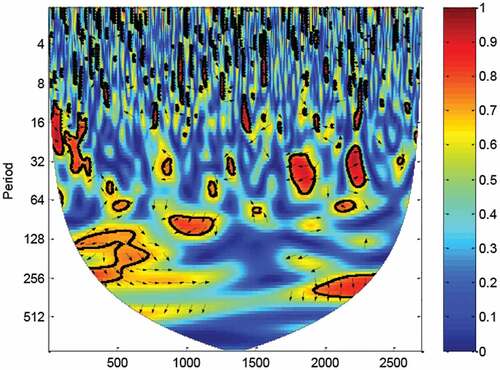
Chart 12, 13 and 14 shows that the AUD/USD displays the lowest correlation with Bitcoin than crude oil and gold prices return. The result is in line with our findings from MGARCH-DCC analysis, as displayed in Table . The correlation between AUD/USD and Bitcoin is low for all holding period except for the holding period between 64 and 128 days. During this holding periods, we noticed a high correlation in the year 2017 to 2018 due to the spike in the price of Bitcoin that reached almost USD20,000 per unit during that time.
Chart 12. CWT—AUD/USD vs bitcoin.
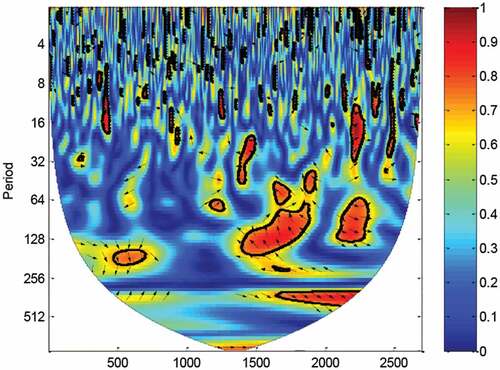
Chart 13. CWT—AUD/USD vs gold.
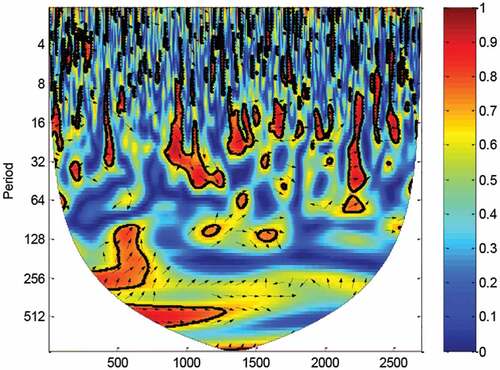
Chart 14. CWT—AUD/USD vs crude oil.
AUD/USD correlation is highest with gold as shown by Table . However, a close inspection to Chart 13 displays a noticeable correlation appearing in the investment period longer than 256 days. For the time frame below 256 days, investors still can select gold in their portfolio together with AUD/USD.
Besides gold, any investor with exposure in AUD/USD can also obtain diversification benefits with crude oil price return, as shown in Chart 14 below. The correlation between AUD/USD and crude oil is very low from 256 days to 512 days of trading interval. The correlation for the period before is also low except for the holding period between 64 days to 128 days, where we notice a high correlation from 2012 to 2013. During that period, the crude oil prices reached USD100 per barrel and we assume that this incident led to a high correlation with AUD/USD.
5. Concluding remarks
This research focuses on finding diversification benefits for Australian stock indices and other variables under review. The research objectives were achieved after applying a few relevant modern techniques, such as cointegration test, error-correction model, MODWT-based wavelet cross-correlations, CWT-based wavelet coherence and MGARCH-DCC. We can summarise our findings as follows:
Cointegration tests indicate a long run cointegrating association between Australian stock indices and the selected variables. We can conclude that all variables tend to move in the same direction in the long run, and diversification benefits will be reduced in the future. After testing for the vector error-correction model, we also find that Bitcoin, crude oil and gold price returns are exogenous, whereas the Australian stock indices and the exchange rate of AUD/USD are endogenous. The results suggest that the Australia Islamic and conventional stock indices return and the exchange rate return of AUD/USD would respond to changes in the Bitcoin, crude oil, and gold price return.
Secondly, by referring to wavelet-based different investment horizon cross-correlation results, we can conclude that at the higher scale, gold leads Bitcoin. We tend to believe that gold leads Bitcoin mainly because gold has been traditionally used as a hedge against inflation and economic recession. Gold is also well known to be utilised as a safe haven with high volatility with other commodities. Therefore, Bitcoin is expected to follow the gold in the long run. Results also indicate that crude oil leads gold at the higher scales. Crude oil is the most critical commodity globally, whereas gold stands at only number four as one of the most traded commodities. Australia relies heavily on crude oil as the primary energy source for its daily activities. The heavy reliance on oil has led to high demand for crude oil in the market. These factors make crude oil the most critical commodity globally, in line with our expectation that crude oil leads gold in the long term.
Thirdly, we find that the AUD/USD exchange rate has the lowest volatility after assessing our data using the MGARCH-DCC method. The results imply that the Australian economy is healthy, and it is reflected through a stable currency. Besides that, AUD/USD is also the least correlated with Bitcoin. It is recommended that an investor with Bitcoin exposure investing in AUD/USD to obtain diversification benefits. Australia’s conventional stock index has the second-lowest correlation with Bitcoin and therefore, Bitcoin can be a suitable instrument for diversification of investment portfolio for investors with exposure in the conventional index. Our analysis also indicates that an investor who holds Australian Islamic or conventional indices can reap diversification benefits by including gold in his portfolio. This is because both indices have the lowest correlation with gold.
Finally, the wavelet-based coherence results indicate that diversification benefits can be obtained for Bitcoin and Australian stock indices in all investment horizon periods because the correlation between these two variables is minimal. The results are also in line with the findings from the MGARCH-DCC that suggests that Bitcoin is among the least correlated with Australian stock indices. The least correlation with Australian stock indices is gold as indicated by MGARCH-DCC results but to obtain the highest diversification benefits, investors are advised to hold the investment within 64 days only. Any stock-holding period beyond 64 days will expose the investor to a high correlation of the variables leading to fewer diversification benefits.
Through this research, we can appreciate the perspectives of all relatively modern techniques utilised in this analysis, which allow us to understand the opportunities for diversification of portfolios across different investment horizons that support heterogeneous investors.
There are several limitations of the study. First, due to the data availability issue of sample variables, the period of the study only starts from September 2011. Given this, the study does not cater for the effect of the 2008 global financial crisis on the diversification benefits for Australian stock indices and other variables. However, the study incorporates the Covid-19 effect in analysis providing interesting inputs for existing literature. Secondly, the study does not directly test the green growth effect to diversification benefits despite that crude oil price is considered one of the analysis’s critical variables. The study does not investigate specific events of high or low energy commodity prices because it is beyond the scope of the study. Given a significant interest in Environmental, Social, and Governance (ESG) investing as part of growth opportunities, it is highly recommended for future studies to investigate the significant relationship of green trade and green growth on diversification benefits, particularly in the Australian market.
Disclosure statement
No potential conflict of interest was reported by the authors.
Additional information
Funding
Notes on contributors

Ahmad Monir Abdullah
Ahmad Monir Abdullah is currently a Senior Lecturer at the National University of Malaysia (UKM). He has vast experience as an academician as well as a practitioner. Dr Monir is also a Chartered Accountant registered under the Malaysian Institute of Accountants (MIA). He has more than 10 years of working experience with multinational companies like KPM, Seadrill Ltd, Sapura Kencana Berhad and Kumpulan Fima Berhad. After obtaining his PhD from INCEIF, Dr Monir shifted his attention to the academic world, where he started teaching at UNIKL and spent 8 years there. After that, Dr Monir joined UKM and has been teaching there for almost one year and has produced a few articles in reputable journals, such as Borsa Istanbul Review, Journal Pengurusan, Asian Journal of Accounting and Governance, Asian Academy of Management Journal of Accounting and Finance and Advanced Science Letters.
Notes
1. DFAT (n.d.). Trade, investment and economic factsheets. Department of Foreign Affairs and Trade of Australia. Accessed from: https://dfat.gov.au/about-us/publications/trade-investment/Pages/trade-investment-and-economic-factsheets.aspx.
References
- Abdullah, A. M., & Masih, M. (2016). Diversification in crude oil and other commodities: A comparative analysis. Asian Academy of Management Journal of Accounting and Finance, 12(1), 101–29. https://web.usm.my/journal/aamjaf/vol%2012-1-2016/aamjaf120116_05.pdf
- Abdullah, A. M., Saiti, B., & Masih, M. (2016). The impact of crude oil price on Islamic stock indices of South-East Asian countries: Evidence from MGARCH-DCC and Wavelet approaches. Borsa Istanbul Review, 16(4), 219–232. https://doi.org/10.1016/j.bir.2015.12.002
- Anwar, M., Rasul, M. G., Ashwath, N., & Nabi, M. N. (2019). The potential of utilising papaya seed oil and stone fruit kernel oil as non-edible feedstock for biodiesel production in Australia—A review. Energy Reports, 5, 280–297. https://doi.org/10.1016/j.egyr.2019.02.007
- Blose, L. E. (2010). Gold prices, cost of carry, and expected inflation. Journal of Economics and Business, 62(1), 35–47. https://doi.org/10.1016/j.jeconbus.2009.07.001
- Bouri, E., Molnár, P., Azzi, G., Roubaud, D., & Hagfors, L. I. (2017). On the hedge and safe haven properties of Bitcoin: Is it really more than a diversifier? Finance Research Letters, 20, 192–198. https://doi.org/10.1016/j.frl.2016.09.025
- Cheah, E. T., & Fry, J. (2015). Speculative bubbles in bitcoin markets? An empirical investigation into the fundamental value of bitcoin. Economics Letters, 130, 32–36. https://doi.org/10.1016/j.econlet.2015.02.029
- Cunningham, M., & Smith, E. (2019). Exploring the supply and demand drivers of commodity prices. Australian Economy. https://www.rba.gov.au/publications/bulletin/2019/jun/exploring-the-supply-and-demand-drivers-of-commodity-prices.html
- Daubechies, I. (1992). Ten lectures on wavelets. Philadelphia: Society for Industrial and Applied Mathematics, 61, 198–202.
- Dewandaru, G., Masih, R., & Masih, A. M. M. (2016). What can wavelets unveil about the vulnerabilities of monetary integration? A tale of Eurozone stock markets. Economic Modelling, 52, 981–996. https://doi.org/10.1016/j.econmod.2015.10.037
- Dobija, M. (2014). The global currency area a way to constructively end the era of reserve currency. Modern Economy, 05(4), 289–302. http://dx.doi.org/10.4236/me.2014.54029
- Dyhrberg, A. H. (2016). Bitcoin, gold and the dollar–A GARCH volatility analysis. Finance Research Letters, 16, 85–92. https://doi.org/10.1016/j.frl.2015.10.008
- Eichengreen, B. J. (1992). Golden fetters: The gold standard and the great depression, 1919–1939. Oxford University Press.
- Gallegati, M. (2008). Wavelet analysis of stock returns and aggregate economic activity. Computational Statistics & Data Analysis, 52(6), 3061–3074. https://doi.org/10.1016/j.csda.2007.07.019
- Gençay, R., Selçuk, F., & Whitcher, B. (2001a). Differentiating intraday seasonalities through wavelet multi-scaling. Physica A: Statistical Mechanics and Its Applications, 289(3), 543–556. https://doi.org/10.1016/S0378-4371(00)00463-5
- Gençay, R., Selçuk, F., & Whitcher BJ. (2001b). An introduction to wavelets and other filtering methods in finance and economics. Academic Press.
- Hanley, B. P. (2013). The false premises and promises of bitcoin. https://arxiv.org/ftp/arxiv/papers/1312/1312.2048.pdf
- In, F., & Kim, S. (2013). An introduction to wavelet theory in finance. World Scientific Publishing.
- Karim, M. M., Chowdhury, M. A. F., & Masih, M. (2021). Re-examining oil and BRICS’stock markets: New evidence from wavelet and MGARCH-DCC. Macroeconomics and Finance in Emerging Market Economies, 1–19. https://doi.org/10.1080/17520843.2020.1861047
- Klein, T., Thu, H. P., & Walther, T. (2018). Bitcoin is not the new gold–A comparison of volatility, correlation, and portfolio performance. International Review of Financial Analysis, 59, 105–116. https://doi.org/10.1016/j.irfa.2018.07.010
- Lean, H. H., & Wong, W. K. (2015). Is gold good for portfolio diversification? A stochastic dominance analysis of the Paris stock exchange. International Review of Financial Analysis, 42, 98–108. https://doi.org/10.1016/j.irfa.2014.11.020
- Lucey, B. M. (2011). What do academics think they know about gold. The Alchemist, 62, 12–14. https://papers.ssrn.com/sol3/papers.cfm?abstract_id=1908650
- Markowitz, H. (1959). Portfolio selection: Efficient diversification of investments (Vol. 16). John Wiley.
- Moore, G. H. (1990). Analysis: Gold prices and a leading index of inflation. Challenge, 33(4), 52–56. https://doi.org/10.1080/05775132.1990.11471444
- Nagayev, R., Disli, M., Inghelbrecht, K., & Ng, A. (2016). On the dynamic links between commodities and Islamic equity. Energy Economics, 58, 125–140. https://doi.org/10.1016/j.eneco.2016.06.011
- Narayan, P. K., Narayan, S., Rahman, R. E., & Setiawan, I. (2019). Bitcoin price growth and Indonesia’s monetary system. Emerging Markets Review, 38, 364–376. https://doi.org/10.1016/j.ememar.2018.11.005
- Nason, G. P., & Sachs, R. V. (1999). Wavelets in time-series analysis. Philosophical transactions of the royal society of London. Series A: Mathematical, Physical and Engineering Sciences, 357(1760), 2511–2526. https://www.semanticscholar.org/paper/Wavelets-in-time-series-analysis-Nason-Sachs/d01177287461b24f6695d0db2a6ae7f5925707b8
- Pesaran, B., & Pesaran, M. H. (2010). Time series econometrics using microfit 5.0: A user’s manual. Oxford University Press, Inc.
- Polas, M. R. H., Muhibbullah, M., & Bhattacharjee, A. (2020). Is bitcoin halal or haram in the Islamic banking and finance? An overview. Journal of Economics, Business and Market Research, 1(2), 96–104. https://www.scitcentral.com/documents/700b641e127b164415ec0ba36ea0041e.pdf
- Rock, B. (2016). Here’s how Australia could continue to ride the Asian boom. https://www.businessinsider.com/sc/how-australia-benefits-from-the-asian-economy-2016-12
- Seetharaman, A., Saravanan, A. S., Patwa, N., & Mehta, J. (2017). Impact of bitcoin as a world currency. Accounting and Finance Research, 6(2), 230–246. https://doi.org/10.5430/afr.v6n2p230
- Thomson Reuters. (2018). Islamic finance development report 2018: Building momentum, 1–44.
- Wang, K. M., Lee, Y. M., & Thi, T. B. N. (2011). Time and place where gold acts as an inflation hedge: An application of long-run and short-run threshold model. Economic Modelling, 28(3), 806–819. https://doi.org/10.1016/j.econmod.2010.10.008
- Whitcher, B., Guttorp, P., & Percival, D. B. (2000). Wavelet analysis of covariance with application to atmospheric time series. Journal of Geophysical Research: Atmospheres, 105(D11), 14941–14962. https://doi.org/10.1029/2000JD900110
- Worthington, A. C., & Pahlavani, M. (2007). Gold investment as an inflationary hedge: Cointegration evidence with allowance for endogenous structural breaks. Applied Financial Economics Letters, 3(4), 259–262. https://doi.org/10.1080/17446540601118301
- Yang, J., Khan, M., & Pointer, L. (2003). Increasing integration between the United States and other international stock markets? Emerging Markets Finance and Trade, 39(6), 39–53. https://doi.org/10.1080/1540496X.2003.11052558