
 ?Mathematical formulae have been encoded as MathML and are displayed in this HTML version using MathJax in order to improve their display. Uncheck the box to turn MathJax off. This feature requires Javascript. Click on a formula to zoom.
Abstract
This paper aims to minimize the emissions in the supply chain consisting of a vendor and a buyer under carbon regulations. Emissions from the supply chain are generated by several operations, namely production, transportation and storage, and are sought to be reduced by implementing a carbon tax policy. To cope with the carbon policy, the vendor is actively looking for the best strategy to reduce emission rates, one of which is by investing in green technology. Besides being able to reduce the amount of carbon produced, the investment made can also save the amount of energy needed in the production process. To support the investment, the government provides green incentives, the amount of which is determined based on the achievement of emission reduction targets. The objective of the proposed model is to simultaneously determine the review period, safety factor, number of shipments and green investment such that the joint total cost is minimised. An efficient method is developed in this paper to obtain the optimum solution for the model. A numerical example and a sensitivity analysis are provided to illustrate the application of the model and to examine the impact of key parameters on model behaviour and performance. The result indicates that the implemented green policies, namely carbon tax, green incentive and green investment, can improve the economic and environmental performances of the supply chain.
1. Introduction
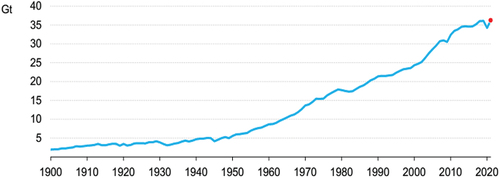
Global warming is one of the most pressing environmental threats today, as the increase in energy consumption and carbon emissions causes a frightening impact on our environment. The Covid-19 pandemic has led to reduced energy demand in 2020, leading to a 5.2% reduction in global carbon emissions. However, the rapid economic recovery, driven by fiscal stimulus policies and mass use of vaccines, restored energy demand in 2021 (see Figure ). Global carbon emissions resulting from energy burning and industrial processes increased again in 2021. Compared to 2020, the emission levels rose by 6% in 2021, pushing the total emissions to 36.3 gigatons. Figure shows the increase of global emissions from 1900 until 2021.
Figure 1. Global carbon emissions from 1900 to 2021.
Increased awareness of the adverse effects of global warming on life has prompted researchers and practitioners to consider the effects of carbon emissions on operational decision-making. One of the operational decisions at the supply chain level that becomes a key determinant in efforts to reduce emissions is the decisions related to inventory management. This is because inventory decisions have a major influence on the running of important activities, such as production, storage and transportation. These activities are known as emission contributor activities in the supply chain. By implementing good inventory management, companies can maintain the emissions produced while minimizing costs. Without doubt, it is not an easy task as the companies have to deal with several system limitations as well as pressure from the government. One possible pressure is the carbon policy introduced by the government that limit the amount of carbon generated from a particular process or operations.
Carbon tax has been the most popular policy implemented by regulators in many countries. Some countries, including Canada, China, Sweden and India have used such policy to cut down the emissions from industries and set target for emission reduction. For example, Canada has set a target emission reduction plan in 2030 of 30% below the emission level produced in 2002. While China has set a target of reducing emissions in 2030 of 68% below the emission level in 2005 (Bai et al., Citation2020). The increasing rate of global warming has also prompted regulators in several countries to tighten carbon taxes. For example, in January 2020, the Norwegian government has increased the tax by 8.16% from the tax set in 2019. The Portuguese government has taken the same step by increasing taxes by 84.62% in 2020 (Alegoz et al., Citation2021).
Increasingly stringent carbon policies issued by the government have pushed companies to seek strategies to lessen such emissions from their activities. One of the best strategies that can be done is to invest in green technologies (Huang et al., Citation2020; Lukas & Welling, Citation2014). Although green technology is relatively more expensive than the conventional technology, the emissions produced will be much lesser so that it is in line with the demands for emission reductions. Therefore, green technology investment is a very interesting aspect for managers to pay attention to, because its implementation will have a significant impact on the company’s operational decisions and overall supply chain performance. In certain conditions, the government needs to provide a stimulus in the form of green incentives so that companies are encouraged to achieve emission reduction targets. The incentives provided can encourage companies to invest more in green technology thereby increasing the opportunities to reduce emissions. For example, the Indian government provided incentives, namely Unnat Jyoti by Affordable LEDs for All (UJALA), to encourage industries to use LED lights and introduced financial supports to adopt green technologies (Ujala, Citation2021). The US government provided its industry sector with $7500 incentives to procure electric vehicles (Helveston et al., Citation2015). The Malaysian government launched a green incentives scheme to encourage green product production and to promote green products to customers (MIDA, Citation2018).
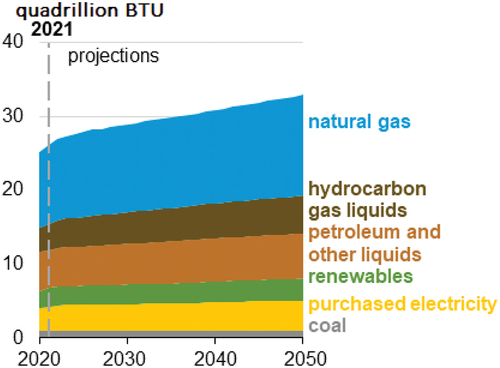
Meanwhile, the increasing environmental awareness related to energy shortages has pushed companies to cut down their energy consumption. Figure shows the projected energy consumption growth of industries from year 2020 to 2050. The energy consumption is predicted to increase from year to year which is feared to trigger greater emission expenditures. Energy is a vital requirement for the production process and its existence is closely related to the emissions generation. In some countries, such as Norway and Sweden, the governments are very active in encouraging companies to produce more energy-efficient products (Li & Li, Citation2017; Shao et al., Citation2017). They levied lower taxes on companies that seek to conserve energy. The adoption of the above green policies will certainly be closely related to these energy saving efforts. In addition, the implementation of these green policies will have a major impact on inventory decisions in the supply chain. By considering these, we seek to answer the following questions:
Figure 2. Industrial energy consumption by fuel.
What are the impacts of implementing green policies on energy consumption and emission generation in the supply chain?
What are the impacts of implementing green policies on inventory management in the supply chain?
In this study, we focus on developing a joint economic lot-sizing problem (JELP) consisting of a single vendor and single buyer under the periodic review policy, integrating energy usage and emissions reduction. A carbon tax policy and investment strategy in green technologies are considered to cut down emissions from certain operations in the supply chain. Additionally, green incentives based on emission reduction target is also incorporated to encourage the industries to reduce their emissions.
2. Literature review
Our study relates to three important streams, namely (1) Inventory models in supply chain system, (2) Supply chain inventory model with carbon emissions, and (3) Supply chain inventory model with periodic review. Our reviews to both streams are described in the following subsections.
2.1. Inventory models in supply chain system
The first research dealing with JELP was conducted by Goyal (Citation2021, (Citation1976)). He demonstrated economic advantage of joint lot-sizing in a supply chain system involving single vendor and single buyer under deterministic demand. The vendor manufactures a batch of product with infinite production rate and transports it to the buyer under lot for lot policy. Later, Banerjee ((Citation1986)) extended Goyal’s model by relaxing the assumption of infinite production rate. He showed that integrated policy provides a significant benefit to the vendor, in term of reduced total cost. Since the buyers is always in disadvantage position, the discount policy is proposed to share the benefit with the buyer when he agrees to adopt integrated policy rather than independent policy. Then, the model developed by Goyal ((Citation1976) is followed by many scholars, including Beck et al. (Citation2017), Rad et al. (Citation2018), Ben-Daya et al. (Citation2019), and Dwicahyani (Citation1986)et al. (Citation2020), Dey et al. (Citation2021), and Ben-Daya and Hariga (Citation2004) introduced a stochastic demand in a two-stage inventory model under lot size-dependent lead time. Hsiao (Citation2008) proposed two types of reorder point and lead time to cope with a normal distribution demand. The first lead time is formulated by taking into account the production and delivery time, while the next lead time is formulated by taking into account the delivery time. Later, Glock (Citation2012) proposed an efficient mechanism to reduce the lead time. The setup time and transportation time can be shortened by an extra cost which leads to the reduction in total cost incurred by the system. Mou et al. (Citation2017) extended the model of Glock (Citation2012) by allowing the transportation time as decision variable. Hossain et al. (Citation2017) presented a JELP model in which the late shipments are charged with penalty cost. Islam et al. (Citation2017) investigated the impact of consignment policy on inventory decisions and supply chain performance. Furthermore, Heydari et al. (Citation2018) studied a JELP model under various transportation modes and stochastic demand.
2.2. Supply chain inventory models with carbon emissions
The growing interest in global warming has pushed researchers to consider carbon emissions in making decisions in the supply chain. Ramandi and Bafruei (Citation2020) proposed a supplier-retailer inventory model considering stochastic demand and government’s regulations to lessen the emissions. The government controls the emissions from a supply chain by implementing a subsidy and penalty mechanism. A revenue sharing contract and delay in payments contract are utilized to improve the coordination of supply chain parties. Barman et al. (Citation2021) considered deteriorating items and variable production cost in two-stage inventory model. The carbon cost is charged for each emission resulted from production and transportation activities. Pan et al. (Citation2021) incorporated price and advertisement dependent demand and carbon emissions reduction on the supply chain system made of a manufacturer and a retailer. The objective of the model is to obtain the optimal pricing, advertising and inventory decisions that maximizes joint total profit. Gautam et al. (Citation2021) studied a product recovery management in a cleaner supply chain involved of a vendor and a buyer under imperfect production. They explored the impact of carbon emissions resulting from production, shipment and disposal activity, energy usage and shortages on inventory decisions. Sepehri (Citation2021) proposed a permissible delay payment to improve the sales and carbon tax regulation to mitigate the influence of emissions on supplier-retailer-customer inventory model. The model aims to obtain the optimal selling price and replenishment decision taking into consideration some factors, i.e the expiration of items, prepayment mechanism. Karthick and Uthayakumar (Citation2021) analysed the total cost of supply chain system under deterministic and fuzzy environments. They focused on proposing a mechanism to control the emissions released from manufacturing. Yadav et al. (Citation2021) considered carbon emissions produced from holding items, transportation, waste management and setup activity in a supply chain involved two manufacturers and single-retailer under cross-price elasticity of demand. They obtain the optimal values of the number of shipments, batch size, production rate and preservation technology investment such that the total profit of the supply chain is maximized.
Some scholars have investigated the impact of various carbon policies on supply chain inventory decisions. In lessening the carbon emissions, some regulations such as carbon tax, carbon cap and carbon cap-and-trade, has been extensively adopted by some scholars. Pan et al. (Citation2020) incorporated two carbon regulations, namely carbon tax and carbon-cap-and-trade policies in the production-inventory model. They also demonstrated how the agreement to share the green investment among parties can benefit the supply chain. Ghosh (Citation2021)Citation1995 compared the performance of carbon tax policy and carbon cap-and-trade policy in a two-echelon system under random demand. They discussed the benefit of adopting both policies and also proposed other mechanism to control the emission, namely hybrid policy. Rout et al. (Citation2021) adopted some carbon regulations to cut down the emissions from production, storage, rework, shipment and waste disposal in the supply chain inventory model made of a vendor and multiple-buyers. In addition to determining optimal production-inventory decisions, the model also seeks to determine routing plan for vehicles. Halat et al. (Citationin press) developed a Stackelberg game of a supply chain system and regulator under carbon reduction. Three carbon policies, namely carbon cap, carbon tax and carbon cap-and-trade, are imposed by the regulator as mechanism to maximize social welfare. Cadavid-Giraldo et al. (Citation2020) studied the influence of carbon prices on supply chain decisions in the cement sector. Turken et al. (Citation2021) investigated the influences of carbon cap and carbon cap-and-trade policies on inventory decisions under the traditional and vendor managed inventory scenarios. Feng et al. (Citation2022) proposed a carbon cap and trading mechanism to limit the emissions from multi-supplier multi-period inventory system under uncertain market demand. Some scholars, including Kundu and Chakrabarti (Citation2018) and Jauhari et al. (Citation2020) implemented carbon policies to lessen the emissions from reverse logistics operations. Kundu and Chakrabarti (Citation2018) examined the impact of various carbon regulations on manufacturing-remanufacturing decisions under a price-dependent return rate. Jauhari et al. (Citation2020) demonstrated how carbon emissions from manufacturing and remanufacturing operations can be minimized using a carbon cap-and-trade policy. Cheng et al. (Citation2022) considered a carbon cap and trade mechanism to cut down emissions from a closed-loop supply chain system with two manufacturer’s categories, namely low-emission manufacturer and high-emission manufacturer. Later, Luo et al. (Citation2022) evaluated the impacts of carbon tax and investment in carbon reduction technology on manufacturing and remanufacturing decisions under three collection strategies.
2.3. Supply chain inventory models with periodic review policy
In this sub-section, we focus on reviewing some papers in JELP dealing with a periodic review policy. Some authors used periodic review supply chain inventory model by considering some aspects, such as price-dependent demand, credit policy, lead time reduction, vendor-managed inventory, backordering and discount policy. Sakulsom and Tharmmaphornphilas (Citation2019) employed a periodic-review base-stock policy to determine inventory decisions in a two-echelon system facing a seasonal demand. A service level constraint is also adopted in the model and a heuristic method is used to reduce the computational time to obtain the solution. Nematollahi et al. (Citation2018) examined multi-objective coordination of pharmaceutical supply chain involving of pharma-distributor and pharma-retailer under two decision-making scenarios. Visit interval and safety stock level are considered in the trade-offs between service level and total profit. Johari et al. (Citation2018) considered bi-level credit period and price-dependent demand. They showed that by coordinating the inventory and pricing decisions and credit policy, the supply chain profit and member’s profit can be improved significantly. Taleizadeh et al. (Citation2020a) adopted a vendor-managed inventory policy to manage the inventories in the supply chain made of single-vendor and single buyer under continuous review and periodic review policies. To formulate the mathematical inventory model, some factors including limited capacity and partial backordering are also considered. Taleizadeh et al. (Citation2020b) also investigated the supply chain coordination of single supplier-two buyers under backordering and lot sales policies.
Furthermore, Huang and Song (Citation2020) investigated the impact of lead time reduction on inventory decisions in a single-buyer multiple-buyers system under service-level constraint. The objective is to minimize total cost by obtaining the optimal values of delivery time, lead time, frequencies of deliveries and replenishment levels. Jazinaninejad et al. (Citation2019) determined inventory decisions of manufacturer-buyer system under credit option mechanism and price-sensitive demand. An economic production quantity (EPQ) and a periodic review policy are adopted to manage inventory in the manufacturer and the buyer, respectively. Castellano et al. (Citation2021) studied the influence of partial backorder and controllable lead time on inventory decisions. The model is solved using a minimax distribution-free approach and two heuristics are employed to determine decision variables, which are lead time, buyer’s replenishment policy, vendor’s production policy and vendor’s inventory cycle. Nouri et al. (Citation2021) developed a coordination mechanism for supplier-retailer system with promotional efforts and periodic review policy. An incentive based on discount factor is also proposed to encourage the supply chain members to follow the coordination mechanism.
2.4. Research contributions
The above literature shows that JELP has been developed by considering various aspects. However, no study has incorporated green technology investment, green incentive and energy usage in stochastic JELP. Most of the studies on the stochastic JELP have addressed carbon emissions reduction and used various policies to cut down the emissions from operations. Carbon policies, such as carbon tax, carbon penalty, carbon cap-and-trade and strict carbon cap, have been adopted to lessen the emissions. However, the influence of green technology investment on the inventory decisions is still rarely discussed in the literature. Several leading industries have used green technology to reduce emissions. For example, Marks and Spencer, Walmart, H&M, Home Depot and Panasonic Group have achieved significant emission reductions by leveraging various green technologies available in the market. Although carbon policies have been incorporated in the JELP, the effect of incentives on emission reduction efforts has not been widely discussed in previous studies. Carbon incentive policies by regulators can encourage carbon emitters to make more serious efforts to reduce emissions. Furthermore, although various issues related to environmental impact have been discussed in the JELP model, there are still few researchers who have investigated energy needs. In reality, the production facilities require enormous amounts of energy to manufacture products. Therefore, energy costs need to be considered in the model because they have a large contribution to the total production costs borne by the company.
Compared with the existing studies, the contributions of our study are as follows:
To cope with carbon tax regulations issued by the government, the vendor adopts green technologies to minimize the emissions from storage and production activities. By using this type of technology, the level of emissions produced by production facilities can be reduced so that it is more environmentally friendly. Although Dwicahyani et al. (Citation2017), Ramandi and Bafruei (Citation2020), Barman et al. (Citation2021), and Sepehri (Citation2021), and Karthick and Uthayakumar (Citation2021) addressed the emissions from supply chain’s operations, this kind of investment has not been considered in the model.
Previous studies, including Kundu and Chakrabarti (Citation2018), Jauhari et al. (Citation2018), Turken et al. (Citation2021), and Feng et al. (Citation2022), neglected the energy effects on inventory decisions. In this paper, the energy consumed during the production process is considered and linked with the production rate. Interestingly, the green technology investment made by the vendor is also associated with the reduction of energy consumption. So, in addition to having an impact on reducing emissions, the investment will also have an impact on energy consumption.
To encourage the vendor to reduce the emissions produced, the government provides green incentives. In our model, the incentives are calculated based on the emission reduction target. The amount of incentives received by the vendor will be related to the investment made. Our model attempts to consider several important aspects of carbon reduction, namely green investment, incentives, and energy usage, whereby integrating them into supply chain inventory decision-making.
In most of the earlier JELP literature, scholars have treated the annual demand as a fixed constant. Here, the annual demand is assumed to be fuzzy and the buyer’s inventory level is managed using a periodic review policy. In contrast to most papers that use a constant lead time (e.g Huang & song, Citation2020; Jazinaninejad et al., Citation2019; Johari et al., Citation2018; Nouri et al., Citation2021) our model considers a variable lead time where it is influenced by production time and delivery time.
To promote the goal of sustainable economic development, this research contributes to the emerging economy concept of supply chain system, particularly with regard to system coordination, emissions reduction and energy consumption. Coordinated inventory management policy built on the proposed model is able to minimize the total costs incurred and at the same time increase the competitiveness of the supply chain in the global market. For its implementation, it can encourage higher green economic growth compared to the “business as usual” scenario.
3. Problem definition, notation and assumptions
3.1. Problem definition
The investigated system is a supply chain consisting of a vendor and a buyer. The vendor is the party that produces the product and makes delivery to the buyer. Production runs for a certain period and stops when the whole batch is finished. The delivery is carried out as soon as a batch of shipments is completed. The buyer is the party responsible for selling the product to the final customer. The buyer is faced with uncertainty, where product demand follows a normal distribution with a fuzzy average demand. To deal with the demand uncertainty, the buyer applies a periodic review policy to manage inventory in the warehouse.
Carbon emissions resulting from activities carried out by the parties are considered and reduced by a carbon tax policy. Vendor activities that generate carbon are production and storage activities, while buyer activities that generate emissions are transportation and shipping activities. In addition to generating emissions, production activity at the vendor also requires energy, the amount of which depends on the level of production. Facing tax pressures from regulators and the need to conserve energy, the vendor will strive to reduce emissions and control the energy consumption. For this purpose, the vendor makes a green investment to cut down the emissions resulting from production and storage activities. Since regulators also have the same interest in reducing emissions, they provide green incentives that are given based on emission reduction targets. The incentive scheme will encourage the vendor to work harder to reduce the emissions produced.
3.2. Notation
To develop the proposed mathematical model, we use the following notation.
Parameters for buyer:
D demand rate (units/h)
σ standard deviation of demand (units/h)
A ordering cost ($/order)
k safety factor
hb holding cost for buyer ($/unit/h)
backordering cost ($/unit)
Tstransportation time (h)
W carbon emissions generated from keeping the products in the storage (kg CO2/unit/h)
E carbon tax ($/kg CO2)
transportation cost ($/truck)
truck capacity (unit/truck)
number of gallons per truck per distance travelled (gallon/truck)
amount of carbon emissions from one gallon of diesel-truck fuel (ton/gallon)
Parameters for vendor:
energy cost ($/kWh)
θ maximum fraction of emission reduction, 0 θ < 1
target for emission reduction
m parameter for green investment, m 0
fraction of energy reduction
green incentives ($)
power consumed by the manufacturing facility in idle condition (kW)
constant for the power used by the manufacturing facility (kWh/unit)
S setup cost for the manufacturing facility ($/setup)
hv holding cost for the vendor ($/unit/h)
aremission parameter for the manufacturing facility (kg h2/unit3)
br emission parameter for the manufacturing facility (kg h/unit2)
cr emission parameter for the manufacturing facility (kg/unit)
Decision variables:
T review period
k safety factor
n number of deliveries
R green investment
3.3. Assumptions
The assumptions used to develop the mathematical model are described as follows
The investigated system consists of a vendor who manufactures products and a buyer who sells products to end customers.
The demand at the buyer side is normally distributed with mean D and standard deviation σ.
The annual demand is treated as fuzzy.
The buyer manages the inventory level by adopting a periodic review policy.
The buyer’s inventory level will be reviewed in the period of T, where T is longer than the lead time. Thus, there is never more than a single order outstanding in any cycle.
The buyer orders DT units and the vendor will manufacture nDT units for each production run with a finite production rate P, where P > D. Then, the lot of DT units will be delivered from the vendor to the buyer equally over time.
The vendor has a chance to invest money in green investment to reduce the emissions produced regularly from the facility.
To encourage the vendor to lessen the emissions from the operations, green incentives based on the emission reduction target are given by the regulator.
4. Model formulation
4.1. Buyer’s total cost formulation
As described in the above section that the annual demand is fuzzy in nature. The lead time is variable and is formulated by considering productive time and transportation time, that is . The backorder cost per year incurred by the buyer is derived by the following equation
where,
and
represent the probability density function and the cumulative density function of standard normal distribution, respectively. By adopting the Hadley‒Within (1976) formula, the inventory level for buyer operating under periodic review policy can be calculated by
The holding cost is given by the following equation
Since A is the ordering cost per order, the buyer ordering cost per year is formulated by . Furthermore, the transportation cost per year can be calculated by considering transportation cost per truck,
, and truck capacity,
, that is
. In the buyer system, the emissions are released from transportation and storing products in the warehouse. The emissions cost regarding the transportation activity is
The emissions cost generated from storage depend upon the inventory level, that is
The total cost for the buyer is formulated by the following expression
4.2. Vendor’s total cost formulation
The setup cost per year for the manufacturing system is formulated by . The average inventory level of the manufacturing system can be determined by reducing the vendor’s accumulated production by accumulative shipments. EquationEquations (8)
(8)
(8) presents the holding cost incurred by the vendor.
To cope with the tax regulation, the vendor intends to reduce the emissions from his operations by adopting green investment. The fraction of the emissions reduction achieved when R is invested on green technology can be formulated by EquationEquation (9(9)
(9) ; See, Lou et al., Citation2015);
The vendor focuses its investment on improving the performance of the manufacturing facility so that the resulting emission can be reduced. Since the emissions resulted from storage depends on the inventory level, the amount of emissions generated from the manufacturing system is given by EquationEquations (10)(10)
(10) .
The amount of emissions generated from the production process is influenced by the production rate (Bogaschewsky, Citation1995) and is given by EquationEquation (11)(11)
(11) .(Citation2006)
The production process requires electrical energy. According to Gutowski et al. ((Citation2006)), the energy consumption at the production process depends on the production speed. It is reasonable to assume that the reduction of energy consumption is proportional to the reduction of the emissions. Let be a scaling factor for the reduction in energy consumption. EquationEquation (12)
(12)
(12) presents the electrical energy cost incurred by the manufacturing system.
To encourage the vendor to be more serious in reducing the emissions, the regulator offers green incentives. The incentives are calculated based on the achievement of emission reductions and the emission reduction target. The incentives given by the regulator are formulated as follows
Therefore, the total cost for the vendor is given by the following equation
4.3. Joint total cost formulation
Let us consider that the annual demand is located in an interval , where z1 and z2 are determined by the decision-makers. Based on the interval, we fuzzify D to be a triangular fuzzy number,
, where
and
. If D is fuzzified to be
, the total cost function is also a fuzzy value, that is
We employ a signed distance method to defuzzify . The signed distance of
is determined by the following expression
The signed distance from to
is given by
The joint total cost can be rewritten as follows
where,
5. Solution methodology
The objective of our model is to minimize the total cost by determining the values of n, T, k and R. First, for fixed n, we take the first partial derivative of JTC with respect to T, k and R, respectively, and the results are as follows
We set equations (22)-(24) equal to zero and then we have the following expressions
We formulate an efficient algorithm to solve the proposed problem. The proposed algorithm is described as follows
Table
6. Numerical example
To illustrate the application of the proposed model, let us consider the following data: D = 500, σ = 20, z1 = 50, z2 = 25, A = 200, Ctr = 400, =100,
=375,
=0.25, Ts = 0.0005, π = 50, P = 1200, hb = 2.5, hv = 1.5, K = 800, ar = 0.00012, br = 0.0008, cr = 8.4, Wv0 = 1,000,000, kv = 1000, Cen = 0.015, W = 10, E = 0.0618, m = 0.005, θ = 0.8, INf = 2000,
=0.65,
=0.3. The data values are mainly adapted from Ben-Daya and Hariga (Citation2004), Jauhari (Citation2012), and Saga et al. (Citation2019). Fuel consumption for truck, emissions from production and carbon tax are taken from Truck (Citation2018), Jauhari et al. (Citation2022) and Chan (Citation2009), respectively. By employing the above procedure, we obtain the following results. The optimal review period, number of shipments, safety factor, lead time, and service level are 0.564; 3; 1.780; 58.88 days; and 96.25%, respectively. The vendor must invest $683.19 in green technology and he will receive incentives $947.45. The cost incurred by the vendor, buyer and supply chain are $8,733.66, $2,960.12 and $11,693.77, respectively.
7. Sensitivity analysis
In this section, we perform a sensitivity analysis to study the influence of the changes in the incentives, maximum emission reduction, energy proportion, carbon tax, production rate and demand, on the decision variables and costs. The analysis of the results is given in the following sub-sections.
7.1. Analysis of green incentives
The green incentive has been proven to be an effective policy to cut down the emissions. With this policy, manufacturers will strive to reduce the rate of emissions produced so that they have opportunity to get more money from the government. Table shows the influence of the changes in green incentives on the model’s behaviour. Clearly, the increase in the incentive gives significant impact on the green investment and costs. The results from the table show that if the incentives provided by the government becomes larger, the total amount of incentives earned by the vendor increases significantly. In addition, the incentives also have a positive impact on energy consumption. It shows that if the incentives given are getting bigger, the energy needed will be smaller. Facing a higher incentive, the vendor will strive to reduce the amount of emissions produced by increasing the amount of money invested in green investments. The more money invested, the greater the emissions that can be reduced. Therefore, this policy has a positive impact on sustainability performance as indicated by a large reduction in emissions resulted (see, Figure ). If the government increases the incentives from $2000 to $5200 (160%), the emissions resulted from the supply chain are reduced by 3.1%. Furthermore, the increase in the incentive gives positive impact on the cost performance. Increasing the incentive by 160% will lead to the reduction on the vendor cost and total cost by 18.3% and 13.66%, respectively. However, the buyer cost remains unchanged due to the change in the incentives.
Figure 3. The impact of the changes in incentives on emissions and incentives.
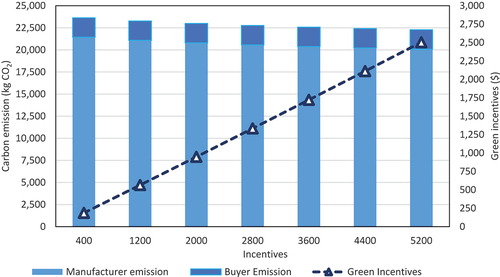
Table 1. The impact of incentives on the proposed model
7.2. Analysis of maximum emission reduction (θ)
We further investigate the impact of θ on the model’s solution. The results of the investigation are presented in Table . It shows that if θ increases, the review period increases as well. With the higher review period, the system tends to increase the shipment lot. We observe that the increase in θ gives a positive impact on the reduction of the emissions resulted. Higher θ means that the system has more opportunities to reduce the emissions. Figure presents how the higher θ encourages the system to cut down the emissions by using the green technology investment. Clearly, if θ increases from 0.48 to 0.96 (100%), the total emission sharply decreases by 84.13% while the percentage of the emission reduction increases by 105.8%. Consequently, the green technology investment rises from $580.94 to $719.60 due to the increased θ. As the system can maintain the emissions appropriately, the incentives received will rise drastically. We observe that if θ increases from 0.48 to 0.96, the total incentives rise by 312.28%. The energy consumed by the production process is also significantly influenced by the θ. It is observed that if θ increases from 0.48 to 0.96 (100%), the electrical energy used by the production process is reduced by 44.25% and the percentage of the energy reduction increases by 105.8% (see Figure ). This leads to the reduction in the vendor cost and joint total cost of 55.57% and 45.76%.
Figure 4. The impact of the changes in θ on the emissions and percentage of emission reduction.
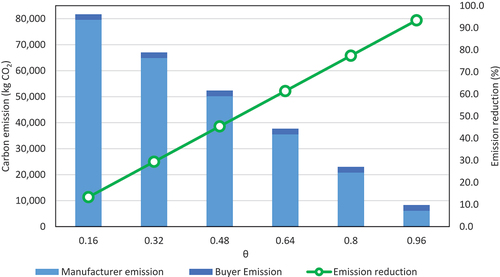
Figure 5. The impact of the changes in θ on the energy consumption and percentage of energy reduction.
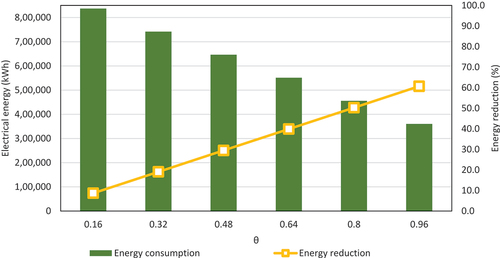
Table 2. The impact of θ on the proposed model
7.3. Analysis of fraction of the energy reduction (μ)
The influence of μ on the model’s behaviour is shown in Table . It is observed that the changes in μ significantly affect the system costs. However, the decision variables, investment and incentives keep unchanged due to the increase in μ. If μ increases from 0.26 to 0.91 (250%), the vendor cost and joint total cost decreases by 53.21% and 43.24%, respectively, while the buyer cost is relatively unchanged. The significant decrease in energy consumed by the production process causes the reduction in the vendor cost. The results in Figure show that if μ goes up by 250%, the total energy required by the production process goes down by 62.95%. This is understandable, since the higher μ means that the green investment made by the vendor will give a greater impact on the reduction of the energy consumption. We further observe that if μ increases from 0.26 to 0.91, the percentage of energy reduction increases from 20.12% to 70.41%.
Figure 6. The impact of the changes in μ on the energy consumption and percentage of the energy reduction.
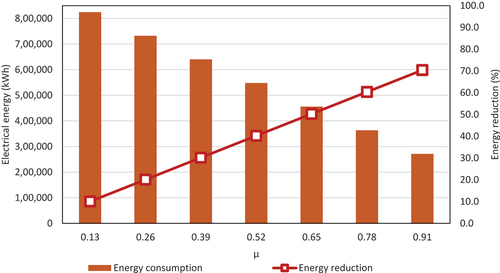
Table 3. The impact of μ on the proposed model
7.4. Analysis of carbon tax
The faster increase in the rate of carbon emissions will encourage the government to tighten carbon policies. Table shows how the changes in carbon tax give significant impact on the solution. If carbon tax increases gradually, the review period and safety factor go down which leads to the decrease in the inventory level kept in the storage facility. This makes sense, since reducing the number of products stored in the warehouse will reduce the emissions from the storage. Furthermore, an increased carbon tax forces vendor to increase green technology investment to lessen the emissions. We observe that if carbon tax increases from $0.0618/kg CO2 to $0.16068/kg CO2 (160%), the total emissions generated and total energy required by the production decrease by 6.54% and 1.85%, respectively (see Figure ). Moreover, the green investment and incentives rise by 22.76% and 2.99%, respectively. The results suggest the manager to not only lessen the emissions, but also reduce the electrical energy consumption. Despite efforts to increase investment, the system will continue to experience a significant increase in costs. It is observed that if carbon tax increases by 160%, the buyer cost, vendor cost and joint total cost go up by 6.88%, 20.73% and 17.22%, respectively.
Figure 7. The impact of the changes in carbon tax on the carbon emissions and energy consumption.
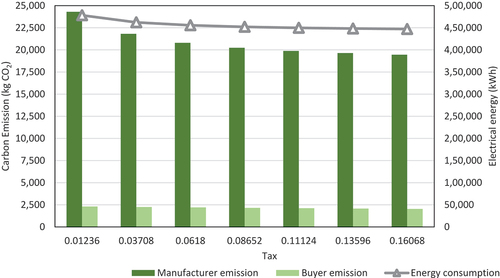
Table 4. The impact of carbon tax on the proposed model
7.5. Analysis of production rate
The variation of production rate affects significantly the model’s solution. The results from Table indicate that when the production rate goes up, the number of deliveries and safety factor goes down while the review period goes up. When the production rate is getting higher, it is beneficial for the system to increase the shipment lot, thus increasing the inventory level. The changes in production rate significantly influences the emissions generated from the production process. If the production rate increases from 1680 units/year to 3600 units/year, the emissions generated rises by 303.46% and the energy consumption goes down by 21.15% (see Figure ). Furthermore, the higher the production rate, the more emissions generated from the production process. As a result, the money invested in green production technology should be increased to maintain the emissions. Increasing the production rate by 303.46% leads to the increasing of the green technology investment by 34.91%. However, increased investment will result in the establishment of a cleaner system followed by greater incentives obtained.
Figure 8. The impact of the changes in production rate on the carbon emissions and energy consumption.
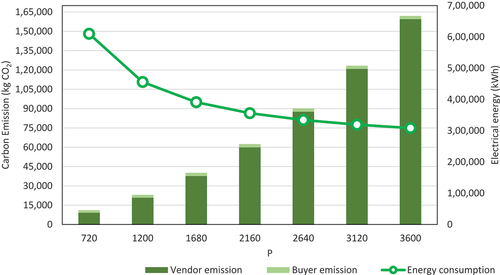
Table 5. The impact of production on the proposed model
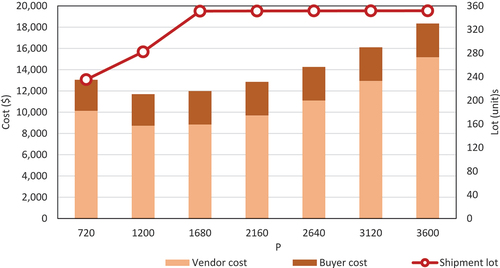
Figure presents the influence of the production rate on the vendor cost, buyer cost and shipment lot. We observe that if the production rate is adjusted from 720 units/year to 3600 units/year, the joint total cost goes down and reaches the minimum point at P = 1200 units/year, and after that the cost will increase gradually until it reaches its peak at P = 3600 units/year. This trend seems to apply the same to the vendor cost. The increase in production rate will also have an impact on the shipment lot. If production rate increases from 720 units/year to 1680 units/year, the shipment lot increases from 235.17 units to 351.14 units and the lot remains relatively unchanged until P = 3600 units/year. This indicates that the vendor must make lot adjustments when there is a change in production levels. The increase in production levels must be balanced with an increase in the quantity of shipments so that the number of items stored can be maintained properly.
Figure 9. The impact of the changes in production rate on the system costs and shipment lot.
7.6. Analysis of fuzzy demand
In this sub-section, we focus on studying the impact of fuzzy demand on the model performances. Table and Table show how z1 and z2 influence the model’s behaviour. We may see that if z1 increases, the joint total cost, buyer cost and vendor cost decrease. We observe that if z1 increases from 25 to 55 (120%), the joint total cost, buyer cost and vendor cost decrease by 1.38%, 1.43% and 1.23%, respectively. We obtain different effects, when investigating the influence of z2 on costs (see Table ). If z2 increases gradually, the joint total cost, buyer cost and vendor cost increase as well. For example, when z2 is increased from 10 to 40 (300%), the joint total cost, buyer cost and vendor cost are increased by 1.41%, 1.25% and 1.46%, respectively. These results show that, when z2-z1 is getting higher, the demand becomes larger which leads to the increase in the system costs.
Table 6. The impact of z1 on the model
Table 7. The impact of z2 on the model
8. Managerial insights
The proposed model is very useful to help decision makers to manage inventory in the supply chain. In particular, the supply chain has a focus on efforts to reduce carbon emissions from its operations and to save energy. The proposed model is able to provide direction for decision makers to determine the actions to be taken to deal with carbon tax policies imposed by regulators and incentive policies to help industries reduce emission levels. The tax imposed is able to reduce the amount of emissions generated from transportation, storage and production activities, and encourage vendor to lessen energy consumption, thereby improving supply chain performance. Our findings reveal that the green incentive scheme offered by the regulators can effectively induce more green production and reduce the resulting emissions. Incentive policies based on emission reduction targets have proven to be able to encourage vendors to take more serious actions to reduce emissions. The vendor will be forced to spend more money to optimize green investment. According to Li et al. (Citation2021), this type of incentive is suitable to be applied to developing industries to encourage their development. Meanwhile, other types of incentives, such as fixed green technology subsidy, are more suitable to be applied to developed industries. Furthermore, according to the results, the government can adjust the requirements for incentives to promote green technology investment or cut down emission, such as carbon reduction target.
The results obtained can be a reference for managers to determine the amount of money that must be invested in green investments. In general, the results obtained show that the more money spent on investment, the greater the emission reduction. The results are in line with Huang et al. (Citation2020)’work who adopted green investment to control the emissions in the supply chain. They said that industries facing pressure from the carbon tax policy will prefer to invest in a relatively efficient green technology production. Furthermore, our findings show that the implementation of increasingly stringent carbon taxes will encourage the industries to invest more in green technology production. Ghosh et al. (Citation2020) proved that the implementation of other carbon policies and tightening policies will also encourage increased investment. In implementing green investment, managers must be able to choose the right type of green technology to be adopted. Of course, this will not be easy because there are many technology options available in the market with varying prices and emission levels. Several important factors that need to be considered in selecting the technology include the availability of the budget, the suitability of the technology with the existing production process, the suitability of the technology with the operator’s capabilities and the amount of operating cost required.
The relationship between green investment and energy consumption is an important point to note. The relationship between the two in the model is reflected by the value of μ. In real conditions, the relationship may be more complex depending on the type of green technology adopted, the type of fuel consumed and other factors. However, the proposed model provides flexibility to decision makers to determine the value of μ according to real conditions in the production system. The investment made by the vendor will have a positive impact on efforts to reduce energy consumption. The results prove that the more money invested the less energy is required to run production. The increase in investment will be marked by the increasing number of green technologies adopted into the production system. This means that many old machines will be replaced with more environmentally friendly machines. The new machines will require less energy resulting in significantly lower emissions. The results are different with the results obtained by Hasan et al. (Citation2021) who adopted green investment to minimize the emissions from a single-stage system. Here, we show that in addition to being able to reduce emissions, this policy has also proven to be able to manage energy use in the vendor’s manufacturing system.
9. Conclusions
In today’s situation of increasing carbon emissions and energy consumption, green regulations play an important role to save our earth. If regulations such as carbon taxes, green investment and incentives are implemented, they can provide many benefits to the supply chain. This is because some operations in the supply chain such as production, storage and transportation are both carbon emitters and energy consumers. Inventory control is a key activity in the supply chain that affects these operations. Therefore, inventory management policies in the supply chain are one of the key determinants that affect the reduction of carbon emissions and energy consumption. This paper has developed an inventory model for a supply chain system consisting of a vendor and a buyer under the periodic review policy. The aim of the research is to examine the impact of the green technology investment, green incentive and energy consumption on economic and environmental performances of the supply chain. The model seeks to obtain the optimal values of the decision variables, namely the review period, safety factor, number of shipments and green investment, such that the joint total cost is minimised. An efficient algorithm is generated to find the solutions and a numerical example is provided to show the benefit of the model. In addition, a sensitivity analysis is performed to investigate the impact of the changes of key parameters on the model’s solutions. The proposed model contributes to the current inventory literature by allowing the investigation of the carbon emission and electrical energy consumption in a two-stage supply chain system under fuzzy demand and periodic review policy. A green technology investment is proposed to cut down the emissions generation and the energy required by the manufacturing facility. Unlike Lou et al. (Citation2015) and Hasan et al. (Citation2021) that used a green technology investment to merely reduce the emissions, our model also considers the relationship between the reduction in energy consumption and the investment. Previous works, including Sepehri (Citation2021), Gautam et al. (Citation2021), and Pan et al. (Citation2021) mostly adopted various carbon policies to control emissions from supply chains and ignored the role of carbon incentive policies in reducing the emissions. In our paper, the carbon tax policy is implemented together with the incentive policy so that the emission reduction obtained can be maximized.
The proposed model is applicable since it considers economical and sustainability factors such as emissions, energy consumptions, investment and incentives that are commonly found in the real system. The proposed model offers a decision-making aid for inventory managers who are required to control emissions and supply chain costs by using green investment, green incentives and optimal review period. The model can help managers to decide on the optimal review period, number of deliveries and amount of investment so as to perform more efficient and environmentally friendly inventory management practices. Some interesting results are obtained from this research. First, the incentives provided can encourage the manufacturer to increase the emission reduction efforts through green technology investment. As a result, the amount of emission and the total cost borne by the supply chain can be minimized. This shows that the incentive policies for emission reductions that are given based on the agreed targets have a positive impact on economic and environmental performance. Secondly, if the maximum fraction of emission reduction increases, it would be beneficial for the manager to invest more in green technologies. An increase in the fraction gives managers a greater opportunity to reduce emission rates as much as possible through green technology investment so as to create a much cleaner system. In the green technology investment context, the selection of the right green technology to be adopted into the system becomes important to note. Managers need to choose technology that fits their needs and budget availability. Third, carbon tax policies play an important role in efforts to reduce emissions and energy consumption. This policy also has a very large impact on inventory policies at the supply chain level. In conditions where taxes are getting tighter, the managers need to adopt more green technologies to reduce the rate of emissions produced. An increase in carbon taxes also has a positive impact on energy consumption. This suggests that increasing the carbon tax will encourage vendors to save more energy. Fourth, the variation on the production rate significantly influences the model’s behavior. It suggests the manager to invest more in green technologies when the production rate increases, including the emissions and energy usage. If the production speed is increased, the production process will tend to produce more emissions so that a larger investment is needed to reduce them. In addition, the electrical power consumed by the production process is reduced which lead to the reduction in total energy consumption.
The proposed model can be extended into various research directions. First, in our model, the production process is perfect. However, in real conditions, the production process can shift from in control state to out control state and results in potential defects. The model can be extended by considering imperfect production and propose ways to handle the defects resulting from the system. Second, other carbon policies, such as carbon cap, carbon cap-and-trade and carbon offset, can be incorporated into the model. Thus, future studies may examine how different carbon policies that are implemented in the system could impact inventory decisions and system performance. Third, research related to improving coordination between members in the supply chain and its integration with inventory policies will also be an interesting way forward.
Disclosure statement
No potential conflict of interest was reported by the author(s).
Additional information
Funding
References
- Alegoz, M., Kaya, O., & Bayindir, P. (2021). A comparison of pure manufacturing and hybrid manufacturing–remanufacturing systems under carbon tax policy. European Journal of Operational Research, 294(1), 161–26. https://doi.org/10.1016/j.ejor.2021.01.018
- Bai, Q., Xua, J., & Chauhan, S. C. (2020). Effects of sustainability investment and risk aversion on a two-stage supply chain coordination under a carbon tax policy. Computers & Industrial Engineering, 142, 106324. https://doi.org/10.1016/j.cie.2020.106324
- Banerjee, A. (1986). A joint economic-lot-size model for purchaser and vendor. Decision Sciences, 17(3), 292–311. https://doi.org/10.1111/j.1540-5915.1986.tb00228.x
- Barman, D., Mahata, G. C., & Das, B. (2021). Advance payment based vendor–buyer production inventory model with stochastic lead time and continuous review policy. OPSEARCH, 58(4), 1217–1237. https://doi.org/10.1007/s12597-021-00521-9
- Beck, F. G., Glock, C. H., & Kim, T. (2017). Coordination of a production network with a single buyer and multiple vendors with geometrically increasing batch shipments. International Journal of Production Economics, 193, 633–646. https://doi.org/10.1016/j.ijpe.2017.07.015
- Ben-Daya, M., As’ad, R., & Nabi, K. A. (2019). A single-vendor multi-buyer production remanufacturing inventory system under a centralized consignment arrangement. Computers and Industrial Engineering, 135, 10–27. https://doi.org/10.1016/j.cie.2019.05.032
- Ben-Daya, M., & Hariga, M. (2004). Integrated single vendor single buyer model with stochastic demand and variable lead time. International Journal of Production Economics, 92(1), 75–80. https://doi.org/10.1016/j.ijpe.2003.09.012
- Bogaschewsky, R. (1995).Natürliche Umwelt und Produktion . Gabler-Verlag, Wiesbaden.
- Cadavid-Giraldo, N., Velez-Gallego, M. C., & Restrepo-Boland, A. (2020). Carbon emissions reduction and financial effects of a cap and tax system on an operating supply chain in the cement sector. Journal of Cleaner Production, 275, 122583. https://doi.org/10.1016/j.jclepro.2020.122583
- Castellano, D., Gallo, M., & Santillo, L. C. (2021). A periodic review policy for a coordinated single vendor-multiple buyers supply chain with controllable lead time and distribution-free approach. 4OR, 19(3), 347–388. https://doi.org/10.1007/s10288-020-00448-9
- Chan, Y., (2009) Taiwan plans taxes for energy and CO2 emissions by 2011. https://www.businessgreen.com/bg/news/1800579/taiwan-plans-taxesenergy-co2-emissions-2011
- Cheng, P., Ji, G., Zhang, G., & Shi, Y. (2022). A closed-loop supply chain network considering consumer’s low carbon preference and carbon tax under the cap-and-trade regulation. Sustainable Production and Consumption, 29, 614–635. https://doi.org/10.1016/j.spc.2021.11.006
- Dey, B. K., Bhuniya, S., & Sarkar, B. (2021). Involvement of controllable lead time and variable demand for a smart manufacturing system under a supply chain management. Expert Systems with Applications, 184, 115464. https://doi.org/10.1016/j.eswa.2021.115464
- Dwicahyani, A. R., Jauhari, W. A., Rosyidi, C. N., Laksono, P. W., & Srivastava, H. M. (2017). Inventory decisions in a two-echelon system with remanufacturing, carbon emission, and energy effects. Cogent Engineering, 4(1), 1379628. https://doi.org/10.1080/23311916.2017.1379628
- Dwicahyani, A. R., Kholisoh, E., Rosyidi, C. N., Laksono, P. W., & Jauhari, W. A. (2020). Inventory model optimisation for a closed-loop retailer-manufacturer-supplier system with imperfect production, reworks and quality dependent return rate. International Journal of Services and Operations Management, 35(4), 504–527. https://doi.org/10.1504/IJSOM.2020.105913
- Feng, Y., Liu, Y., & Chen, Y. (2022). A robust multi-supplier multi-period inventory model with uncertain market demand and carbon emission constraint. Computers and Industrial Engineering, 165, 107937. https://doi.org/10.1016/j.cie.2022.107937
- Gautam, P., Khanna, A., & Jaggi, C. K. (2021). An integrated green supply chain model with product recovery management towards a cleaner system. Journal of Cleaner Production, 320, 128850. https://doi.org/10.1016/j.jclepro.2021.128850
- Ghosh A. (2021). Optimisation of a production-inventory model under two different carbon policies and proposal of a hybrid carbon policy under random demand. International Journal of Sustainable Engineering, 14(3). 280–292. https://doi.org/10.1080/19397038.2020.1800858
- Ghosh, A., Sarmah, S. P., & Kanauzia, R. K. (2020). The effect of investment in green technology in a two echelon supply chain under strict carbon-cap policy. Benchmarking, 27(6), 1875–1891. https://doi.org/10.1108/BIJ-10-2019-0439
- Glock, C. H. (2012). Lead time reduction strategies in a single-vendor-single buyer integrated inventory model with lot size-dependent lead times and stochastic demand. International Journal of Production Economics, 136(1), 37–44. https://doi.org/10.1016/j.ijpe.2011.09.007
- Goyal, S.K. (1976) An integrated inventory model for a single supplier–single customer problem. International Journal of Production Research, 151, 107–111. https://doi.org/10.1080/00207547708943107
- Gutowski, A., Dahmus, J., Thiriez, A. (2006). Electrical energy requirements for manufacturing processes. Proceedings of the 13th CIRP International Conference on Life Cycle Engineering, LCE 2006. 623–628.
- Halat, K., Hafezalkotob, A., & Sayadi, M. K. (Inpress). The green supply chains’ ordering and pricing competition under carbon emissions regulations of the government. International Journal of Systems Science: Operations and Logistics. https://doi.org/10.1080/23302674.2021.1983884
- Hasan, M. R., Roy, T. C., Daryanto, Y., & Wee, H.-M. (2021). Optimizing inventory level and technology investment under a carbon tax, cap-and-trade and strict carbon limit regulations. Sustainable Production and Consumption, 25, 604–621. https://doi.org/10.1016/j.spc.2020.12.005
- Helveston, J. P., Liu, Y. M., Feit, M. D., Fuchs, E., Klampfl, E., & Michalek, J. J. (2015). Will subsidies drive electric vehicle adoption? Measuring consumer preferences in the U.S. and China. Transportation Research Part A, 73, 96–112. https://doi.org/10.1016/j.tra.2015.01.002
- Heydari, J., Zaabi-Ahmadi, P., & Choi, T. M. (2018). Coordinating supply chains with stochastic demand by crashing lead times. Computers and Operations Research, 100, 394–403. https://doi.org/10.1016/j.cor.2016.10.009
- Hossain, M. S. J., Ohaiba, M. M., & Sarker, B. R. (2017). An optimal vendor-buyer cooperative policy under generalized lead-time distribution with penalty cost for delivery lateness. International Journal of Production Economics, 188, 50–62. https://doi.org/10.1016/j.ijpe.2017.03.015
- Hsiao, Y. C. (2008). A note on integrated single vendor single buyer model with stochastic demand and variable lead time. International Journal of Production Economics, 114(1), 294–297. https://doi.org/10.1016/j.ijpe.2007.01.018
- Huang, Y.-S., Fang, -C.-C., & Lin, Y.-A. (2020). Inventory management in supply chains with consideration of logistics, green investment and different carbon emissions policies. Computers & Industrial Engineering, 139, 106207. https://doi.org/10.1016/j.cie.2019.106207
- Huang, F., & Song, H. (2020). Periodic review integrated inventory model with controllable lead time and setup cost in the presence of a service level constraint. International Journal of Services Technology and Management, 26(6), 478–501. https://doi.org/10.1504/IJSTM.2020.110369
- Islam, S. M. S., Hoque, M. A., & Hamzah, N. (2017). Single-supplier single-manufacturer multi-retailer consignment policy for retailers’ generalized demand distributions. International Journal of Production Economics, 184, 157–167. https://doi.org/10.1016/j.ijpe.2016.11.021
- Jauhari, W. A. (2012). Integrated inventory model for three-layer supply chains with stochastic demand. International Journal of Operational Research, 13(3), 295–317. https://doi.org/10.1504/IJOR.2012.045666
- Jauhari, W. A., Adam, N. A. F. P., Rosyidi, C. N., Pujawan, I. N., & Shah, N. H. (2020). A closed-loop supply chain model with rework, waste disposal, and carbon emissions. Operations Research Perspectives, 7, 100155. https://doi.org/10.1016/j.orp.2020.100155
- Jauhari, W. A., Pujawan, I. N., Suef, M., & Govindan, K. (2022). Low carbon inventory model for vendor–buyer system with hybrid production and adjustable production rate under stochastic demand. Applied Mathematical Modelling, 108, 840–868. https://doi.org/10.1016/j.apm.2022.04.012
- Jauhari, W. A., Sulistyanto, R., & Laksono, P. W. (2018). Coordinating a two-level supply chain with defective items, inspection errors and price-sensitive demand. Songklanakarin Journal of Science and Technology, 40(1), 135–145. https://doi.org/10.14456/sjst-psu.2018.2
- Jazinaninejad, M., Seyedhosseini, S. M., Hosseini-Motlagh, S. M., & Nematollahi, M. (2019). Coordinated decision-making on manufacturer’s EPQ-based and buyer’s period review inventory policies with stochastic price-sensitive demand: A credit option approach. RAIRO Operations Research, 53(4), 1129–1154. https://doi.org/10.1051/ro/2018038
- Johari, M., Hosseini-Motlagh, S. M., Nematollahi, M., Goh, M., & Ignatius, J. (2018). Bi-level credit period coordination for periodic review inventory system with price-credit dependent demand under time value of money. Transportation Research Part A, 114, 270–291. https://doi.org/10.1016/j.tre.2018.04.008
- Karthick, B., & Uthayakumar, R. (2021). A multi-item sustainable manufacturing model with discrete setup cost and carbon emission reduction under deterministic and trapezoidal fuzzy demand. Process Integration and Optimization for Sustainability, 5(3), 505–543. https://doi.org/10.1007/s41660-021-00159-6
- Kundu, S., & Chakrabarti, T. (2018). Impact of carbon emission policies on manufacturing, remanufacturing, and collection of used item decisions with price dependent return rate. OPSEARCH, 5(2), 532–555. https://doi.org/10.1007/s12597-018-0336-y
- Li, X., & Li, Y. J. (2017). On green market segmentation under subsidy regulation. Supply Chain Management, 22(3), 284–294. https://doi.org/10.1108/SCM-11-2015-0425
- Li, Z., Pan, Y., Yang, W., Ma, J., & Zhou, M. (2021). Effects of government subsidies on green technology investment and green marketing coordination of supply chain under the cap-and-trade mechanism. Energy Economics, 101, 105426. https://doi.org/10.1016/j.eneco.2021.105426
- Lou, G. X., Xia, H. Y., Zhang, J. Q., & Fan, T. J. (2015). Investment strategy of emission-reduction technology in a supply chain. Sustainability, 7(8), 10684–10708. https://doi.org/10.3390/su70810684
- Lukas, S., & Welling, A. (2014). Timing and eco(nomic) efficiency of climate-friendly investments in supply chains. European Journal of Operational Research, 233(2), 448–457. https://doi.org/10.1016/j.ejor.2013.03.017
- Luo, R., Zhou, L., Song, Y., & Fan, T. (2022). Evaluating the impact of carbon tax policy on manufacturing and remanufacturing decisions in a closed-loop supply chain. International Journal of Production Economics, 245, 108408. https://doi.org/10.1016/j.ijpe.2022.108408
- MIDA. Malaysian Investment Development Authority? Tax Incentives for Green Industry. www.mida.gov.my/home/tax-incentives-for-green-industry/posts/
- Mou, Q., Cheng, Y., & Liao, H. (2017). A note on “lead time reduction strategies in a single-vendor-single-buyer integrated inventory model with lot size-dependent lead times and stochastic demand. International Journal of Production Economics, 193, 827–831. https://doi.org/10.1016/j.ijpe.2017.09.012
- Nematollahi, M., Hosseini-Motlagh, S. M., Ignatius, J., Goh, M., & Nia, M. S. (2018). Coordinating a socially responsible pharmaceutical supply chain under periodic review replenishment policies. Journal of Cleaner Production, 172, 2876–2891. https://doi.org/10.1016/j.jclepro.2017.11.126
- Nouri, M., Hosseini-Motlagh, S.-M., & Nematollahi, M. (2021). Proposing a discount policy for two-level supply chain coordination with periodic review replenishment and promotional efforts decisions. Operational Research, 21(1), 365–398. https://doi.org/10.1007/s12351-018-0434-x
- Pan, J., Chiu, C.-Y., Wu, K.-S., Yang, C.-T., & Wang, Y.-W. (2021). Optimal pricing, advertising, production, inventory and in-vesting policies in a multi-stage sustainable supply chain. Energies, 14(22), 7544. https://doi.org/10.3390/en14227544
- Pan, J., Chiu, C.-Y., Wu, K.-S., Yen, H.-F., & Wang, Y.-W. (2020). Sustainable production–inventory model in technical cooperation on investment to reduce carbon emissions. Processes, 8(11), 1–17. https://doi.org/10.3390/pr8111438
- Rad, M. A., Khoshalhan, F., & Glock, C. H. (2018). Optimal production and distribution policies for a two-stage supply chain with imperfect items and price- and advertisement-sensitive demand: A note. Applied Mathematical Modelling, 57, 625–632. https://doi.org/10.1016/j.apm.2016.11.003
- Ramandi, M. D., & Bafruei, M. K. (2020). Effects of government’s policy on supply chain coordination with a periodic review inventory system to reduce greenhouse gas emissions. Computers & Industrial Engineering, 148, 106756. https://doi.org/10.1016/j.cie.2020.106756
- Rout, C., Paul, A., Kumar, R. S., Chakraborty, D., & Goswami, A. (2021). Integrated optimization of inventory, replenishment and vehicle routing for a sustainable supply chain under carbon emission regulations. Journal of Cleaner Production, 316, 128256. https://doi.org/10.1016/j.jclepro.2021.128256
- Saga, R. S., Jauhari, W. A., Laksono, P. W., & Dwicahyani, A. R. (2019). Investigating carbon emissions in a production-inventory model under imperfect production, inspection errors and service-level constraint. International Journal of Logistics Systems and Management, 34(1), 29–55. https://doi.org/10.1504/IJLSM.2019.102062
- Sakulsom, N., & Tharmmaphornphilas, W. (2019). Heuristics for a periodic-review policy in a two-echelon inventory problem with seasonal demand. Computers & Industrial Engineering, 133, 292–302. https://doi.org/10.1016/j.cie.2019.05.017
- Sepehri, A. (2021). Optimizing the replenishment cycle and selling price for an inventory model under carbon emission regulation and partially permissible delay in payment. Process Integration and Optimization for Sustainability, 5(3), 577–597. https://doi.org/10.1007/s41660-021-00164-9
- Shao, L. L., Yang, J., & Zhang, M. (2017). Subsidy scheme or price discount scheme? Mass adoption of electric vehicles under different market structures. European Journal of Operational Research, 262(3), 1181–1195. https://doi.org/10.1016/j.ejor.2017.04.030
- Taleizadeh, A. A., Shokr, I., & Joali, F. (2020a). Optimizing vendor-managed inventory systems with limited storage capacity and partial backordering under stochastic demand. RAIRO Operations Research, 54(1), 179–209. https://doi.org/10.1051/ro/2018090
- Taleizadeh, A. A., Shokr, I., Konstantaras, I., & VafaeiNejad, M. (2020b). Stock replenishment policies for a vendor-managed inventory in a retailing system. Journal of Retailing and Consumer Services, 55, 102137. https://doi.org/10.1016/j.jretconser.2020.102137
- Truck, V., Emissions from Volvo’s truck, (2018). https://www.volvotrucks.com/content/dam/volvo/volvo-trucks/markets/global/pdf/our-trucks/Emis_eng_10110_14001.pdf
- Turken, N., Geda, A., & Takasi, V. D. G. (2021) The impact of co-location in emissions regulation clusters on traditional and vendor managed supply chain inventory decisions. Annals Operations Research. https://doi.org/10.1007/s10479-021-03954-z
- Ujala, Y., (2021). Free LED Bulb Scheme - PM Jan Dhan Yojana. https://pmjandhanyo.jana.co.in/ujala-free-led-bulb-scheme-9-price/
- Yadav, D., Kumari, R., Kumar, N., & Sarkar, B. (2021). Reduction of waste and carbon emission through the selection of items with cross-price elasticity of demand to form a sustainable supply chain with preservation technology. Journal of Cleaner Production, 297, 126298. https://doi.org/10.1016/j.jclepro.2021.126298