
Abstract
This study aims to identify acceptable RIC indicators for Indonesian conditions. The article discusses RIC indicators developed from NICs modified from Bontis’s and tailored to the requirements of Indonesia. The research was carried by utilizing data from IC disclosures in 38 Indonesian areas. There are three phases to the process. The first process is in-depth interviews, followed by focus group discussions (FGD), and finally by rediscussion. As a result, human capital in Indonesia, as measured by education, knowledge, and competence, is an example of capacity at the regional level. Customer or national loyalty, exposure to navigation, flexibility, and adaptation are key capital market points in Indonesia. Human capital in Indonesia is an example of capability, as measured by education, knowledge, and competence. Customer or national loyalty, exposure to navigation, flexibility, and adaptation are key capital market points in Indonesia. Meanwhile, the corporate environment, government presence, and knowledge transfer are used to assess process capital. GDP is a proxy for regional financial capital. The renewal capital index is based on basic research, R&D investment, and employer-university partnership. The model is unique in that it includes regional economic capital. The RIC indicators presented in Indonesia’s regions provide the user with numerous options, and the choice can be based on practical considerations such as the availability of needed data, the ease of implementation of the model, or the extent of complexity.
1. Introduction
Creating strategies for managing intellectual capital at the regional level has become a hot subject due to its increasing significance of it as a driver of economic progress. (Secundo et al., Citation2020; Song et al., Citation2021). Regional Intellectual Capital (RIC) is now an element of the nation’s most important resource and productivity because it embodies the intangible values of individuals, businesses, institutions, communities, and regions that have essentially become a source of wealth and the development of future prosperity (Bontis, Citation2004). Moreover, The Public Organization has recognized the value of RIC investment in affecting economic development, job creation, and quality of life at the local level—where it is most accessible to society (Cerisola & Panzera, Citation2021; Shao & Razzaq, Citation2022). As a result, researchers have studied assessing RIC during year 2012–2022 (Bontis, Citation2012; Chao et al., Citation2015; Liu et al., Citation2021; Roze, Citation2021; Vo & Tran, Citation2022). They even consider and admit that there is a need to determine resources, as (Bontis, Citation2004) emphasized. However, in the last ten years, different ideas on the measurement of Intellectual Capital have been implemented at the Regional and even National Levels (Sweden, Denmark, Israel, the Arab region, Nordic countries, EU projects, etc.), still not included in any sample (Shkola et al., Citation2021). Therefore, the primary purpose of this study is to assess the National Intellectual Capital in Indonesia, a developing country, by comparing the assessment results with other developing countries. The following steps must be carried out in order to meet the research’s goals: (1) Regional Intellectual Capital valuation methodology; (2) RIC assessment techniques; (3) mapping RIC indicators for developing countries; (4) The value of the RIC level of Developing Countries compared to the RIC level of Indonesia compared to the indicators of wealth and competitiveness of other emerging countries: GDP per capita, Human Development Index (IPM), and World Ranks.
Therefore, one of the most famous and popular indicators used to measure National Intellectual Capital is the Intellectual Capital Index (NICI) which Bontis introduced in 2004. The National Intellectual Capital Index (NICI) is a guideline that has emerged over the last ten years—based on the essence of the critical methodology. The NIC indicators have been reduced to the RIC level. As for RIC, for the most part, the author employs a group of quantitative and qualitative indicators, which are usually grouped into five applicable categories: intellectual capital: Human capital, market capital, process capital, renewal capital and regional capital. If there are different composite indices, they will be calculated and connected causally with subsequent economic performance. In the end, different recommendations and suggestions will be given to the results obtained. The most recent research examined by (Mačerinskienė et al., Citation2019; Švarc et al., Citation2020; Vo & Tran, Citation2021) on a series of indicators that explain NIC is proposed.
Furthermore, RIC indicators that are derived from NIC are determined based on a variety of criteria. The first is Popularity, the second is strong in reasoning despite various studies, the third is individual wisdom, the fourth is the interrelationship between the Intellectual Capital index and the productivity of a region, and others. Accuracy and correctness are certainly desired basic characteristics, however applying highly valid indicators in big sample studies frequently runs into issues with data availability (Januškaitė & Užienė, Citation2018). Trequattrini et al. (Citation2018) found that the concept of local IC in an educational perspective is to appreciate the function of entrepreneurship-based universities in building and increasing resources to realize a region. However, the findings suggest that governments need to design focused policies that give higher priority to nurturing local entrepreneurs, promoting successful entrepreneurial role models, and removing bureaucratic barriers to provide more accurate data.
In several other previous studies, indicators of intellectual capital are frequently discussed in relation to economic productivity, which is seen to be interconnected with and highly dependent on both intellectual capital and economics (Diebolt & Hippe, Citation2022). Asgari Seymareh and Armanmehr (Citation2020) found that the system dynamics model indicates the positive and small impact of intellectual capital on Iran’s economic growth. The reason for the small impact of intellectual capital on growth is the lack of infrastructure and complementary conditions that can be provided with appropriate planning and policies. Abdouli and Omri (Citation2021) found that bridging social capital is fundamental for stimulating economic growth, especially in low-skilled regions in 190 regions of 21 EU countries.
Other study using a dynamic model based on the system generalized method of moments (SGMM) and analysed a balanced panel data covering 35 countries from 1980–2008 in Sub-Saharan Africa (SSA) has been done by (Abdouli & Omri, Citation2021), the empirical results show that the two measures of human capital have positive effects on economic growth. Hamidi et al. (Citation2019)builds on Metropolitan Compactness Index (MCI) and examines the relationship between regional compactness and Regional Innovation Capacity (RIC) in the US. Findings indicate that all three indicators of RIC are positively associated with MCI.
However, in this study, characteristics that are not directly related to IC, such as the number of natural resources or the success of the national strategy, transportation statistics, and transparency of community satisfaction data are included since they can have an impact on economic productivity. Additionally, according Ali et al. (Citation2018), each nation has a distinct knowledge base based on its degree of Intellectual Capital stock and particular economic performance (GDP). In this study, a combined index in a knowledge platform owned by Indonesia as an emerging country and integrating several indicators of intellectual capital at the regional level will provide valuable information for other emerging countries.
2. Theoretical background
2.1. Literature review
Intellectual capital is information and knowledge that can be applied to a job to create value within the company (Bontis, Citation2001; Moon & Kym, Citation2006). In general, intellectual capital is divided into three components: customer capital, human capital, and structural capital. VAIC (value-added intellectual coefficient) is a method developed by Public, 1998, and VAIC is a tool used to measure the company’s intellectual capital performance. The three components of VAIC are value-added capital employed (VACA), value-added human capital (VAHU), and structural capital value-added (STVA; Batubara et al., Citation2021; Yudawisastra et al., Citation2018). Several academic researchers (Cohen et al., Citation2014; Hermanto et al., Citation2021; Pulic, Citation2012; Sudarsanam et al., Citation2012) have discussed intellectual capital from a financial perspective, and there are experts who immediately include the country at the conceptual level. Understanding the synergistic modulation link that may add value to each sub-component of intellectual capital is critical to deciding success. Other than increased money, increasing a nation’s intellectuality may enhance people’s lives in a variety of ways. In a country, intellectual capital encompasses the unseen values of individuals, businesses, organizations, communities, and places that may now generate more income.
Intellectual capital is examined more comprehensively. Not just as a company’s asset bound in commercial relationships and the environment but also as intellectual property. A community’s capital is tied to relational and geographical closeness. As a result, the concept of national intellectual capital emerged due to this tendency. Define the NIC as all intangible resources accessible to a country or area that give rise to economic activity perceived convenience and which, when combined, can yield future advantages (Bontis, Citation2012; C. Y.-Y. Lin & Edvinsson, Citation2010). Several national intellectual capital structural models exist. First, consider intellectual capital. Scandia Navigator’s model, presented by Edvinsson and Malone (Citation1997), is frequently used for national intellectual capital analysis (Bontis, Citation2004; Edvinsson & Dumay, Citation2013; Gogan, Citation2014; Saddam & Jaafar, Citation2021). The intellectual capital model provided by Scandia Navigator IC components are organized in a hierarchical system. This structural model includes Human capital is separated from intellectual capital, which is then separated from structural capital; market capital is separated into organizational capital, and organizational capital is eventually divided be the capital of renewal and the capital of process This hierarchical structure aids in the identification of distinctions. The significance of component capital type for the ultimate value of national intellectual capital can assess the country’s four categories of capital (people, market, renewal, and process) intellectual capital. Furthermore, the model in this article is built to measure at the regional level by including regional economic capital.
2.2. The regional intellectual capital (RIC)
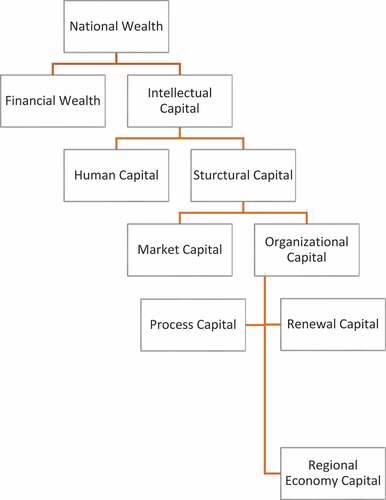
These invisible values are the root of the development of future well-being. For this purpose, it is vital to have a mapping system to describe the intellectual capital that will systematically take into account and follow the evolution of intellectual development. The following structures have been processed from a national-level perspective to a regional level: current market value of regional wealth, current financial capital, financial wealth, regional property, financial property, intellectual capital, human capital, market capital, renewal capital, process capital, and regional economy capital. The system used to describe the construction of national intellectual capital can be presented in a modified intellectual capital navigator for the regional level. Although intellectual capital literature covers only the past ten years, the regional view on this phenomenon remains in its infancy (Kuzkin et al., Citation2019). The countries that have measured and examined the development of their intellectual capital are Europe (Kuzkin et al., Citation2019) and Asia (C. Y.-Y. Lin & Edvinsson, Citation2010) before Indonesia did so. This paper aims to find RIC indicators that are suitable for Indonesian conditions.
2.3. The country of Indonesia
There are still few reports or research on intellectual capital development published, especially for the territory of Indonesia or any Indonesian country personally. This study aims to fill that void and initiate a process whereby the evaluation of Intellectual Capital for the Indonesian region becomes a critical policy intervention. Although Indonesian countries have never been examined through the lens of the intellectual capital framework, there have been independent evaluations of several sub-components of intellectual capital from various organizations, including the United Nations and Bank Indonesia or the World Bank. In carrying out the modernization of the Indonesian state, it must have the following principles:
Human investment through education and training;
View workers as intellectual assets; and
Embed and maintained innovation.
Increasing the spirit of cooperation between workers and citizens as the basis for effective collective performance, especially now that modernization is no longer a luxury but an inevitable necessity for countries that work intending to achieve prosperity and welfare for their people.
The challenge visible in Indonesia is that Indonesia is a developing country with abundant natural resources and contributes significantly to the pace of its economy, which affects its level of wealth. The country of Indonesia is a country with a high level of import demand because it is a country that produces abundant natural wealth, which results in sustainable growth in import demand and a rapid increase in the level of consumer education, with consequent demands for high-quality and sophisticated products. Consumers in Indonesia are not only domestic or local communities but also consumers from various countries.
However, even though import activities in Indonesia are high, export activities also increase, considering that Indonesia is a developing country. In short, the lack of diversification in the Indonesian regional economy must be explored to regulate the movement of needs with a comprehensive meta-policy for its development and to renew intellectual capital in the Indonesian region. The following considerations encourage intellectual development in Indonesia: a lack of a diverse industrial base in practically all parts of the nation, the necessity for a robust education system, and an insufficient education output to meet market demand. As a result, the regional-level model in Indonesia is presented as follows:
Picture 1. RIC in Indonesia.
2.3.1. Human capital
Human capital includes knowledge, wisdom, expertise, intuition, and the ability of individuals to realize national tasks and goals (C. Y. Lin, Citation2018). This focal area also includes the values encompassed within the culture and philosophy of the nation (Chijioke & Amadi, Citation2019; Okumura & Deguchi, Citation2021). Human capital constitutes a population’s total capabilities as reflected in education, knowledge, health, experience, motivation, intuition, entrepreneurship, and expertise. In addition, a highly skilled labor force, the availability of scientists and engineers, a female labor force, and health (life expectancy, physicians) are also good indicators.
2.3.2. Market capital
Market capital refers to the available assets embodied in the nation’s relationship with the international market (Dahlhaus & Vasishtha, Citation2020). It is the aggregate of a country’s capabilities and successes in providing an attractive, competitive solution to the needs of its international clients, a country’s investment, and achievements in foreign relations, coupled with its exports of quality products and services. The assets in this focal point include customer or national loyalty, openness to globalization, flexibility and adaptability, the resilience of the economy, and the satisfaction expressed by strategic customers and national trading partners.
2.3.3. Process capital
Process capital is the cooperation and flow of knowledge that require structural intellectual assets, such as information systems, hardware, software, databases, laboratories, national infrastructure (Tzu-Yorn & Sandui, Citation2017). Regional infrastructure includes transportation, information technology skills, communications and computerization, technological readiness and telecom services, personal computers, cellular subscribers, cyber security, quality scientific research institutions, knowledge transfer, the legal environment for entrepreneurship, minimum number of days to start a business, quality management system, agricultural productivity.
2.3.4. Financial capital
Financial capital refers to Gross Domestic Product (GDP), external debt, industrial production by major branches and inflation (Badwan & Atta, Citation2021; Ulum et al., Citation2017). Financial Capital Inflows of the most important resources that the country needs and lacks to all Developing Countries at present, and also, the country’s scarce resources to more efficient Sectors of the Economy, causing (GDP) Growth.
2.3.5. Renewal capital
Renewal capital refers to a nation’s capabilities and real investments made to increase its competitive strength in future markets, which, in turn, encourages future growth (C. Y.-Y. Lin & Edvinsson, Citation2011). Renewal and development assets include investments in research and development, patents, trademarks, start-up companies, the number of scientific publications, the number of patents registered in the US, EPO patent applications, total expenditure on R&D, and capacity for innovation (C. Y. Lin, Citation2018).
2.3.6. Regional economy capital
Regional Economy capital is defined as the system of territorial assets of economic, cultural, social and environmental nature that ensures the development potential of places. The potential of this concept resides in the recognition of possible interactions between factors of different nature (Faggian et al., Citation2019). In the context of the regional economy, industrial competitiveness, centers of industrial activity, economic business, and the determination of economic shifts are important things that must be identified.
3. Methods
In the context of the regional economy, the evaluation of regional intellectual capital is complex because nothing is measurable metric parameters which allow us to measure these objects directly (Frondizi et al., Citation2019). The RIC indicators are based on assessing regional resources that can be measured directly and are available in Indonesia. Such an approach evaluates abstract concepts such as competitiveness (Brankovic et al., Citation2018), quality of life, and a leading economic property (Uysal & Sirgy, Citation2019). The subjective approach to measuring comes in two areas when utilizing this measurement. First, the RIC value will be determined by the indicator used to assess each notion. Due to the measuring model being tailored to the country of Indonesia, which is a developing market. Furthermore, the indicators chosen represent the most relevant characteristics of the period under consideration.
The characteristics of regional intellectual capital and its importance have changed with the level of development of a region in Indonesia. The measures used need to be adjusted to track it. As for industrial competitiveness, industrial activity, economic business, and economic shifts are essential things that must be identified. Finally, the research is planned to be carried out in three stages. First, in-depth interviews. In in-depth interviews, opinions from experts in their fields will be explored across academic studies to obtain as much input as possible about the right size and parameters to describe RIC. Second, focus group discussion (FGD). The FGD will be conducted with a minimal group to map the results of the in-depth interviews. The output of this stage is a draft RIC. Third, rediscussion. The RIC draft produced in the second stage was sounded and re-discussed with the parties involved in the first stage before being published.
4. Findings
Studies with previous IC models have created a widely accepted taxonomy with three main components: HC, SC, and RC (Dženopoljac et al., Citation2016). Canibano, L., García-Ayuso, M., & Sánchez, M. P. (Citation2000). proposed a three-step system for evaluation and management of corporate IC: Identify the company’s strategic and critical objectives intangibles, then define an indicator system, and finally manage and assess the intangible. Several NIC studies have emerged replicating micro measurements models (Labra & Sánchez, Citation2013; Lazuka, Citation2012), such as ICN, IC-dVAL, and VAIC. The quantity of information involved and the specifics of the investigated entity distinguish IC at the enterprise and regional levels (RIC). Furthermore, regional comparisons necessitate the exclusion of each country’s particularities, making a comparative evaluation impossible when diverse aims and techniques are considered (Orjala, Citation2021). are the results of the RIC indicators found according to the country conditions of Indonesia which has been patented as an intellectual property right belonging to Indonesia number EC00202265896, by Ulum:
Table 1. Modified RIC indicators in Indonesia
The indicators of human capital consist of skilled labor, employee training, literacy rate population, higher education enrollment, the ratio between students and teachers, internet users and public spending on education. Participants are skilled workers using data on the number of Educated Populations (Labor Force Based on Education and Receiving Training. The function of measuring this indicator is to measure regional competitiveness by measuring the number of literate people and the number of people who have and attend structured training, both formal or informal.
Furthermore, the employee training uses Human Development Index (HDI) data types, HDI Improvement Regulations with data measuring functions, namely measuring regional competitiveness data and using measurements of the number of people accessing formal education, the number of people accessing health, life expectancy and International Labour Organization (ILO) rules. Next is the Literacy Rate Population by using the Literacy Rate data type. This indicator is also to measure the region’s competitiveness by using the measurement of literacy rates and demographic data consisting of population, density and people of productive age.
In addition, indicators of human capital are registrants from universities using population data types based on education level to measure regional competitiveness using data measurements of education level is taken and number of school availability. Next is the ratio between students and teachers by using data on the ratio of teacher availability to measure alternative competitiveness by using measurements of the number of schools available, the number of teachers available, the number of people who are currently studying and the ratio of students and teachers.
Furthermore, internet users by definition of internet users from a region. Using Internet Center and Technology (ICT) data types. The data measurement function is for distribution by measuring the number of internet service users, the number of cellular phone users and the number of telecommunications operating companies. The last human capital indicator is public spending on higher education using data on public spending (education). The measuring function of this indicator is an alternative to measuring the competitiveness and distribution of public finances by using the measurement of GDP and Education Expenditure Allocation.
The second indicator is the capital market which consists of cross-border business, transparency, business regulations, export of goods, foreign languages, tourism sector, business transactions, international services and products, international awards, immigration and emigration data, number of athletes, Olympic appearances and number of scholarships. Cross-border businesses use the measurement of Net export, Net import and Realization of revenue through import duties and excise. The second indicator is transparency by using the measurement of the community satisfaction index and using data from NGOs.
Furthermore, business regulations use measurement data from Micro,Small, Medium enterprises (MSMEs), the number of MSMEs receiving financing, the number of tax receipts from MSMEs, and the amount of state capital participation for MSMEs. Next is the export of goods using the EXP Value data type and the data measurement function as comparative and competitive advantage. The measurement used is the value of exports and the number of export products. The next indicators is a foreign language, which is meant by foreign nationals who speak various languages using measurements of education level and a number of language institutions.
In addition, the tourism sector is defined by the entry and exit of tourists using the measurement of the number of foreign visits and the number of departures of domestic people. Then, business transactions use the measurement of investment policy, investment period, investment size and a number of manufacturing industries. In addition, there are also international services and products using measurements of the number of migration workers, remittent data and foreign exchange data.
International award using the measurement of participation data in international awards. There are also immigration and emigration data with the function of measuring data for determining the density and using population measurements, population mobility data and demographic numbers. The number of athletes using the measurement of profession or career data. Then there are also Olympic performances using professional or career data measurements. The last is the number of scholarships, which is the number of students who study abroad using data on education level measurements, data on scholarship recipients and data on scholarship providers, both government and private.
Process capital is the third indicator consisting of business competition environment, government efficiency, protection of intellectual property rights, availability of capital, computers used per capita, transportation statistics and Entrepreneurship. The first is the relationship between business competition using MSME measurement data, the number of MSMEs receiving financing, the amount of tax receipts from MSMEs and the amount of state equity participation for MSMEs. Then the second is government efficiency with the function of measuring data as an alternative to the index of industrial centers and using government satisfaction measurements and data on financial absorption from the government. The protection of intellectual property rights by using data measurement of the number of recipients and givers of IPR. Then, the amount of capital availability with the data measurement function as an alternative at the center of the use of measurement of MSMEs receiving financing, tax receipts from MSMEs and the amount of state capital participation for MSMEs. Furthermore, computers used per capita are defined as various percentages of people who have computers using ICT data types and data measurement functions as an alternative to the distribution and use of measuring the number of internet service users, the number of cellular phone users and the number of telecommunications operating companies.
Moreover, transportation statistics using data on the number of public vehicles, private vehicle data, taxes and road length. The last is the field of entrepreneurship by using the measurement of start-up data and MSME data. The next indicator is capital consisting of basic research, Research and Development Expenditures/GDP, research and development researchers, Cooperation between universities and companies, postgraduate students and Trademarks. The first part is a basic research using macro and micro economic activity data types as a function of measuring data to strengthen regional competitiveness. This uses the measurement of the number of sectoral GRDP, the number of industries, the number of workers and residents with the data function as an alternative to public finance for regional activities. This data uses GDP data for both income and expenditure.
In term of research and development expenditure/GDP, using a measurement function as an alternative to the distribution of public finances on regional activities and measuring GDP data, both income and expenditure. Furthermore, research and development uses industrial output data types and measurement data functions as regional competitiveness and uses the following measurements, namely the number of formal and informal workers. In addition, there is also collaboration between universities and companies by using measurements of the number of universities, the number of industries and collaboration data. Postgraduate students who are defined as postgraduate students who study abroad and return home by using data on education level measurement, number national scholarship recipients and number of scholarship granting institutions. The last is a mark which is defined as the number of applicants to register a trademark using the measurement of the number of registered trademarks and the number of PIRTs. Furthermore, the financial capital indicator consisting of GDP per capita (PPP) (From the IMF) which is defined as domestic product based on purchasing power parity (PPP) per capita using the measurement of GNP Data and GDP Data. The last indicator is the regional economy which consists of industrial competitiveness, determining the center of industrial activity, determining the economic base and economic balance. The first is industrial competitiveness, which is defined as Strengthening Competitiveness through a Spatial Approach. Number of Industries for the Locations Under Study by using data types on the number of labor industries and using a competitiveness benchmark function by measuring the amount of Gross Regional Domestic Product (GRDP), the number of industrial outputs, the number of industries, the number of workers., education level and number of Labor Force Participation Rate (LFPR).
The center of industrial activity which is defined as industrial location, core area location, sub-core location using data on the number of public facilities and the number of economic supporting facilities. It uses measurements of the number of public facilities, markets, number of industries, number of kindergartens and total population. The third is the determination of the economic base which is defined as the economic base sector with the function of measuring data as the On the basis of constant prices GRDP of the priority area and the GRDP (on the basis of constant price) of the comparison area by using measurements of the GRDP (on the basis of constant price) of the priority area, GRDP (on the basis of constant price) of the comparison area, comparison, population and direct labor. The last is the economic shift with the definition of shift and division of economic activity, industry, the use of labor with the function of measuring data as the GRDP of the priority area and the GRDP of the comparison area by using the measurement of the on the basis of constant price GRDP of the priority area, the GRDP of the comparison area, residents and direct labors.
5. Research implication
The information provided by the model about a nation’s intangibles and expressions in its development, competitiveness, or innovative capacity supports current economic performance because IC represents the capacity to create wealth. The RIC indicators displayed in regions spread throughout Indonesia measure intangibles that require different inputs (information). It provides the user with several alternatives, and the selection can be based on practical issues, such as the availability of the required data, whether the model is easy to implement, or the level of complexity.
6. Research limitations
Based on the information reported in this article, the Index provided by the international organization model is easier to understand, but does not provide precise information about a country’s RIC. This is because the level of characteristics of each country is different, as well as Indonesia. In addition, regional ranking and comparative evaluation in academic models have attracted more attention for cross-regional comparisons and for benchmarking.
7. Recommendations
Based on these indicators, some possible policy recommendations from the literature and model analysis, because RIC which is a derivative of the NIC is the most important factor in determining the economic growth of each region in Indonesia. An adequately managed knowledge economy is important to improve the quality of life of the people in each region. Therefore, the government should seek to improve HC, increase SC, and further develop local and international relations. Any RIC assessment model can assist in this task by facilitating the measurement and management of RIC in Indonesia. This study has several limitations due to the wide dissemination of information related to RIC, so the indicators are adjusted to the available data in Indonesia. Therefore, there may be more information about RIC in other developing countries. A new model that supports the measurement of RIC in Indonesia with economic performance needs to be done for further research.
8. Conclussions
The proposed regional intellectual capital measurement model is used to evaluate RIC in Indonesia as an emerging country. The indicators of NIC are adopted and developed in accordance with data availability in Indonesia. In the regional-level, human capital in Indonesia is seen from education, knowledge, and competence are all examples of capabilities. A highly trained workforce, the availability of scientist, student-teacher ratio, internet users and are also related indicators. Customer or national loyalty, openness to globalization, flexibility and adaptation, the economy’s resilience expressed by key customers and national trade partners are the major sources of market capital in Indonesia. While process capital is evaluated from the business environment, government existence, knowledge transfer, the legal environment for entrepreneurship, minimum number of days to start a business, quality management system, agricultural productivity.
Moreover, financial capital at the regional level is measured by GDP. The renewal capital indicator is measured from basic research, research and development spending, cooperation between entrepreneurs and universities, number of graduate students and trade marks. The model also adds regional economic capital as measured by several indicators, including industrial competitiveness, centers of industrial activity, economic business, and the determination of economic shift. Only indicators that meet data availability in Indonesia are identified in this article, so adjustments in other emerging countries need to be investigated further by applying the case analysis method.
Disclosure statement
No potential conflict of interest was reported by the author(s).
Additional information
Funding
Notes on contributors

Ihyaul Ulum
Ihyaul Ulum is a professor at Accounting Department, University of Muhammadiyah Malang (UMM), Indonesia. He currently holds the position as Director of Professional Certification Body at UMM. His main research interest include: intellectual capital, intellectual capital disclosure, intellectual capital performance, and public sector accounting. He is the founder of MVAIC (modified value-added intellectual coefficient) and the framework of intellectual capital disclosure for Indonesian university.
Mudrifah Mudrifah
Mudrifah Mudrifah is a lecturer in the Accounting department, Faculty of Economics and Business, University of Muhammadiyah Malang. His research focuses on Public Sector Accounting, primarily Intellectual Capital and Public Sector Performance.
Setyo Wahyu Sulistyono
Setyo Wahyu Sulistyono is a lecturer at the Department of Economics Development at the University of Muhammadiyah Malang. Currently actively developing research in the field of regional economics.
References
- Abdouli, M., & Omri, A. (2021). Exploring the nexus among FDI inflows, environmental quality, human capital, and economic growth in the Mediterranean region. Journal of the Knowledge Economy, 12(2), 788–16. https://doi.org/10.1007/s13132-020-00641-5
- Ali, M., Egbetokun, A., & Memon, M. H. (2018). Human capital, social capabilities and economic growth. Economies, 6(1), 2. https://doi.org/10.3390/economies6010002
- Asgari Seymareh, E., & Armanmehr, M. (2020). Investigating the effect of intellectual capital on iran’s economic growth (System dynamics approach). Journal of Economics and Regional Development, 27(19), 19–48. https://doi.org/10.22067/erd.2020.39492https://doi.org/10.22067/erd.2020.39492
- Badwan, N., & Atta, M. (2021). Financial capital inflows, manufacturing exports and economic growth in Palestine: A threshold regression analysis. Asian Journal of Economics, Business and Accounting, 21(3), 56–71. https://doi.org/10.9734/ajeba/2021/v21i330362
- Batubara, S. M., Sahari, S., & Jais, S. (2021). Evaluation-value added intellectual coefficient (Ev-VAIC) model expansion: The new measurement model for intellectual capital. International Journal of Academic Research in Business and Social Science, 10(4), 59–72. https://doi.org/10.6007/IJARAFMS/v10-i4/8173
- Bontis, N. (2001). Assessing knowledge assets: A review of the models used to measure intellectual capital. International Journal of Management Reviews, 3(1), 41–60. https://doi.org/10.1111/1468-2370.00053
- Bontis, N. (2004). National intellectual capital index: A united nations initiative for the Arab region. Journal of Intellectual Capital, 5(1), 13–39. https://doi.org/10.1108/14691930410512905
- Bontis, N. (2012). National intellectual capital index: The benchmarking of Arab countries Intellectual capital for communities ( pp. 113–138). Routledge.
- Brankovic, J., Ringel, L., & Werron, T. (2018). How rankings produce competition: The case of global university rankings. Zeitschrift für Soziologie, 47(4), 270–288. https://doi.org/10.1515/zfsoz-2018-0118
- Canibano, L., García-Ayuso, M., & Sánchez, M. P. (2000). Accounting for Intangibles: A Literature Review. Journal of Accounting Literature, 19, 102–130.
- Cerisola, S., & Panzera, E. (2021). Cultural and creative cities and regional economic efficiency: Context conditions as catalyzers of cultural vibrancy and creative economy. Sustainability, 13(13), 7150. https://doi.org/10.3390/su13137150
- Chao, L., Xiao, L., & Lingyu, X. (2015). The influence of regional intellectual capital on regional economic development-evidence from China. International Journal of u-and e-Service, Science and Technology, 8(6), 91–104. https://doi.org/10.14257/ijunesst.2015.8.6.10
- Chijioke, A. K., & Amadi, A. I. (2019). Human capital investment as a catalyst for sustainable economic development in Nigeria. International Journal of Management Science and Business Administration, 5(5), 13–22. https://doi.org/10.18775/ijmsba.1849-5664-5419.2014.55.1002
- Cohen, S., Naoum, V.-C., & Vlismas, O. (2014). Intellectual capital, strategy and financial crisis from a SMEs perspective. Journal of Intellectual Capital, 15(2), 294–315. https://doi.org/10.1108/JIC-11-2013-0110
- Dahlhaus, T., & Vasishtha, G. (2020). Monetary policy news in the US: Effects on emerging market capital flows. Journal of International Money and Finance, 109, 102251. https://doi.org/10.1016/j.jimonfin.2020.102251
- Diebolt, C., & Hippe, R. (2022). The long-run impact of human capital on innovation and economic growth in the regions of Europe. In Claude, D. & Ralph, H. (Eds.), Human capital and regional development in Europe (pp. 85–115). Springer.
- Dženopoljac, V., Janoševic, S., & Bontis, N. (2016). Intellectual capital and financial performance in the Serbian ICT industry. Journal of Intellectual Capital, 17(2), 373–396. https://doi.org/10.1108/JIC-07-2015-0068
- Edvinsson, L., & Dumay, J. (2013). IC 21: Reflections from 21 years of IC practice and theory. Journal of Intellectual Capital, 14(1), 163–172. https://doi.org/10.1108/14691931311289075
- Edvinsson, L., & Malone, M. S. (1997). Intellectual Capital: Realizing Your Company’s True Value by Finding Its Hidden Brainpower. HarperCollins.
- Faggian, A., Modrego, F., & McCann, P. (2019). Human capital and regional development. Handbook of Regional Growth and Development Theories. https://doi.org/10.1093/qje/qjs050
- Frondizi, R., Fantauzzi, C., Colasanti, N., & Fiorani, G. (2019). The evaluation of universities’ third mission and intellectual capital: Theoretical analysis and application to Italy. Sustainability, 11(12), 3455. https://doi.org/10.3390/su11123455
- Gogan, M.-L. (2014). An innovative model for measuring intellectual capital. Procedia-Social and Behavioral Sciences, 124, 194–199. https://doi.org/10.1016/j.sbspro.2014.02.477
- Hamidi, S., Zandiatashbar, A., & Bonakdar, A. (2019). The relationship between regional compactness and regional innovation capacity (RIC): Empirical evidence from a national study. Technological Forecasting and Social Change, 142, 394–402. https://doi.org/10.1016/j.techfore.2018.07.026
- Hermanto, Y. B., Lusy, L., & Widyastuti, M. (2021). How financial performance and state-owned enterprise (SOE) values are affected by good corporate governance and intellectual capital perspectives. Economies, 9(4), 134. https://doi.org/10.3390/economies9040134
- Januškaitė, V., & Užienė, L. (2018). Intellectual capital as a factor of sustainable regional competitiveness. Sustainability, 10(12), 4848. https://doi.org/10.3390/su10124848
- Kuzkin, Y., Cherkashyna, T., Nebaba, N., & Kuchmacz, B. (2019). Economic growth of the country and national intellectual capital (evidence from the post-socialist countries of the central and Eastern Europe). Problems and Perspectives in Management, 17(1), 348–359. https://doi.org/10.21511/ppm.17(1).2019.30
- Labra, R., & Sánchez, M. P. (2013). National intellectual capital assessment models: A literature review. Journal of Intellectual Capital, 14(4), 582–607. https://doi.org/10.1108/JIC-11-2012-0100
- Lazuka, V. (2012). National intellectual capital: Concept and measurement.
- Lin, C. Y. (2018). Intellectual capital of South Africa: A comparison with Poland and Romania. Journal of Intellectual Capital, 19(3), 498–518. https://doi.org/10.1108/JIC-12-2016-0146
- Lin, C.-Y.-Y., & Edvinsson, L. (2010). National intellectual capital: A comparison of 40 countries. Springer Science & Business Media.
- Lin, C.-Y.-Y., & Edvinsson, L. (2011). Introduction of national intellectual capital national intellectual capital ( pp. 1–6). Springer.
- Liu, C., Li, K., Jiang, P., Li, D., Su, L., Lu, S., & Li, A. (2021). A hybrid multiple criteria decision-making technique to evaluate regional intellectual capital: Evidence from China. Mathematics, 9(14), 1676. https://doi.org/10.3390/math9141676
- Mačerinskienė, I., Mačerinskas, J., & Aleknavičiūtė, R. (2019). Change of national intellectual capital in EU countries.
- Moon, Y. J., & Kym, H. G. (2006). A model for the value of intellectual capital. Canadian Journal of Administrative Sciences/Revue Canadienne Des Sciences de l’Administration, 23(3), 253–269. https://doi.org/10.1111/j.1936-4490.2006.tb00630.x
- Okumura, R., & Deguchi, H. (2021). Indicating human capital including non-economic value. Evolutionary and Institutional Economics Review, 18(1), 45–62. https://doi.org/10.1007/s40844-020-00166-1
- Orjala, H. (2021). Misled by data? Review of data sources in national intellectual capital research. Electronic Journal of Knowledge Management, 19(1), 43–53. https://doi.org/10.34190/ejkm.19.1.2243
- Pulic, A. (2012). Value creation efficiency at national and regional levels: Case study—Croatia and the European Union Intellectual capital for communities ( pp. 197–211). Routledge.
- Roze, N. (2021). Measurement of the intellectual capital of Russian regions. R-Economy, 7(2), 72–87. https://doi.org/10.15826/recon.2021.7.2.007
- Saddam, S. Z., & Jaafar, M. N. (2021). Modified Value-Added Intellectual Capital (MVAIC): Contemporary improved measurement model for intangible assets. International Journal of Academic Research in Accounting Finance and Management Sciences, 11(1), 201–210. https://doi.org/10.6007/IJARAFMS/v11-i1/9023
- Secundo, G., Ndou, V., Del Vecchio, P., & De Pascale, G. (2020). Sustainable development, intellectual capital and technology policies: A structured literature review and future research agenda. Technological Forecasting and Social Change, 153, 119917. https://doi.org/10.1016/j.techfore.2020.119917
- Shao, S., & Razzaq, A. (2022). Does composite fiscal decentralization reduce trade-adjusted resource consumption through institutional governance, human capital, and infrastructure development? Resources Policy, 79, 103034. https://doi.org/10.1016/j.resourpol.2022.103034
- Shkola, V. Y., Troian, M. Y., Domashenko, M. D., & Vavilichev, M. D. (2021). Global Competitiveness of the Economy and Intellectual Capital Index: Case of the EU Countries and Ukraine.
- Song, Y., Wei, Y., Zhu, J., Liu, J., & Zhang, M. (2021). Environmental regulation and economic growth: A new perspective based on technical level and healthy human capital. Journal of Cleaner Production, 318, 128520. https://doi.org/10.1016/j.jclepro.2021.128520
- Sudarsanam, S., Sorwar, G., & Marr, B. (2012). A finance perspective on intellectual capital Perspectives on intellectual capital ( pp. 56–68). Routledge.
- Švarc, J., Lažnjak, J., & Dabić, M. (2020). The role of national intellectual capital in the digital transformation of EU countries. Another digital divide? Journal of Intellectual Capital. https://doi.org/10.1108/jic-02-2020-00
- Trequattrini, R., Lombardi, R., Lardo, A., & Cuozzo, B. (2018). The impact of entrepreneurial universities on regional growth: A local intellectual capital perspective. Journal of the Knowledge Economy, 9(1), 199–211. https://doi.org/10.1007/s13132-015-0334-8
- Tzu-Yorn, K., & Sandui, M.-E. (2017). Process capital of Mongolia: Year 2005–2014. Journal of Economics and Political Economy, 4(3), 302–305. https://doi.org/10.1453/jepe.v4i3.1403
- Ulum, I., Kharismawati, N., & Syam, D. (2017). Modified value-added intellectual coefficient (MVAIC) and traditional financial performance of Indonesian biggest companies. International Journal of Learning and Intellectual Capital, 14(3), 207–219. https://doi.org/10.1504/IJLIC.2017.086390
- Uysal, M., & Sirgy, M. J. (2019). Quality-of-life indicators as performance measures. Annals of Tourism Research, 76, 291–300. https://doi.org/10.1016/j.annals.2018.12.016
- Vo, D. H., & Tran, N. P. (2021). Measuring national intellectual capital: A novel approach. Journal of Intellectual Capital. https://doi.org/10.1108/CR-08-2021-0110
- Vo, D. H., & Tran, N. P. (2022). Measuring national intellectual capital and its effect on country’s competitiveness. Competitiveness Review: An International Business Journal. https://doi.org/10.1108/CR-08-2021-0110
- Yudawisastra, H. G., Manurung, D. T., & Husnatarina, F. (2018). Relationship between value added capital employed, value added human capital, structural capital value added and financial performance. Investment Management and Financial Innovations, 15(2), 222–231. https://doi.org/10.21511/imfi.15(2).2018.20