
Abstract
The present study’s objective is to examine the customer satisfaction on cleanliness and other service quality dimensions in Indian Railways. In addition, gender as a moderator in the relationship between various service quality dimensions and passenger satisfaction is studied. The data was collected from 544 passengers in the Tiruchirappalli railway station (Southern Railway Zone). The data was collected between September 2021 and December 2021, soon after the restoration of services after the global pandemic. Data was collected while taking precautions of social distancing and by wearing facemasks. A structured instrument SERVQUAL was used, and the results indicate that passengers were satisfied with the tangibility, assurance, and reliability dimensions of service quality. We performed regressions showing the relationship between service quality variables and passenger satisfaction. We also studied gender as a moderator in the relationship between the five service quality dimensions and passenger satisfaction. The results indicate that gender moderates the relationship between tangibility and customer satisfaction and reliability and passenger satisfaction. The implications for management are discussed.
1. Introduction
Starting on 16 April 1853, when the first train took off from Mumbai to Thane (33-km journey), Indian Railways became the fourth most extensive network globally, covering over 68,000 miles and meeting the needs of over one million 25 million passengers on average every day. In addition to passenger trains, Indian Railways provides freight, parcel services, and tourism. Indian Railways has 293,077 freight wagons, 12,729 locomotives, 76,608 passenger coaches, and 1.3 million employees (”Indian Railways Year-Book” Citation2019-”Citation2020). Since several thousands of passengers travel daily, it is essential to assess the quality of services provided by the trains. Furthermore, as air transportation has become affordable, passengers weigh the quality of services and convenience in train journeys with flight travel. With the increase in competition in transport from Air-conditioned road transportation and air transportation, Railways attempt to satisfy the passenger by providing quality services in terms of ticketing, reservation, convenient seating and berth facilities, catering in the train, and cleanliness, and so on.
Despite the efforts of railway staff to increase amenities and facilities, complaints from passengers have become a regular feature. Some complaints include a lack of cleanliness in washrooms, unhygienic conditions, safety, and overcrowding (Devi Prasad & Raja Shekhar, Citation2010; Kumar & Jain, Citation2017; Priyadharshini & Muthusamy, Citation2017). Some passengers also complain about seat conditions, spacing between the seats, behavior of railway staff, and so on, and recommend that employees undergo training. These complaints indicate that the passengers were unsatisfied with the service quality’s tangibility and empathy dimensions (Balakrishnan, Citation2012). A growing body of research has unraveled the problems associated with service quality in trains and suggested that railway authorities make improvements (a summary of previous studies is mentioned in Table ).
Table 1. Summary of previous studies conducted in India and other countries in rail transport sector
Assessing service quality in various service-based industries has been one of the widely used research areas in marketing. Ever since the publication of the seminal measure of service quality (popularly known as SERVQUAL), researchers for over three decades have examined the service quality using the SERVQUAL measure (Narteh, Citation2018; G. Wu et al., Citation2021; Zeithaml et al., Citation1988; Zygiaris et al., Citation2022). SERVQUAL measures focus on five dimensions: tangibility, reliability, responsiveness, assurance, and empathy. The present study examines the SERVQUAL in Indian Railways, one of India’s largest public sector organizations, to see whether passengers are satisfied with the quality of services provided by Indian Railways.
1.1. Rationale for the present study, research gap, and research questions
Several studies were conducted on service quality in Indian Railways in various locations, and the results have been presented in Table .
Most of the studies supported that out of five service quality dimensions, only two or three of them were met by Indian Railways. In contrast, a small number of studies reported that all five service quality dimensions contributed to passenger satisfaction. Digging up the literature review, we gather that many studies conducted on Indian Railways focused on the effect of service quality dimensions on customer satisfaction. However, no study has explored whether satisfaction is homogeneous or different across genders. Since past researchers have documented gender differences in processing information by customers and subsequent purchase behaviors (Sharma et al., Citation2012; Sun & Qu, Citation2011), it can be argued that gender may play a vital role in customer satisfaction. As no previous study, to our knowledge, has explored gender as a moderator in the relationship between various service quality dimensions and customer satisfaction, especially in connection with Indian Railways, we attempt to bridge this gap. More specifically, we address the following research questions:
RQ 1: How perceived service quality is related to passenger satisfaction?
RQ 2: How does gender moderates in the relationship between service quality and passenger satisfaction? ‘
2. Theoretical background and hypotheses development
The theoretical background for the study comes from SERVQUAL of Parasuraman et al. (Citation1985). The basic tenet of SERVQUAL is that the customers rate their perception and expectations about the service and assign a numerical weight to five categories of service quality dimensions (Parasuraman et al., Citation1988). The measurement tool has become globally popular in almost all service industries; the tool is used to assess service quality.
2.1. Service quality dimensions
In their seminal piece, Parasuraman et al. (Citation1985) advocated that service quality is a multi-dimensional construct consisting of five dimensions: tangibility, responsiveness, reliability, assurance, and empathy. Research over the past three decades has produced an impressive mass of studies applying service quality dimensions to customer satisfaction in various service industries (Narteh, Citation2018; Shainesh & Mathur, Citation2000; Sofyani et al., Citation2020; Yilmaz et al., Citation2018). For example, the effect of service quality on customer satisfaction has been studied across diverse service industries, such as the hotel industry (Alnawas & Hemsley-Brown, Citation2019; Ren et al., Citation2015), banking industry (Chang et al., Citation2017; Karatepe et al., Citation2005; Teeroovengadum, Citation2020), tourism (Srivastava & Kumar, Citation2021). In addition to direct effects, some scholars examined the mediating role of affective commitment in explaining the relationship between service quality and customer satisfaction (Bahadur et al., Citation2018).
2.2. Tangibility and passenger satisfaction
Tangibles are things that can be seen, touched, and physically exist. The tangibility dimension includes the organization’s physical facilities, materials, equipment, environmental conditions, communication, and so on, which consumers can observe and feel (Davis et al., Citation2003; Fitzsimmons & Fitzsimmons, Citation2014). In the context of service quality in railways, tangibles refer to the lighting, air-conditioning, seating arrangement, and service. Therefore, the quality and usability of tangibles are significant dimensions of service quality. Extant research documented a significant positive relationship between the tangible dimension of service quality and customer satisfaction (Agarwal, Citation2008; Gandhimathi & Saravanan, Citation2013; Mageshwarii & Vasanthi, Citation2020; Maheswari & Dinesh Kumar, Citation2016). In addition, the tangibility dimension has been associated with customer satisfaction in several industries (Belás & Gabčová, Citation2016; Boonitt & Rompho, Citation2012; Cameran et al., Citation2010; Kaura et al., Citation2015; Ranjan et al., Citation2020). Based on the above, we hypothesize:
H1: “Tangibles” of services has a significant positive impact on passenger satisfaction.
2.3. Reliability and passenger satisfaction
Reliability is concerned with the ability to provide committed services to customers’ satisfaction. Customers need to feel that the services are reliable and trustworthy. In this study, reliability was operationalized in terms of the railways (for that matter, any organization) meeting the promises made to customers (or customers). In other words, reliability deals with the commitment of services promised to be delivered to customers. Attending to the customers’ needs as and when required vouch for reliability. For example, maintaining timings of arrival and departure of trains at the scheduled time, while barring exceptions to delays due to unavoidable causes, contributes to reliability. Several researchers documented a positive relationship between the “reliability” dimension of service quality to customer satisfaction (Han et al., Citation2021; Lee & Moghavvemi, Citation2015; Mageshwarii & Vasanthi, Citation2020; Priyadharshini & Muthusamy, Citation2017). In a study conducted in the hotel industry in Vietnam, Minh et al. (Citation2015) found that reliability was positively associated with customer satisfaction. Based on the above arguments, we hypothesize:
H2: “Reliability” of services has a significant positive impact on passenger satisfaction.
2.4. Responsiveness and passenger satisfaction
Responsiveness refers organization’s ability to be flexible in providing services as demanded by a changing environment. In a recent study conducted by Ranjan et al. (Citation2020), it was found that responsiveness on the part of the railway staff (Indian Railways) was an essential factor contributing to passenger satisfaction. A recent study conducted in supermarkets in Fiji found that service quality is positively related to customer satisfaction, increasing customer loyalty (Slack & Singh, Citation2020). Earlier, researchers found a positive association between responsiveness and customer satisfaction (Balakrishnan, Citation2012; Bharathi, Citation2010; Kumar & Jain, Citation2017). In a study conducted in military peacekeeping missions in Malaysia, it was found that responsiveness is positively related to customer satisfaction (Ismail et al., Citation2013). Available research evidence suggests that responsiveness is expected to be associated with customer satisfaction, though, in some studies, the relationship is not established (Anantha Lakshmi & Murugesan, Citation2018; Rajaram, Citation2011). Since the majority of studies reported a positive relationship between responsiveness and customer satisfaction, we hypothesize:
H3: “Responsiveness” of services has a significant positive impact on passenger satisfaction.
2.5. Assurance and passenger satisfaction
Assurance is concerned with building trust in the organization by providing quality service. When employees of Railways deal with professionalism and create unflinching trust among the passengers, the quality of services promised is provided. The positive association between assurance and customer satisfaction has been reported by several studies (Ismail et al., Citation2013; Saputra, Citation2010; Sharma & Yadav, Citation2013), though in some studies, the positive relationship was not documented (Mageshwarii & Vasanthi, Citation2020; Vishnuvarthani & Selvaraj, Citation2012). In their research on customer satisfaction at Ujjain Railway station, Sharma and Yadav (Citation2013) reported that all five service quality dimensions were associated with passenger satisfaction. In another study conducted at Coimbatore Railways station, the findings indicated that passengers were satisfied with the assurance dimension of service quality (Maheswari & Dinesh Kumar, Citation2016). As an essential, Parasuraman et al. (Citation1985, Citation1988) contend that assurances provided by organizations would enhance customer satisfaction. Based on available evidence, we hypothesize:
H4:“Assurance” of services has a significant positive impact on passenger satisfaction.
2.6. Empathy and passenger satisfaction
Empathy is concerned with understanding what customers want and seeing the services from customers’ viewpoints. Organizations need to consider every individual customer and attend to their requirements. Empathy was positively associated with customer satisfaction and loyalty (Fida et al., Citation2020). In studies on Indian Railways, several researchers documented that empathy was a critical dimension contributing to passenger satisfaction (Anantha Lakshmi & Murugesan, Citation2018; Hundal & Kumar, Citation2015; Vishnuvarthani & Selvaraj, Citation2012). Empathy is concerned with how organizations show personal attention to every potential customer and attend to their needs. In Indian Railways, empathy reflects how the railway staff offers concern to the customers, how they serve to change customers’ needs, how they maintain timings according to the convenience of customers, and so on. For example, introducing special trains during the busy summer season, where many customers go on summer vacation and pilgrimage and adding additional coaches for customers’ convenience show empathy towards customers. Realizing the needs of passengers, Indian Railways adds other coaches and special trains during rush (Hundal & Kumar, Citation2015). In addition, many studies documented that passengers are satisfied with the empathy dimension of service quality. Based on the above, we hypothesize:
H5: “Empathy” of services has a significant positive impact on passenger satisfaction.
2.7. Obstacles and passenger satisfaction
As with any service organization, passengers in Indian Railways also encounter some obstacles. These may include problems regarding ticketing and parcel booking, timely refunding of money for canceled tickets, facilities in the waiting rooms, safety in cloakrooms, and so on. For example, in a recent study conducted in Madurai city in the Southern Zone of Indian Railways, Makesh and Mathankumar (Citation2018) documented that passengers faced problems with ticketing facilities, insufficient rolling stock, and rolling stock and disturbance of beggars inside the coaches. In another study by Johnson (Citation2019), it was reported that some of the problems passengers face in Kerala state included cleanliness in washrooms and inadequate water facilities. Based on these, we hypothesize:
H6: Obstacles are negatively associated with passenger satisfaction.
2.8. Moderation hypotheses
In addition to direct hypotheses, we propose that gender plays a vital role in changing the direct relationship between service quality dimensions and passenger satisfaction. In the marketing literature, gender has been considered a significant variable in influencing profitability and customer satisfaction (Juwaheer, Citation2011; Peter & Olson, Citation2010; Ryan et al., Citation1998). Some researchers examined the influence of gender on customer satisfaction found that women were more satisfied with service quality than men (Kwok et al., Citation2016). Researchers on gender argue that how information is perceived, interpreted, and acted upon differs for females than males (Karatepe, Citation2011). Biological and physical differences apart, women tend to differ from males in assessing product quality attributes and how they engage in purchasing behavior (Karatepe, Citation2011). In a recent study conducted in the banking industry in Mauritius, it was reported that gender differences are significant for males compared to women (Teeroovengadum, Citation2020). The role of gender in influencing consumption patterns and analyzing satisfaction from services stems from socialization and self-construal theories. Women tend to process information in an integrative way. Men tend to overlook the service attributes (Darley & Smith, Citation1995). Several researchers provided empirical evidence that gender differences exist while evaluating the service attributes and customer satisfaction (Iacobucci & Ostrom, Citation1993). Therefore, based on the above, we offer the following hypotheses:
H1a: Gender moderates the relationship between Tangibles and passenger satisfaction
H2a: Gender moderates the relationship between reliability and passenger satisfaction
H3a: Gender moderates the relationship between responsiveness and passenger satisfaction
H4a: Gender moderates the relationship between assurance and passenger satisfaction
H5a: Gender moderates the relationship between empathy and passenger satisfaction
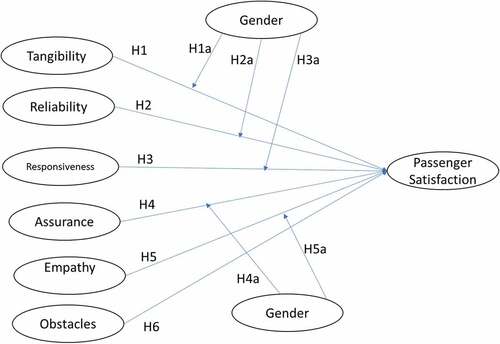
The Conceptual model is presented in Figure .
Figure 1. The Conceptual Model.
3. Method
3.1. Sample
The sample for the present study consists of passengers traveling in Air-Conditioned coaches in Indian Railways. Tiruchirappalli Railway Station was selected for collecting data. Eighty-six express trains are originating, destined, and passing through the Tiruchirappalli railway junction. We selected six express trains randomly from various directions, which constitute 30 express trains that comprise two express trains, each operating daily, weekly once, and weekly twice and more. We contacted the passengers in Railways Station, who were waiting for the trains, and distributed the surveys. Since surveys were not lengthy, the average time taken by passengers was 15 minutes. After 15–20 minutes, we collected the completed surveys by the passengers. Since customers arrive at the railway station at least half an hour to 45 minutes before departure, they have ample time to complete surveys. It took 3 months for us to collect data from the respondents. In all, 576 surveys were collected and found that 32 were incomplete and deleted from the analysis. The final sample consisted of responses from 544 passengers.
3.2. Measures
The perceived service quality dimensions were measured using SERVQUAL dimensions, viz., tangibility, responsiveness, reliability, service assurance, and empathy, adopted from Parasuraman et al. (Citation1988). These were measured on the Likert type 5-point scale (“1” represending “strongly disagree” and “5” representing “strongly agree”).
Tangibility was measured with four items, and the reliability coefficient of tangibility was 0.739. Reliability was measured with five items, and the Cronbach's alpha for the reliability measure was 0.615. Responsiveness was measured with four items, and the reliability coefficient was 0.684. Assurance was measured with four items with a reliability coefficient of 0.712. Empathy was measured with five items with a reliability coefficient of 0.814. Customer satisfaction was measured with 10 items with a reliability coefficient of 0.712. Obstacles were measured with 16 items with a reliability coefficient of 0.798.
The indicators of all constructs were mentioned in Appendix A.
3.3. Demographics
Among the respondents, 287 (52.8%) were males, and 257 (47.2%) were females. Concerning education, 151 (27.8%) were having high-school diploma, 57 (10.5%) had a vocational diploma, 208 (38.2%) had undergraduate bachelor’s degree, 88 (16.2%) had professional degrees, such as Law, Chartered Accountancy, Company Secretary, and Cost Accountancy, and 40 (7.4%) did not disclose their educational status. As far as occupation is concerned, 95 (17.5%) were students, 157 (28.9%) were employed, 84 (15.4%) were owning their business, 53 (9.7%) were professionals in various fields, and 155 (28.5%) did not mention employment status.
4. Results
The descriptive statistics (means, standard deviations, and zero-order correlations) are mentioned in Table .
Table 2. Descriptive Statistics: Means, standard deviations, and zero-order correlations
A preliminary analysis of correlation among the variables reveals that correlations were less than 0.8, suggesting that multicollinearity is not a problem with the data (Tsui et al., Citation1997). We also checked for variance inflation factor (VIF) and found that VIF values were less than 5, suggesting multicollinearity is not a problem (Hair et al., Citation2016). We also assessed the common method bias by performing Harman’s single-factor analysis and found that a single factor accounted for 20.05% variance, thus vouching for the absence of common method bias (Podsakoff et al., Citation2003).
We also assessed the normality of the constructs and presented the results (skewness and kurtosis) in Appendix B.
4.1. Hypotheses testing
We conducted hierarchical regression to test the hypotheses and presented the results in Table .
Table 3. Results of hierarchical regression analysis of the effect of Service Quality Dimensions on Passenger Satisfaction
The first column in Table shows the regression results of the effect of control variables and service quality variables. The regression coefficient of tangibility (β = 0.288, p < 0.001), reliability (β = 0.525, p < .001), responsiveness (β = 0.155, p < .001), assurance (β = 0.062; p < .05), and empathy (β = —0.027; n.s.). The regression coefficient of obstacles was negative and significant (β = −0.838; p < .001). The regression model was significant [R2 = 0.697; Adj R2 = 0.692; F (9,534) = 136.59; p < .001]. These results support H1, H2, H3, H4, and H6.
Hypotheses 1a to 5a were about the “gender” as a moderator in the relationship between perception of service quality dimensions and passenger satisfaction. The results of moderation of gender were presented in Column 2 Table . The regression coefficients of interactive term tangibility x gender (β = 0.245; p < .01), and reliability x gender (β = —.306; p < .001) were significant. Other interactions (responsiveness and gender; assurance and gender; empathy and gender) were not significant as can be seen in column 2 of Table . These results support H1a and H2a and do not support H3a, H4a, and H5a.
The interaction plots are presented in Figures . As shown in Figure , at lower levels of tangibility, females were more satisfied than males. As the level of tangibility increased from low to high, males were more satisfied than females. There are significant differences in slopes, though the slopes were positive, the line for males increases faster than for females. As the tangibility increases, the gender differences are significant and hence support the moderating hypothesis H1a.
Figure 2. Gender as a moderator in the relationship between Tangibility and Passenger Satisfaction.
Figure 3. Gender as a moderator in the relationship between Reliability and Passenger Satisfaction.
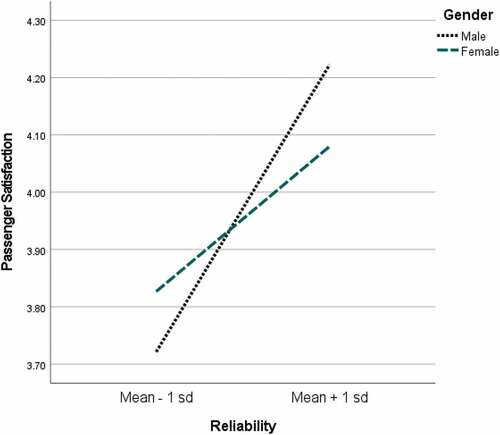
Figure depicts the moderation of gender in the relationship between responsiveness and passenger satisfaction. At lower levels of responsiveness, females were more satisfied than males, and as the level of responsiveness increased from low to high, males tended to get more satisfaction when compared to males. These results render support for H2a.
A summary of the results of the hypotheses testing is presented in Table .
Table 4. Summary of Hypotheses testing
5. Discussion
The objective of the present study is to empirically examine the impact of five dimensions of service quality on passenger satisfaction in Indian Railways. In India, Railways play a significant role in carrying passengers from one place to another. One of the fourth largest networks globally, it is expected that Railways satisfy the passengers’ requirements.
First, the results from this research indicate that tangibility is positively and significantly related to passenger satisfaction (Hypothesis 1), the finding consistent with the past studies in the literature (Boonitt & Rompho, Citation2012; Kaura et al., Citation2015; Ranjan et al., Citation2020). Second, the positive association between reliability and passenger satisfaction (Hypothesis 2) was supported in this study, corroborating the results from past studies (Han et al., Citation2021; Lee & Moghavvemi, Citation2015; Priyadharshini & Muthusamy, Citation2017). Third, the results supported the positive and significant relationship between responsiveness and passenger satisfaction (Hypothesis 3), the findings add results from the past studies in the literature (Kumar & Jain, Citation2017; Ranjan et al., Citation2020; Slack & Singh, Citation2020). Fourth, this research empirically supported the positive association between assurance and passenger satisfaction (Hypothesis 4), which is consistent with studies from the literature (Mageshwarii & Vasanthi, Citation2020; Vishnuvarthani & Selvaraj, Citation2012). Fifth, the results did not support the positive relationship between empathy and passenger satisfaction (Hypothesis 5), which is contrary to the studies in the literature (Anantha Lakshmi & Murugesan, Citation2018; Hundal & Kumar, Citation2015). Sixth, the results indicate that the obstacles are negatively related to passenger satisfaction (Hypothesis 6), thus supporting scant research from the literature (Johnson, Citation2019; Makesh & Mathankumar, Citation2018).
Seventh, with regard to moderation effects, the results reveal that gender moderates the relationship between tangibility and reliability dimensions of service quality. Males are more satisfied than females with regard to tangibility and reliability when compared to females. This is expected because women tend to complain when their expectations are not met. The literature on gender provides evidence that women prefer more tangibility and reliability, and they would not like to travel when the services are not reliable. Moreover, the tangibility dimension is very important as women give more preference with what are immediately observable.
To sum, the results reveal that the “tangibility,” “reliability,” and “responsiveness,” and “assurance” dimensions were positively and significantly related to passenger satisfaction out of five dimensions. This is consistent with the findings from the previous studies (Agarwal, Citation2008; Gandhimathi & Saravanan, Citation2013; Vishnuvarthani & Selvaraj, Citation2012). On the other hand, the results indicate that empathy was not related to passenger satisfaction, which is contrary to the findings from other studies in the literature.
5.1. Contributions to literature and practice
The present study contributes to the literature on service quality and customer satisfaction, especially in India’s significant service sectors (Indian Railways). First, this study is expected to contribute to the growing body of service quality in the marketing area. At the same time, most of the studies on service quality concerning Indian Railways were concerned with the impact of demographic characteristics on passenger satisfaction, a relatively small number of studies focused on testing the SERVQUAL model comprehensively. The results indicate that all five service quality dimensions were not associated with customer satisfaction. These results were consistent with the previous research findings on service quality in Indian Railways, conducted in various parts of the country (see, Table ).
Second, the results from the study suggest the administration of Indian Railways should focus on improving quality of service to improve empathy. As the passengers were not happy with the empathy dimension, it is suggested that employees in Indian Railways need to undergo training to attend to the customers timely and satisfactorily. Third, though, to some extent, Indian Railways enjoy the monopoly of long-distance traveling, the emerging competition from air transportation and use of personal transport may hinder the progress of rail transportation of customers. In the last decade, air travel prices have been substantially reduced, thus motivating middle-income and low-income people to substitute air transportation. As a result, the rush for rail travel is slowly getting reduced. However, there is a constant demand for rail transportation during the festive seasons and vacations, and Indian Railways offers special trains and adds additional compartments to meet excess demand. It is challenging to control all the service quality dimensions in a thickly populated country like India. Despite the inconvenience and low level of satisfaction, customers continue to avail themselves of rail transportation because of the lack of other long-distance travel services. Introduction of luxury coach buses (road transportation) to cover half-a-day journal is available. Still, customers who travel in these luxury coaches feel inconvenienced because of the lack of washrooms inside the coaches. Since the level of inconvenience in bus travel is less than the level of inconvenience and satisfaction in rail travel, customers prefer to avail themselves of rail transportation.
Fourth, a notable contribution of the present study to the literature on service quality stems from examining gender differences in passenger satisfaction. In this study, gender differences were examined as a moderating variable that changes the strength of the relationship between service quality dimensions and passenger satisfaction. The findings thus contribute to the literature on gender. As women are different in perceiving and assessing the quality, it is crucial to consider that tangibility and reliability should be increased to cater to the needs of women, as men are satisfied with the current level of both dimensions, as can be seen in Figures .
To improve service quality Indian Railways embark upon innovation periodically to cater to the changing requirements of passengers. The position where Indian Railways stands now compared to two decades back, constant improvements in services have been a hallmark. For example, recently the Railway Board made a strategic decision to implement 20 innovations to make travel safe and improve passenger comfort. These include a bell warning to alert the passengers minutes before a train departs, a vehicular system for ultrasonic flaw detection of rails, development of natural water coolers with zero electric consumption, a system to monitor real-time CCTV footage onboard trains, installation of air-quality equipment, and so on. In addition, the present global COVID pandemic has created a situation whereby passengers prefer going contactless. Therefore, Northern Railway has developed a system through which unreserved tickets are issued through mobile apps (Singh, Citation2020).
5.2. Suggestions for future research
The present study offers several avenues for future research. We documented in this research the importance of gender differences in assessing the relationship between service quality dimensions and customer satisfaction; future researchers can focus on some other moderating variables, which may include demographics (e.g., age, income, experience, size of the family members, and educational qualifications) or organizational variables (e.g., trust, justice and environmental disturbances) that may influence the effect of service quality on customer satisfaction. It is also suggested to have a more significant sample including southern, northern, western, and central zones of Indian Railways to see any significant differences in service quality. Even within India, there are different cultures (the culture in the north is different from the culture in the south , and culture in the West is different from the culture in the East).
5.3. Limitations
The findings from the present study should be interpreted in light of some of the limitations. First, social desirability bias may be a problem where some respondents favorably provide answers, thus showing some bias. However, we do not expect social desirability bias in this research because customers were not the Railways employees and hence not afraid of giving correct information.
Moreover, the researchers have taken personal care to explain to the customers that the purpose of the survey is to examine whether the customers are happy with the service quality with Indian Railways. Second, the sample was confined to the southern region of Indian Railways, and hence the findings may not be generalizable across other areas in India. However, the Indian Railways come under the centralized control of the Government of India, managed by the Ministry of Railways; administrators may consider the suggestions from customers and academicians to improve the working conditions for passengers’ satisfaction.
The third important limitation of this study is the use of 22-item measure to capture service quality instead of 44-item measure advocated by Parasuraman et al. (Citation1988). However, several researchers in the recent past have used short measure as the indicator show high level of reliability. Fourth, we added two new variables in addition to the service quality dimensions in this research: obstacles and gender. While the negative impact of obstacles on passenger satisfaction was investigated, gender as a moderator in the relationship between service quality dimensions and passenger satisfaction was examined. Thus, this research adds to the growing body of the literature on service quality. Fifth, in addition to gender, it is also likely that income may moderate the relationship between service quality dimensions and passenger satisfaction, which we did not consider in this study. Future researchers may focus on the variables we did not include in this research.
5.4. Conclusion
The conceptual model developed and tested in this research provides a bird’s eye view of passenger satisfaction with the service quality provided by Indian Railways. The data collected from 544 passengers from southern India revealed that four out of five dimensions of service quality are significantly related to passenger satisfaction. This study also revealed gender differences in passenger satisfaction concerning two of the dimensions: tangibility and reliability. As service quality is an essential driver of customer satisfaction, the suggestions from the present study would help the administrators of Indian Railways identify the problems associated with service quality and take necessary corrective actions. It is a real challenge for the administrators to improve the quality of services for passengers’ satisfaction. Despite some problems, Indian Railways remains one of the vital components of public transportation, serving the needs of several millions of passengers every day.
Disclosure statement
No potential conflict of interest was reported by the author(s).
Additional information
Funding
References
- Agarwal, R. (2008). Public Transportation and Customer Satisfaction: The case of Indian Railways. Global Business Review, 9(2), 257–21. https://doi.org/10.1177/097215090800900206
- Agunloye, O. O., & Oduwaye, L. (2011). Factors influencing the quality of rail transport services in metropolitan Lagos. Journal of Geography and Regional Planning, 4(2), 98–103.
- Alnawas, I., & Hemsley-Brown, J. (2019). Market orientation and hotel performance: Investigating the role of high-order marketing capabilities. International Journal of Contemporary Hospitality Management, 31(4), 1885–1905. https://doi.org/10.1108/IJCHM-07-2018-0564
- Anantha Lakshmi, M., & Murugesan, G. (2018). Customer satisfaction on service quality in Indian Railway with reference to Virudhunagar. International Journal of Emerging Technologies and Innovative Research, 5(8), 701–705.
- Anuradha, J. (2014). A Study on Passenger’s satisfaction towards railway services in Erode junction. International Journal of Management, 5(8), 10–15.
- Awasthia, A., Chauhanb, S. S., Omranic, H., & Panahid, A. (2011). A hybrid approach based on SERVQUAL and fuzzy TOPSIS for evaluating transportation service quality. Computers and Industrial Engineering, 61(3), 637–646. https://doi.org/10.1016/j.cie.2011.04.019
- Bahadur, W., Aziz, S., & Zulfiqar, S. (2018). Effect of employee empathy on customer satisfaction and loyalty during employee–customer interactions: The mediating role of customer affective commitment and perceived service quality. Cogent Business and Management, 5, 1491780. https://doi.org/10.1080/23311975.2018.1491780
- Balakrishnan, K. P. (2012). A study on service quality perception of railway passengers of Southern Railway. International Journal of Management Research, 2(2), 105–110.
- Belás, J., & Gabčová, L. (2016). The relationship among customer satisfaction, loyalty and financial performance of commercial banks. E&M Economics and Management, 19(1), 132–147. https://doi.org/10.15240/tul/001/2016-1-010
- Bharathi, N. (2010). Passenger’s Attitude and Satisfaction in Railways special reference to Coimbatore region. International Journal of Research in Commerce and Management, 1(6), 121–127.
- Boonitt, S., & Rompho, N. (2012). Measuring Service Quality Dimensions: An Empirical Analysis of Thai Hotel Industry. International Journal of Business Administration, 3(5), 52–63. http://dx.doi.org/10.5430/ijba.v3n5p52
- Cameran, M., Moizer, P., & Pettinicchio, A. (2010). Customer satisfaction, corporate image, and service quality in professional services. Service Industries Journal, 30(3), 421–435. https://doi.org/10.1080/02642060802236111
- Cavana, R. Y., Corbett, L. M., & Lo, Y. L. (2007). Developing zones of tolerance for managing customer rail service quality. International Journal of Quality & Reliability Management, 24(1), 7–31. https://doi.org/10.1108/02656710710720303
- Chang, M., Jang, H.-B., Li, Y.-M., & Kim, D. (2017). The relationship between the efficiency, service quality and customer satisfaction for state-owned commercial banks in China. Sustainability, 9, 2163. https://doi.org/10.3390/su9122163
- Darley, W. K., & Smith, R. E. (1995). Gender differences in information processing strategies: An empirical test of the selectivity model in advertising response. Journal of Advertising, 24(1), 41–56. https://doi.org/10.1080/00913367.1995.10673467
- Davis, M. M., Acquilano, N. J., & Chase, R. B. (2003). Fundamentals of operations management. McGraw-Hill, Boston. USA.
- Devi Prasad, M., & Raja Shekhar, B. (2010). Impact of Service Quality Management (SQM) Practices on Indian Railways- A Study of South-Central Railways. International Journal of Business and Management, 5(9), 139–146.
- Fida, B. A., Ahmed, U., Al-Balushi, Y., & Singh, D. (2020). Impact of Service Quality on Customer Loyalty and Customer Satisfaction in Islamic Banks in the Sultanate of Oman. SAGE Open, 1–10. https://doi.org/10.1177/2158244020919517
- Fitzsimmons, J. A., & Fitzsimmons, M. J. (2014). Service management: Operations, strategy, and information technology (8th) ed.). McGraw-Hill Book.
- Gandhimathi, S., & Saravanan, S. (2013). A Study on Passenger’s Satisfaction towards Railway Services in Coimbatore Junction. International Journal of Applied Research and Studies, 2(11), 1–6.
- Geetika, S. N., & Nandan, S. (2010). Determinants of Customer Satisfaction on Service Quality: A Study of Railway platforms. Journal of Public Transportation, 13(1), 97–113. https://doi.org/10.5038/2375-0901.13.1.6
- Hair, J. F., Hult, G. T. M., Ringle, C., & Sarstedt, M. (2016). A primer on partial least squares structural equation modelling (PLS-SEM). Sage Publications.
- Han, J., Zuo, Y., Law, R., Chen, S., & Zhang, M. (2021). Service Quality in Tourism Public Health: Trust, Satisfaction, and Loyalty. Frontiers in Psychology, 12, 279. https://doi.org/10.3389/fpsyg.2021.731279
- Hundal, B. K., & Kumar, V. (2015). Assessing the Service Quality of Northern Railway by using SERVQUAL Model. Pacific Business Review International, 8(2), 82–88.
- Iacobucci, D., & Ostrom, A. (1993). Gender differences in the impact of core and relational aspects of services on the evaluation of service encounters. Journal of Consumer Psychology, 2(3), 257–286. https://doi.org/10.1016/S1057-7408(08)80017-4
- Indian Railways Yearbook 2019-2020. http://indianrailways.gov.in/railwayboard/uploads/directorate/stat_econ/Annual-Reports-2019-2020/Year-Book-2019-20-English_Final_Web.pdf
- Ismail, A., Ridzuan, A. A., Rose, N. I. R., Abdullah, M. M. B., Rahman, M. S., & Francis, S. K. (2013). Examining the relationship between service quality and customer satisfaction in military peacekeeping missions. Journal of Industrial Engineering and Management, 6(2), 654–667. http://dx.doi.org/10.3926/jiem.548
- Johnson, M. (2019). A Study on Passengers’ Satisfaction towards Railway Services in Kerala. International Journal of Business and Management Invention, 8(3), 19–23.
- Juwaheer, T. D. (2011). Gender Bias in Hotel Guests’ Perceptions of Service Quality: An Empirical Investigation of Hotels in Mauritius. E-Review of Tourism Research, 9(5), 164–189.
- Karatepe, O. M. (2011). Service Quality, Customer Satisfaction and Loyalty: The Moderating Role of Gender. Journal of Business Economics and Management, 12(2), 278–300. https://doi.org/10.3846/16111699.2011.573308
- Karatepe, O. M., Yavas, U., & Babakus, E. (2005). Measuring service quality of banks: Scale development and validation. Journal of Retailing and Consumer Services, 12(5), 373–383. https://doi.org/10.1016/j.jretconser.2005.01.001
- Kaura, V., Durga Prasad, C., & Sharma, S. (2015). Service quality, service convenience, price and fairness, customer loyalty, and the mediating role of customer satisfaction. International Journal of Bank Marketing, 33(4), 404–422. https://doi.org/10.1108/IJBM-04-2014-0048
- Kumar, V., & Jain, P. (2017). A study on passengers’ satisfaction towards railway service concerning Coimbatore junction. International Journal of Management and Commerce Innovations, 2(2), 578–582.
- Kwok, S. Y., Jusoh, A., & Khalifah, Z. (2016). The influence of Service Quality on Satisfaction: Does gender really matter? Intangible Capital, 12(2), 444–450. https://doi.org/10.3926/ic.673
- Lee, S., & Moghavvemi, S. (2015). The dimension of service quality and its impact on customer satisfaction, trust, and loyalty: A case of Malaysian banks. Asian Journal of Business and Accounting, 8(2), 91–121.
- Liou, Y., & Tsao, W. -Y. (2010). A Study on the Service Model of Public Transportation: Taiwan Railways vs Taiwan High Speed Rail Corporation. Service Science Journal, 1(2), 32–42.
- Mageshwarii, G. V., & Vasanthi, S. (2020). A Study on Service Quality Gap Analysis In Indian Railways Using Pzb Service Quality Model. International Journal of Scientific & Technology Research, 9(1), 2848–2851.
- Maheswari, B., & Dinesh Kumar, G. R. (2016). A study on Passenger Satisfaction of Amenities provided by Southern Railways with special reference to Coimbatore Junction. International Journal of Applied Research, 2(1), 288–292.
- Makesh, N., & Mathankumar, K. (2018). A study of problems faced by the Indian Railways - A study with special reference to Madurai City. International Journal of Research in Social Sciences, 8(12), 344–352.
- Minh, N. H., Ha, N. T., Anh, P. C., & Matsui, Y. (2015). Service Quality and Customer Satisfaction: A Case Study of Hotel Industry in Vietnam. Asian Social Science, 11(10), 73–85.
- Narteh, B. (2018). Service quality and customer satisfaction in Ghanaian retail banks: The moderating role of price. International Journal of Bank Marketing, 36(1), 68–88. https://doi.org/10.1108/IJBM-08-2016-0118
- Parasuraman, A., Zeithaml, V. A., & Berry, L. L. (1985). A Conceptual Model of Service Quality and Its Implications for Future Research. Journal of Marketing, 49(Fall), 41–50. https://doi.org/10.1177/002224298504900403
- Parasuraman, A., Zeithaml, V. A., & Berry, L. L. (1988). SERVQUAL: A multiple-item scale for measuring consumer perceptions of service quality. Journal of Retailing, 64(1), 12–40.
- Peter, J. P., & Olson, J. C. (2010). Consumer Behaviour and Marketing Strategy (9th) ed.). McGraw-Hill Irwin.
- Podsakoff, P. M., MacKenzie, S. B., Podsakoff, N. P., & Lee, J.-Y. (2003). Common Method Biases in Behavioral Research: A Critical Review of the Literature and Recommended Remedies. Journal of Applied Psychology, 88(5), 879–903. https://doi.org/10.1037/0021-9010.88.5.879
- Priyadharshini, J., & Muthusamy, S. (2017). Service quality and passenger satisfaction of southern railways by ServQual model. International Journal of Trend in Research and Development, 3(6), 3–6.
- Rahaman, K. R., & Rahaman, A. (2009). Service Quality attributes affecting the satisfaction of Railway passengers of selective route in South Western part of Bangladesh. Theoretical and Empirical Researches in Urban Management, 3(12), 115–125.
- Rajaram, R. P. C. S. (2011). Service Gap Analysis of Indian Railways in Trivandrum and Ernakulam Districts. Journal of Social and Development Sciences, 2(1), 22–30. https://doi.org/10.22610/jsds.v2i1.649
- Ranjan, R. K., Thapar, N., Siddiqui, S. A., & Painoli, A. K. (2020). Assessing the Service Quality Attributes Affecting the Satisfaction of the Northern Railway Passengers: An Empirical Study. Journal of New Business Ventures, 1(1–2), 110–124. https://doi.org/10.1177/2632962X20961052
- Ren, L., Zhang, H. Q., & Ye, B. H. (2015). Understanding customer satisfaction with budget hotels through online comments: Evidence from home inns in China. Journal of Quality Assurance in Hospitality and Tourism, 16(1), 45–62. https://doi.org/10.1080/1528008X.2015.966299
- Ryan, M., Henley, N., & Soutar, G. (1998). Gender Differences in Tourism Destination Choice: Implications for Tourism Marketers. Paper presented at the Australian and New Zealand Marketing Conference, Dunedin, New Zealand.
- Saputra, A. D. (2010). Analysis of Train Customer Responses on Provided Service Case Study: Pt. Kereta Api Indonesia and Statens Järnvägar (SJ) AB, Sweden. Published Thesis
- Sathyanarayana, S., & Sreenath, S. S. (2017). The effects of individual dimensions of service quality in IRCTC by using ServQual model with special reference to South Western Railway. Asian Journal of Management Research, 7(3), 256–275.
- Shainesh, G., & Mathur, M. (2000). Service Quality Measurement: The Case of Railway Freight Services. Vikalpa, 25(3), 15–22. https://doi.org/10.1177/0256090920000303
- Sharma, P., Chen, I. S. N., & Luk, S. T. K. (2012). Gender and age as moderators in the service evaluation process. Journal of Services Marketing, 26(2), 102–114. https://doi.org/10.1108/08876041211215266
- Sharma, H., & Yadav, S. (2013). Service Quality Improvement-An Empirical Study of Indian Railways. Paripex- Indian Journal of Research, 2(3), 73–76.
- Singh, P. (2020). Amazing innovations by Indian Railways for passengers! Making train journeys safer, more comfortable – Details, Business News, https://www.zeebiz.com/indian-railways/news-amazing-innovations-by-indian-railways-for-passengers-making-train-journeys-safer-more-comfortable-details-131309
- Slack, N. J., & Singh, G. (2020). The effect of service quality on customer satisfaction and loyalty and the mediating role of customer satisfaction: Supermarkets in Fiji. The TQM Journal, 32(3), 543–558. https://doi.org/10.1108/TQM-07-2019-0187
- Sofyani, H., Riyadh, H. A., & Fahlevi, H. (2020). Improving service quality, accountability and transparency of local government: The intervening role of information technology governance. Cogent Business and Management, 7, 1735690. https://doi.org/10.1080/23311975.2020.1735690
- Srivastava, A., & Kumar, V. (2021). Hotel attributes and overall customer satisfaction: What did COVID-19 change? Tourism Management Perspectives, 40, 100867. https://doi.org/10.1016/j.tmp.2021.100867
- Sun, L. B., & Qu, H. (2011). Is there any gender effect on the relationship between service quality and word-of-mouth? Journal of Travel and Tourism Marketing, 28(2), 210–224. https://doi.org/10.1080/10548408.2011.546215
- Teeroovengadum, V. (2020). Service quality dimensions as predictors of customer satisfaction and loyalty in the banking industry: Moderating effects of gender. European Business Review, 1–19. https://doi.org/10.1108/EBR-10-2019-0270
- Tsui, A. S., Pearce, J. L., Porter, L. W., & Tripoli, A. M. (1997). Alternative Approaches to the Employee-Organization Relationship: Does Investment in Employees Pay off? The Academy of Management Journal, 45(5), 1089–1121.
- Vanniarajan, T., & Stephen, A. (2008). Railqual and passenger Satisfaction: An Empirical Study in Southern Railways. Asia-Pacific Journal of Management Research and Innovation, 4(1), 64–75.
- Vishnuvarthani, S., & Selvaraj, A. (2012). Factors Influencing the Passengers to Select Train Travel: A Study in Salem Division of Southern Railway. International Journal of Scientific and Research Publications, 2(10), 81–85.
- Wu, G., Liang, L., & Gursoy, D. (2021). Effects of the new COVID-19 normal on customer satisfaction: Can facemasks level off the playing field between average looking and attractive-looking employees? International Journal of Hospitality Management, 97, 102996. https://doi.org/10.1016/j.ijhm.2021.102996
- Wu, J., Lin, Y.-C., & Hsu, F.-S. (2014). An Empirical Analysis of synthesizing the effects of Service Quality, Perceived Value, Corporate Image and Customer Satisfaction on behavioural intentions in the transport industry: A Case of Taiwan high-speed rail. International Journal of Commerce, Business and Management, 3(2), 248–255.
- Yilmaz, V., Ari, E., & Gürbüz, H. (2018). Investigating the relationship between service quality dimensions, customer satisfaction and loyalty in Turkish banking sector: An application of structural equation model. International Journal of Bank Marketing, 36(3), 423–440. https://doi.org/10.1108/IJBM-02-2017-0037
- Zeithaml, V. A., Berry, L. L., & Parasuraman, A. (1988). Communication and control process in the delivery of service quality. Journal of Marketing, 52(1), 35–48. https://doi.org/10.1177/002224298805200203
- Zygiaris, S., Hameed, Z., Alsubaie, A. M., & Rehman, U. S. (2022). Service Quality and Customer Satisfaction in the Post Pandemic World: A Study of Saudi Auto Care Industry. Frontiers in Psychology, 13, 842141. https://doi.org/10.3389/fpsyg.2022.842141
Appendix
Appendix A. The indicators of various dimensions of service quality, passenger satisfaction, and obstacles
Appendix B. Skewness and Kurtosis of the constructs