
 ?Mathematical formulae have been encoded as MathML and are displayed in this HTML version using MathJax in order to improve their display. Uncheck the box to turn MathJax off. This feature requires Javascript. Click on a formula to zoom.
Abstract
This study examines the influence and importance of firm characteristics on the quality of financial statements of listed companies in Vietnam’s stock market from the audit point of view. We use regression models and machine learning algorithms to investigate data from 2225 observations of listed companies in the period 2014–2020. We find that business profitability, business size, and the size of the Board of Directors positively correlate with the quality of financial statements. In contrast, dividend policy, state ownership, and enterprise listing time have a negative relationship. Results show that the most critical factors affecting financial statement quality include profitability, profit after tax on total assets, state ownership, and enterprise size. This finding has practical implications for market participants and policymakers in improving financial reporting transparency and quality.
1. Introduction
Financial statement reporting is among the critical information standards that listed companies are required to prepare for legislative obligations (Diouf & Boiral, Citation2017), (Criado-Jiménez et al., Citation2008). Generally, a listed company acts as an information provider so that investors, who are considered the primary information recipients, can utilize the information provided for their decision-making processes. However, a gap remains between expectations and the reality of how financial reports are disclosed to meet users’ needs. The quality of financial statements depends on the quality of the creation, presentation, and disclosure process of listed companies, which is influenced by many internal and external factors (Van Van Beest et al., Citation2009). It is essential to prepare and provide financial reporting information at a high standard level because of its positive effect on the investment and financial decision-making processes of capital providers and other stakeholders, thus enhancing overall market efficiency (IASB, 2013).
Financial reporting quality refers to the quality of the information contained in financial reports, including note disclosures. High-quality reporting, which provides relevant and decision-useful information, objectively represents the economic reality of a company’s activities during its reporting period. Investors and stakeholders benefit from high-quality financial statement reporting by having greater confidence, improving liquidity, reducing capital costs, and building fair market prices (Kothari, Citation2000). Financial statements that are not clear and effective will adversely impact users’ interpretation of the current financial health of a company. This leads to auditors playing a critical role, ensuring that the accounting process correctly represents the company’s financial status (Kueppers & Sullivan, Citation2010).
The extant literature highlights different strands of concepts and measures of the quality of financial statements. Most studies measure the quality of financial statements indirectly, such as earnings management, financial restatement, and financial statement fraud (Schipper & Vincent, Citation2003), (Cohen et al., Citation2004). In these studies, the quality of financial statements only considers conventional financial information perspectives, while financial statement reports cover a broader range of information, including nonfinancial information, such as analysis reports of managers/executives, auditing reports, and others (Beest et al., Citation2009). Both financial and non-financial information play a vital role in the decision-making process of users of financial statements, particularly external stakeholders (e.g., investors and analysts).
The literature also shows that financial statements provide valuable information about financial health, firm performance, cash flows, and other additional information to assist users in their decision making (Epstein & Jermakowicz, Citation2008); (Mackenzie et al., Citation2012). The usefulness of information highly depends on the quality of earnings information (Ball and (Ball & Shivakumar, Citation2005). Information on profits and their components is important for stakeholders in measuring business performance and forecasting future cash flows (Shubita, Citation2021). Factors that might influence the quality of financial statement reporting include the quality of government apparatuses, human resource competencies, internal control systems, and information technology (Suwanda, Citation2015).
There is limited evidence on the quality of financial statement reporting from an audit point of view, with the main focus on the combination of financial statement fraud and audit reports to measure the quality of financial statements (Tang et al., Citation2016). Studies find that machine learning can significantly improve managerial accounting estimates (e.g., Ding et al., Citation2020). As such, machine learning tools have been used in earlier studies to predict the quality of accounting numbers (J. L. Perols et al., Citation2017). For example, (Bertomeu et al., Citation2021) used a machine learning algorithm to detect misstatements. The authors find that although accounting variables do not sufficiently detect misstatements, they become essential with suitable interactions with audit and market variables in detecting misstatements. To our knowledge, no previous studies on Vietnam have examined the quality of financial statements from an audit perspective using a machine learning algorithm.Footnote1
This study relies on the usefulness of accounting information to highlight the importance of financial statement reporting in assisting information users in making reasonable decisions (Gassen & Schwedler, Citation2010), (Hitz, Citation2007). Two key aspects are emphasized: users of financial statements and decision problems. Regarding the former, users of financial statements are primarily investors, managers, policymakers, and the public. The latter refers to the preparation of information that is in demand by users of financial statements. Although each group of users of financial statements (e.g., investors, policymakers, and business managers) has a demand for information, a thorough and correct information preparation will facilitate the decision-making process. However, conflicts often occur between the government and the community under financial market imperfections, mainly when government officials formulate policies regarding their benefits and concerns instead of looking out for their community’s best interests. One efficient way to mitigate this problem is to present financial reports transparently and accountably. As specified in the theory of decision usefulness of accounting information, preparing information for financial statement reporting must contain components that meet the needs of decision-makers and information users.Footnote2
Our study contributes to the literature in several respects, as we examine the quality of financial statements based on a new perspective that differs from previous studies. First, we form an audit opinion based on the misstatement of the audit process and the auditor’s opinion of the financial statements. Second, we determined the importance of these factors based on machine learning algorithms. The research results comprehensively and multidimensionally consider the factors affecting the quality of financial statements.
We use data from listed companies in Vietnam’s stock market from 2014 to 2020 with 2,225 observations. We collected data from pre-and post-audit reports of listed companies in nine industries, including real estate and Construction, Technology, Industry, Retail and Services, Consumer goods, Energy, Agriculture, Materials, and Health. Using regressions and a machine learning approach, we find that a firm’s profitability, size, and board size positively relate to the quality of its financial statements. Adversely, dividend policy, state ownership, and listing year negatively affect information reporting. We also demonstrate that the gradient-boosting algorithm exhibits the most effective self-reporting performance. We show that the most critical factor for the quality of financial statements is profitability, measured by the ratio of earnings after tax to total assets, state ownership, and firm size.
The objective of domestic and foreign research is to study the quality of financial statements from an auditing point of view. Very few studies follow a mixed approach (accounting and auditing) to measure the quality of financial statements (Tang et al., Citation2016). Meanwhile, in Vietnam, no studies have measured the quality of financial statements. At the same time, previous studies did not use machine learning techniques to determine the importance of these factors on the quality of financial statements. Therefore, the implementation of this study has many theoretical and practical applications.
The remainder of this paper is organized as follows. Section 2 presents the literature review. Section 3 outlines the study’s research methods and model. Section 4 presents the results and a discussion. Section 5 concludes.
2. Literature review
2.1. Research on measuring the quality of financial statements
The literature demonstrates several views on measuring the quality of financial statements.Footnote3
From an accounting perspective, the quality of financial statements can be measured based on the quality characteristics and quality of profits. First, the quality of financial statements was evaluated based on scales built on the quality characteristics of the Financial Accounting Standard Board, including the essential characteristics of Relevance and Reliability. The two secondary characteristics are Consistent and Comparable (Beest et al., Citation2009), (García Jara et al., Citation2011). In addition, the quality of financial statements can be measured through earnings such as accrual quality, earnings management, sustainability of profits, and predictability (Summers & Sweeney, Citation1998), (J. Perols, Citation2011).
From an audit point of view, studies rely on audit opinions and financial statement fraud or errors to assess the quality of financial statement information (Spathis et al., Citation2003), (Caramanis & Spathis, Citation2006; J. Perols, Citation2011). In addition, studies have used machine learning algorithms to measure financial statement fraud e.g., (Green & Choi, Citation1997), (Feroz et al., Citation2000); (J. Perols, Citation2011); (Sharma & Panigrahi, Citation2013).
Some studies predict audit reports with unqualified opinions (Pourheydari et al., Citation2012); (Saif et al., Citation2013); (Yaşar et al., Citation2015); (Fernández-Gámez et al., Citation2016); (Stanišić et al., Citation2019), (Sánchez-Serrano et al., Citation2020).
2.2. Factors affecting the quality of financial statements
Studies mostly focus on different aspects such as company characteristics, accounting methods, corporate governance, and internal control, including the board of directors, audit including business risk, type of audit firm, and the independence of the audit (Dechow et al., Citation2010). For example, Dechow et al. (Citation2010) review and discuss the causes of variation and consequences of various measures used as indications of “earnings quality,” including persistence, accruals, smoothness, timeliness, loss avoidance, investor responsiveness, and external indicators, such as restatements and SEC enforcement releases. No single conclusion is drawn as “quality” is contingent on the decision context. The authors highlight that the “quality” of earnings is subject to a firm’s fundamental performance.
(Qinghua et al., Citation2007) examine the relationship between audit committees, board characteristics, and financial statement quality in the Chinese stock market. The authors used the adjusted Jones model to measure the quality of listed companies’ financial statements based on the level of earnings management. The study finds no significant impacts of variables capturing board behavior characteristics, including the ratio of shares owned by the board, yearly board meeting frequency, the number of independent directors holding posts concurrently in the controlling shareholder’s company, and the quality of financial reporting. In particular, board meeting frequency has an abnormally negative effect on the quality of financial reporting.
(Anichebe, Citation2019) analyzed the relationship between financial statement fraud and corporate governance elements of agricultural listed companies in Nigeria. Data are collected from annual reports of agricultural firms listed on the Nigerian Stock Exchange during the financial years 2013–2017. Applying longitudinal design and binary logit regression methods, the authors find that corporate governance variables lead to the probability of financial statement fraud of 53%. The results show statistically positive impacts of audit committees, board independence, board members’ financial expertise, and firm size on the likelihood of financial statement fraud.
(Alves, Citation2014) examined the influence of board independence on financial reporting quality in Portugal. The author also analyzes the relationship between other factors, such as financial leverage, net cash flow, investment opportunities, type of audit firm, and firm size. Using ordinary least squares and two-stage least squares techniques, the study finds that only the type of audit firm does not affect the quality of financial statements; the other factors do.
(Van Van Beest et al., Citation2009) examined the quality of financial reporting in terms of fundamental and enhancing qualitative characteristics, including relevance and faithful representation, understandability, comparability, verifiability, and timeliness. Data are sourced from 231 annual reports of listed companies in the US, UK, and the Netherlands for the period 2005–2007. The authors confirm the validity and reliability of the compound measurement tool by using Krippendorff’s alpha and Cronbach’s alpha approaches to assess the quality of financial reporting information. In addition, (Dachi, Citation2019) examined the determinants of financial statement quality using information technology as a moderating variable in 28 Regional Apparatus Organizations of South Nias. Data were collected from 105 questionnaire samples and processed using SEM. The authors found no impact of human resource competence on the quality of financial statements, while they indicated a significant positive relationship between the internal control system and the quality of financial statements. It is noted that information technology has no real impact on the link between human resource competencies and the quality of financial statements. However, this approach might weaken the effect of the internal control system on the quality of financial statements in the South Nias Regency.
(Spathis et al., Citation2003) use client performance measures to identify pre-engagement factors associated with qualified audit reports in Greece by testing to what extent corporate performance measures can enhance the selection between a qualified or unqualified (clean) audit report. Data are sourced from the financial statements, auditors’ opinions, and financial statement notes of Greek companies that received a qualified audit report and those that received an unqualified audit report. A multi-criteria decision aid classification method (UTADIS—UTilités Additives Discriminates) is used to model the auditor’s qualification, which is then compared with other statistical techniques, such as discriminant and logit analysis. The results show that audit firms are more likely to be exposed to the risk of losing a client if they issue a qualification. However, failing to qualify causes the auditor to face potential lawsuits and lose its reputation. The results show that financial ratios and nonfinancial information, such as client litigation, affect qualification decisions, and the accuracy of the developed models in classifying the total sample is 80 percent of total sample.
In a similar vein of a research in Greek context, (Caramanis & Spathis, Citation2006) aim to analyse the impact of auditee and audit firm characteristics on audit qualification by testing whether combinations of financial and nonfinancial variables can be used to predict qualified and unqualified audit reports. Employing the data of 185 listed companies in the Athens stock market and applying OLS regression models, the authors find no effect of audit fees or the type of audit firm on the propensity for auditors to qualify their opinions. However, audit qualifications are statistically linked with financial metrics, such as the operating margin to total assets ratio and the current ratio. The accuracy of developed models in classifying the total sample was rated at 90% of total sample.
Machine learning methods in financial reporting quality research have also been used in some studies. (Bertomeu et al., Citation2021) emphasized the validity of the machine learning approach in detecting and interpreting patterns in ongoing accounting misstatements. The authors used a series of variables extracted from accounting, capital markets, governance, and auditing in the Audit Analytics Non-Reliance Restatement database to detect misstatements. The authors find that accounting variables do not contribute to detecting misstatements on their own; however, they play an essential role when they interact with audit and market variables. The authors also showed the differences between misstatements and irregularities through algorithm comparison and short-term predictions at risk of misstatements.
(Ding et al., Citation2020) analyze whether machine learning improves accounting estimates using data extracted from the US-based property and insurance companies’ annual reports from 1996 to 2007. This study found that machine learning can substantially improve managerial estimates by applying MAE and RMSE metrics to evaluate model performance. The authors show surprising findings that loss estimates generated by machine learning are more accurate than managers’ actual estimates of financial reports in four out of the five insurance lines examined. This study discusses how accounting estimates generated by machine learning have multiple uses in practice, particularly in enhancing the use of financial information by stakeholders.
(J. Perols, Citation2011) analyzed the differences in the performance of six popular statistical and machine learning models in detecting financial statement fraud. Under various assumptions of misclassification costs and ratios of fraud firms to non-fraud firms, the author finds a better performance of logistic regression and support vector machines, as opposed to an artificial neural network, bagging, C4.5, and stacking. Results also highlight the diversity in predictors used across the classification algorithms: the study uses 6 out of 42 examined predictors selected by different classification algorithms consistently, including auditor turnover, total discretionary accruals, Big 4 auditor, accounts receivable, meeting or beating analyst forecasts, and unexpected employee productivity. This study contributes to the literature on financial statement fraud and discusses implications for practitioners and regulators in improving fraud risk models.
(Pourheydari et al., Citation2012) used data-mining methods with a focus on artificial neural networks to develop models for identifying qualified audit opinions. The four data mining classification techniques used in their study include the multi-layer perceptron neural network (MLP), probabilistic neural network (PNN), radial basic function network (RBF), and logistic regression (LR). Both qualitative and quantitative variables are explored, leading to the result that the probabilistic neural network (PNN) is the most balanced model for identifying the type of auditor’s opinion. As opposed to others, this technique also has a large amount of error in identifying unqualified (clean) and qualified reports. The radial basic function network, as compared to the remaining techniques, appears to show the highest performance level in identifying qualified opinions, while logistic regression returns the poorest performance. Research implications are discussed with insights into internal and external auditors and the company’s decision makers. Using publicly available information, (Feroz et al., Citation2000) examine an artificial neural network (ANN) approach to predict SEC investigation targets due to its association with substantial losses in equity value. Using the adaptive learning processes to determine essential factors in predicting targets, the ANNs return results that classify the membership in target (investigated) versus control (non-investigated) firms with an average accuracy of 81%. The results show that the participants in financial reporting frauds have incentives to appear prosperous because of high profitability and that the ANN application is less likely to be affected by accounting manipulations. This study confirms that the value of red flags along with non-financial red flags remains a predictive value.
(Sánchez-Serrano et al., Citation2020) aimed to provide a new model for predicting the audit opinion of consolidated financial statements by analyzing the variables that affect the probability of obtaining a qualified opinion. The authors applied an artificial neural network technique, the multilayer perceptron (MLP), to a sample of Spanish companies. Results show that the developed method accurately predicted the audit opinions above 86%. Furthermore, the study emphasizes essential differences in the most significant variables representing audit opinion prediction for individual accounts. The variables referring to industry, group size, auditors, and board members were converted into the main explanatory parameters of the prediction when using consolidated financial statements.
Many studies have examined the factors affecting the quality of financial statements. The quality of financial statements has also been measured in different ways; each study often focuses on one or several groups of factors on the Board of Directors, company characteristics, and heterogeneous results. Based on the overview, research shows that legal regulations, the business environment, and stock market development have not been completed in a developing economy, so studying the factors affecting the quality of financial statements makes sense.
3. 3 . Research methods
3.1. Measuring the quality of financial statements
Based on DeFond and Zhang (Citation2014), we measure the quality of financial statements using two criteria:
(1) Material misstatements expressed in the calculation of the difference in profits before and after the audit
(2) Communicating an auditor’s opinion and expressing an audit opinion.
Both these factors are expressed through the auditor’s audit opinion (Spathis et al., Citation2003), the approval of the audit report, and the irregularity/fraud situation in the financial statements to assess the quality of financial statement information. Based on these studies, if the financial statements with the audited signature are not entirely accepted, the quality of the financial statements will be low, and the more significant the difference in profit before and after the audit, the lower the quality of the financial statements. We build the matrix in Table to measure the quality of financial statements based on the audit outputs.
Table 1. Financial reporting quality measurement matrix
Table shows that the smaller the financial statements, the lower their quality of the financial statements. Quality is the lowest if financial statements have a price of 1. The quality is the highest if it is equal to 5.
3.2. Assess the importance of factors to the quality of financial statements
To assess the importance of corporate characteristics on the quality of financial statements, we followed the following steps:
Step 1: Build a regression model and evaluate the impact of the factors on the quality of financial statements.
To investigate the relationship between the quality of financial statements (FRQ) and other variables, we used a multivariate regression of the baseline model (1):
Table presents the independent variables of the model.
Table 2. Description of variables
Initially, we used the OLS method. However, the research data is panel data, so we continue to use the Fixed Effect and Random Effect regression methods to estimate the influence of factors on the quality of financial statements. On the basis of Hausman test results, we choose which method gives better results, and at the same time check the model’s defects as self-variable variance and autocorrelation. From there, we find a way to fix the model by using the GLS method.
Step 2: Machine learning algorithms are used to evaluate the importance of the factors in the quality of financial statements.
The objective of the study, in addition to determining the influence of factors on FRQ, we also consider the importance of factors to FRQ. To achieve the research goal, the regression method is not enough, so we use ML algorithms to consider the importance of the factors to the FRQ. When using ML, we take a comprehensive look by using 3 approaches which are (i) Coefficients as Feature Importance, (ii) Tree-Based Feature Importance and (iii) Permutation Feature Importance.
3.3. A. Algorithms
3.3.1. Linear models
Linear Regression: As first linear model, linear regression with the usual least-squares method was implemented. The aim was to minimize the sum of squares between the true and estimated values by fitting the linear model with the coefficients (Pedregosa et al., Citation2011).
Ridge regression and Lasso regression are two regression models that apply regularization techniques to avoid overfitting. Overfit is a phenomenon in which the model fits well on the training dataset but does not predict well on the test data. This is often the case when training machine-learning models. This phenomenon has a negative influence and makes the model inapplicable because the predictions are incorrect when applied in practice. There are several causes of overfitting. One of the common reasons is that the training dataset and forecast data have different distributions, which leads to the rules learned in the training data not being valid in the prediction data. Alternatively, it can also be from the model side that there are too many parameters; therefore, its data representation is not representative. Regularization avoids overfitting by adding a calibration component to the loss function. Usually, this component is the standard norm of first—or second-order coefficients. In the case of quadratic regression, we call it ridge regression; in the case of degree one, it is called lasso regression.
For these regressions, we need to refine coefficient α to find the best coefficient for each dataset. In the case of severely overfitting data, it is necessary to reduce overfitting by increasing the effect of the regularization term by increasing coefficient α. If the model does not overfitting, then α can be chosen to be close to 0. In the case α = 0, the regression equation is equivalent to multivariable linear regression.
Elastic-Net: Elastic-Net (Zou & Hastie, Citation2005)was used to add explanatory power. This is a continuation of the linear regression models trained with Lasso’s L1 and Ridge’s L2 penalty. Combining the penalties of both methods in one model produces a regular, competitive model in which the weight of the parameter is nonzero (Pedregosa et al., Citation2011).
3.3.2. Decision tree
Decision Tree: The decision tree is a classification model introduced by (Belson, Citation1959) and is widely used in many fields. After introducing the machine learning method system, the decision tree was further developed with the C4.5 algorithm by (J Ross Quinlan, Citation1996)and the ID3 algorithm by (J. Ross Quinlan, Citation1986). A Decision Tree is a structured classification tree that classifies objects based on a sequence of rules. Independent variables and attributes can be of different types, such as binary, nominal, ordinal, and quantitative data. Each variable’s information weight (entropy) is calculated to determine which variable to use the classification first; the higher the information value, the more categorical the variable.
Random Forest: Random Forest (random forest) is an attribute classification method developed by Leo Breiman at the University of California, Berkeley. Breiman is also a co-author of the Classification and Regression Trees (CART) method, rated as one of the ten data mining methods. In a random forest, a significant improvement in the classification accuracy results from the growth of a set of trees, each of which “votes” for the most popular class. Typically, random vectors are generated to develop these sets of trees, which govern the growth of each tree term in the aforementioned sets. For the kth tree in the set of trees, a random vector Vk is generated, independent of the previously generated vectors V1, V2, …, Vk-1; however, the distribution of the vectors is similar. A tree is grown based on the training set and the resulting vector Vk is a subclass h(x, Vk), where x is the input vector. After many trees are created, they “vote” for the most popular class.
AdaBoost: Boosting is a technique of sequentially combining machine learning algorithms on a population of sample spaces, then aggregating different classification results to obtain an effective classifier. An efficient boosting algorithm is AdaBoost (Adaptive Boosting), which uses error allocation weights assigned to each sample, as shown. The original algorithm allocates equivalent weights to each training sample. In each iteration, the algorithm performs: (i) training the sample using a weak classifier; (ii) checking whether the classification results for that training sample are correct; (iii) recalculating the error weight distribution on the samples in the direction of increasing the error weight on misclassified samples and decreasing the error weight on correctly classified samples. After completing the loop, the algorithm synthesizes the member classifiers into a composite classifier
Gradient Boosting: Gradient Boost is a synthesis algorithm that uses boosting methods to develop an advanced prediction engine. In many ways, Gradient Boost is similar to AdaBoost, but with a few key differences. Unlike AdaBoost, which builds decision trees, Gradient Boost builds trees that typically have 8–32 leaves. Gradient Boost views the boosting problem as an optimization problem, where it uses a loss function and attempts to minimize the error. Therefore, it is called a gradient boost because it is inspired by gradient descent. Finally, the tree was used to predict the residuals of the samples (prediction minus reality). Gradient Boost starts by building a tree to fit the data, and subsequent trees are built to reduce residuals (errors). This is done by focusing on areas where existing learners are underperforming, similar to AdaBoost.
3.3.3. SVM and KNN models
The remainder of the two applied models are grouped. Although they are not identical in the former, they use the same method to evaluate the relationship between financial ratios and stock returns.
Support Vector Machine (SVM): SVM is a binary classification algorithm. It uses the input data and classifies them into two classes. The SVM algorithm builds an SVM model to classify the other examples into two categories. The support vector machine (SVM) builds a hyperplane to classify the dataset into two separate classes. To do this, the SVM constructs a hyperplane or a set of hyperplanes in a multidimensional or infinite-dimensional space, which can be used for classification, regression, or other tasks. For the best classification, it is necessary to determine the optimal hyperplane located as far away from the data points of all classes as possible, because, in general, the larger the margin, the greater the generalization error of the algorithm.
K-Nearest Neighbors (kNN): The K-Nearest Neighbors algorithm (K-NN) is commonly used in the field of Data Mining. K-NN is a method to classify objects based on the closest distance between the object to be classified (query point) and all objects in the Training Data. An object is classified based on its K-neighbors. K is a positive integer that is determined before executing the algorithm. The Euclidean distance is often used to calculate the distance between objects. This simple algorithm can solve the regression problems proposed by (Altman, Citation1992). The nearest neighbor method predicts the output using k training data.
3.4. B. The method of assessing the importance of the factors
Assigning scores to the input features in a predictive model is called feature importance. Feature scores are an essential part of predictive modeling because they can be used to enhance the performance of the model and gain insight into the dataset and the model. The relative scores provided can be used to determine the features that are most relevant to the study. There are several types of feature scores in these techniques. Those that are simple to calculate are statistical correlation scores, such as Pearson’s correlation and Spearman’s rank for linear and nonlinear correlation, respectively.
Three types of more advanced feature importance scores are also implemented from the model coefficients as part of the linear model, decision tree-based model, and permutation importance, which are described in (Pedregosa et al., Citation2011). The three essential properties are described below:
Coefficients as Feature Importance: After fitting a linear machine-learning model to the dataset, the coefficient of each input variable can be retrieved and stated as a feature importance score. This comparison is possible because the dataset is normalized, and the variables have the same scale. This approach was applied to linear regression and elastic net models for feature-critical-point retrieval.
Tree-Based Feature Importance: Decision tree algorithms, such as the CART algorithm implemented in this study, provide sci-kit-learning implementations of feature importance reduction-based feature reduction. This was used to select the split points. This approach was adopted for the Decision Tree model and all tree-based aggregation methods, such as Random Forest, Gradient Boosting, and AdaBoost.
Permutation Feature Importance: This technique computes the relative importance score independent of the model used. After fitting a model to the dataset, a prediction was made, which was repeated five times for each feature in the dataset, resulting in an average significance score for each top feature. This technique is suitable for models that do not provide original feature criticality, such as the k-nearest Neighbors and SVM in this study. The essential characteristics are identified as follows.
F: absolute value of the relative importance score of the feature generated by the model.
W: normalized weight value based on the model’s predictability
m: number of models
n: number of factors (n = 11, in this study)
4. Data
Our study investigates the influence of the Board of Directors on the quality of the financial statements of companies listed on the Vietnam Stock Exchange in 2014–2020 with 2,225 observations. Data were collected from the financial statements before and after auditing from the Vietstock database. Table presents the data by year and industry.
Table 3. Data statistics
5. 5 . Empirical results and discussion
5.1. Financial reporting quality measurement results
As illustrated in Figure , the difference in profit after tax was less than 1%, accounting for 59.7%. The number of companies with an insignificant difference in profit after tax from 1% to 5% accounted for 19.5%. Significantly, the number of companies with a difference in profit after tax from 50% to-100% and over 100% are 2.8% and 2.3%, respectively.
Figure 1. Summary of the difference in profit after tax pre—and post-audit.
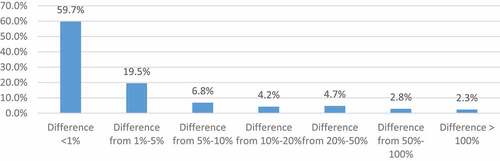
Among 2,225 observations, 1,420 observations have a difference in profit after tax pre—and post—audit, accounting for 63.8%. Table shows that the difference in profit before and after the audit tends to decrease more, with a small percentage.
Table 4. Difference in profit-after-tax before and after an audit by trend
Table shows the number of qualified opinions has 1,853 observations, accounting for (83.28%, of which 251 audit reports have strong opinions with a rate of 11.28%); (financial statements except for 5.3%). The audit opinion rejected was 0.09%, and there is only one financial statement had a negative opinion, accounting for 0.04%.
Table 5. Summary of audit opinions on research data
When measuring the quality of financial statements from an audit perspective, we rely on two aspects of audit results. First, we use the difference in profit before and after auditing based on the difference in profit after tax, as presented in Figure . The audit results for the financial statements are presented in Table , and a summary of the financial statements is presented in Table . Based on the audit results, the audit opinion on the financial statements and the difference in profit before and after the audit (measurements are presented in Table ), Table determines the quality of the financial statements of the enterprise, with level 5 showing financial reports of good quality and level 1 showing a financial report of poor quality.
Table 6. Summary of the quality of financial statements of enterprises according to survey data
5.2. Regression model results and consider the importance of independent variables
Table reports the descriptive statistics of variables used in the baseline model. The FRQ variable has a mean value of 4.35, with a standard deviation of 1.13. The firm’s profitability is 6.3% on average. While the average rates of foreign ownership and state ownership are 13.45% and 67.15%, respectively, the average number of members of the Board of Directors is 5.71. The proportion of independent non-executive members of the Board of Directors is 68.2%, the lowest is 20%, and the highest is 100%. On average, 21.92 % of enterprises have a Chairman of the Board of Directors cum General Director, enterprises with members of the Board of Directors who are significant shareholders account for 9.8%, and the average listing time of enterprises is 9.5 years.
Table 7. Descriptive statistics
Figure shows the correlation coefficients between the variables. In general, none of the values between the paired variables was significantly high, thereby alleviating the concern of multicollinearity in our model.
Figure 2. Matrix of autocorrelation.
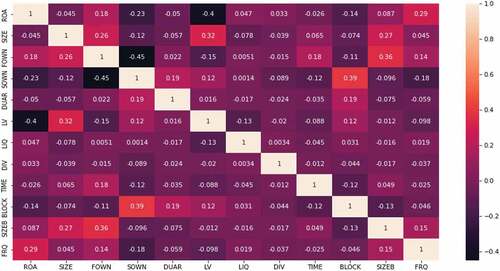
Table shows the regression results of our baseline models using OLS, FEM, REM and GLS in Columns [1], [2], [3], and [4], respectively. The results show that profitability (ROA), the size of the board of directors (SIZEB), and concentration of ownership (BLOCK) have dimensional and statistically significant effects on the quality of financial statements. Our findings are consistent with studies of (Xie et al., Citation2003), (Alves, Citation2014), (Abed et al., Citation2012), (Chalaki et al., Citation2012).
Table 8. Regression results
We find that policies on dividend payout ratio (DIV), state ownership rate (SOWN), and listing time of enterprises have a negative and significant influence on the quality of financial statements. Our findings are similar to those of (Soliman & Ragab, Citation2014), (H. N. H. n.d.ang et al., Citation2019), Hoang et al., Citation2019, (Van et al., Citation2019), Hung et al., Citation2018, (Van Khanh & Hung, Citation2020), (Chalaki et al., Citation2012).
Next, we use the Linear Regression, Lasso, Ridge, and ElasticNet algorithms to determine the coefficients of each financial indicator, as presented in Table . Based on each financial indicator’s Root Mean Squared Error coefficient, we determine the F index (fused) of the regression coefficient.
Table 9. Coefficients as feature importance
As shown in Figure , the most crucial factor is return on assets (ROA), with a value of 0.281, followed by state ownership (SOWN), and the size of the board of directors (SIZEB) with values of 0.140 and 0.119, respectively. The three financial ratios with the lowest level of importance are financial leverage (LV), short-term liquidity (LIQ), and foreign ownership (FOWN), with values of 0.003, 0.005, and 0.008, respectively.
Figure 3. Coefficients as feature importance.
Next, we used four algorithms of the decision tree group: random ores, decision tree, AdaBoost, and gradient boosting. Table shows the number of financial statements based on decision tree algorithms. Figure demonstrates the similar importance values of the factors affecting the quality of synthesized financial statements.
Figure 4. Feature importance.
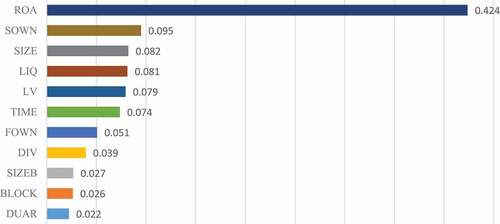
Table 10. Feature importance
Among the 11 factors affecting the quality of financial statements, ROA has the highest importance score of 0.424, followed by state ownership (SOWN) and the index of enterprise size by assets (SIZE). In contrast, the three indexes with the lowest importance are the factors of the Chairman of the Board of Directors (0.022), concentration of significant shareholder ownership (0.026), and size of the board of directors (0.027).
Table lists the initial values provided by the Permutation Feature Importance method. The result is the average weighted score for each financial indicator, as determined in Column [3] F (Fused). The Permutation Feature Importance value is smaller than the Feature Importance and Coefficients; therefore, they are not comparable.
Table 11. Permutation feature importance
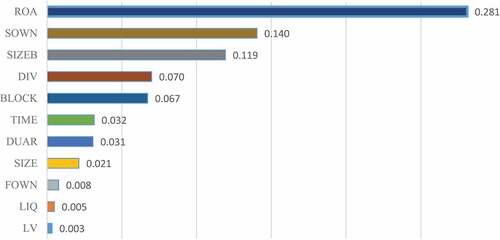
According to Figure , the three most important factors affecting the quality of financial statements, according to the Permutation Feature Importance index, are profitability after tax on total assets (0.012), state ownership (0.011), and enterprise size (0.009). In contrast, the indicators with the lowest level of importance include short-term solvency (0.001), dividend payout ratio (0.002), and significant shareholder concentration (0.006).
Figure 5. Permutation feature importance.
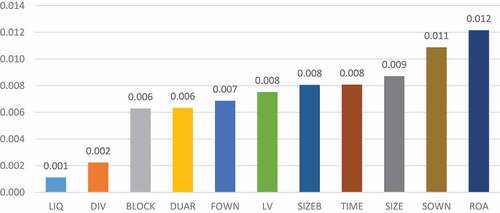
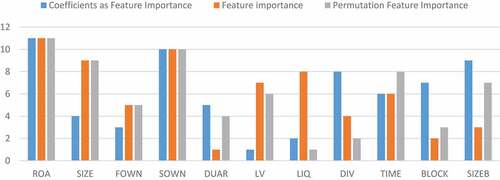
For a comprehensive assessment, we rank the results of the three methods as a bar chart to consider the importance of 11 financial ratios with values ranging from Each factor is grouped into three groups: “Coefficients as Feature Importance,” “Feature Importance,” and “Permutation Feature Importance,” for a better comparison ranking of financial ratios based on the approach. We show that the three most important factors affecting the quality of financial statements are profitability of profit after tax on assets (ROA), state ownership (SOWN), and the size of the enterprise (SIZE).
Figure 6. Feature Importance Ranking.
6. Conclusions and recommendations
Our study used a sample of 2,225 observations of listed companies in the Vietnamese stock market from 2014 to 2020 to examine the role and importance of factors in the quality of financial statements using the machine learning method. The results show that several factors, including corporate profitability, firm size, and size of the Board of Directors, have a positive relationship with the quality of financial statements. By contrast, dividend policy, ownership state, and enterprise listing time negatively affect the quality of financial statements. Our study shows that corporate profitability, state ownership, and firm size are the most critical factors affecting the quality of financial statements from an auditing point of view.
Based on the research results, the authors propose the following policy implications:
—Enterprises that want to attract investors’ attention should provide more information related to financial statement quality measurement models and support investors and analysts with more complete information in making decisions. Although the necessary information for the measurement models has been provided through financial statements, investors who want such information must spend a lot of time synthesizing and processing it, so it is possible in the future. In the process of providing information on annual reports, enterprises need to add the necessary information that the measurement models need about the quality of financial statements. Since then, investors have become more interested in and trusted when making investment decisions.
—For the factor of corporate profitability, which has a positive influence on the quality of financial statements, specifically, the higher the ratio of net profit to total assets, the higher the quality of financial statements. It can be said that the results in this study on the influence of factors related to company efficiency on the quality of financial statements show that companies listed on the Vietnamese stock market tend to have high efficiency. The higher the results, the higher the quality of financial statements; however, stakeholders need to be more careful when using information on the financial statements of listed companies before making economic decisions.
Our study is limited to the use of basic machine learning algorithms such as random forest, AdaBoost, gradient boosting, and KNeighbor. In addition, the number of indicators is limited to 11. This allows future studies to review and use other algorithms such as neural networks (NN) and support vector machines (SVM). Future studies may consider examining other attributes of financial statements and governance aspects to evaluate the quality of financial statements more effectively from an audit point of view.
Disclosure Statement
No potential conflict of interest was reported by the author(s).
Additional information
Funding
Notes
1. Listed companies operating in Vietnam or any markets are required to prepare and lodge financial reports with their authority, usually at the end of the financial year. Annual financial reports are required to be audited.
2. In accordance with the Qualitative Characteristics of Accounting Information, a hierarchy of accounting information qualitative characteristics in financial reporting should be considered (e.g., see Grigoras-Ichim and Morosan-Danila, 2016).
3. According to the International Financial Reporting Standards Board, financial statements provide valuable information to current, and potential investors, creditors, and other users in evaluating cash flows, and the ability to predict future cash flows makes a sound investment.
References
- Abed, S., Al-Attar, A., & Suwaidan, M. (2012). Corporate governance and earnings management: Jordanian evidence. International Business Research, 5(1), 216–25. doi:10.5539/ibr.v5n1p216
- Ahmed, A. S., & Duellman, S. (2013). Managerial overconfidence and accounting conservatism. Journal of Accounting Research, 51(1), 1–30. https://doi.org/10.1111/j.1475-679X.2012.00467.x
- Altman, N. S. (1992). An introduction to kernel and nearest-neighbor nonparametric regression. The American Statistician, 46(3), 175–185. https://doi.org/10.1080/00031305.1992.10475879
- Alves, S. (2014). The effect of board Independence on the earnings quality: Evidence from Portuguese listed companies. Australasian Accounting, Business and Finance Journal, 8(3), 23–44. http://dx.doi.org/10.14453/aabfj.v8i3.3
- Anichebe, A. (2019). Determinants of financial statement fraud likelihood in listed firms. Journal of Accounting and Financial Management , 5(2), 1–9. https://www.iiardjournals.org/get/JAFM/VOL.%205%20NO.%202%202019/Determinants%20of%20financial.pdf
- Bahmani, D. (2014). The relation between disclosure quality and information asymmetry: Empirical evidence from Iran. International Journal of Financial Research, 5(2), 110–114. J. I. J. o. F. R
- Ball, R., & Shivakumar, L. (2005). Earnings quality in UK private firms: Comparative loss recognition timeliness. Journal of Accounting and Economics, 39(1), 83–128. https://doi.org/10.1016/j.jacceco.2004.04.001
- Beest, F., Braam, G., & Boelens, S. (2009 doi:). Quality of Financial Reporting: Measuring qualitative characteristics. https://repository.ubn.ru.nl/bitstream/handle/2066/74896/74896.pdf
- Belson, W. A. (1959). Matching and prediction on the principle of biological classification. Journal of the Royal Statistical Society. Series C, Applied Statistics, 8(2), 65–75. https://doi.org/10.2307/2985543
- Bertomeu, J., Cheynel, E., Floyd, E., & Pan, W. (2021). Using machine learning to detect misstatements. Review of Accounting Studies, 26(2), 468–519. https://doi.org/10.1007/s11142-020-09563-8
- Caramanis, C., & Spathis, C. (2006). Auditee and audit firm characteristics as determinants of audit qualifications: Evidence from the Athens stock exchange. Managerial Auditing Journal, 21(9), 905–920. https://doi.org/10.1108/02686900610705000
- Chalaki, P., Didar, H., & Riahinezhad, M. (2012). Corporate governance attributes and financial reporting quality: Empirical evidence from Iran. International Journal of Business and Social Science, 3(15), 223–229. https://ijbssnet.com/journals/Vol_3_No_15_August_2012/25.pdf
- Cohen, J. R., Krishnamoorthy, G., & Wright, A. (2004). The corporate governance mosaic and financial reporting quality. Journal of Accounting Literature, 87–152. 2004 https://ssrn.com/abstract=1086743
- Criado-Jiménez, I., Fernández-Chulián, M., Larrinaga-González, C., & Husillos-Carqués, F. J. (2008). Compliance with mandatory environmental reporting in financial statements: The case of Spain (2001–2003). Journal of Business Ethics, 79(3), 245–262. https://doi.org/10.1007/s10551-007-9375-7
- Dachi, A. I. (2019). Analysis of factors affecting the quality of financial statements using information technology as moderated variables in the government of the south nias regency. International Journal of Public Budgeting, Accounting and Finance, 2(3), 1–13. https://core.ac.uk/download/pdf/268161236.pdf
- Dang, N. H., Hoang, T. V. H., & Tran, M. D. (2017). Factors affecting earnings management: The case of listed firms in Vietnam. International Journal of Economic Research, 14(20), 117–134. https://d1wqtxts1xzle7.cloudfront.net/57449573/Factors_Affecting_Earnings_Management_The_Case_of_Listed_Firms_in_Vietnam-libre.pdf?1537943212=&response-content-disposition=inline%3B+filename%3DFactors_Affecting_Earnings_Management_Th.pdf&Expires=1677486399&Signature=ZX6~19tLz5UdkdO69TDFGDwV74dF80JcCw~wCjY6NR2O9B86MW3BRirgu1NqWjSYGUvInE4YUfUkWXMJ6X0DF4tjqbzYaRlJh4XvOs~0c1SlchHdhgX6tkoB7GpHVOQ6V5FHxs8IroUKCMUWNYm5j4GX4gEt0xGQ5SgRCnop3c5rH4jnV0JihJP0UNJQDyI10UjkURDbR4H0yceYpzHZ~SI~wv5jIOgenRGnS62bup78EMF7RfOqpdn7pAKtp100KJ-rhMhXbMkDGoXkZ2Ka~ILA8UyUWVX3IiEucQY6Q6nAOdxrVy6N~G9AlFlm2ptGNGz1T5FKGU4SJT5effaavw__&Key-Pair-Id=APKAJLOHF5GGSLRBV4ZA
- Dang, H. N., Vu, V. T. T., Ngo, X. T., & Hoang, H. T. V. (2019). Study the impact of growth, firm size, capital structure, and profitability on enterprise value: Evidence of enterprises in Vietnam. Journal of Corporate Accounting & Finance, 30(1), 144–160. https://doi.org/10.1002/jcaf.22371
- Dechow, P., Ge, W., & Schrand, C. (2010). Understanding earnings quality: A review of the proxies, their determinants and their consequences. Journal of Accounting and Economics, 50(2–3), 344–401. https://doi.org/10.1016/j.jacceco.2010.09.001
- DeFond, M., & Zhang, J. (2014). A review of archival auditing research. Journal of Accounting and Economics, 58(2–3), 275–326. https://doi.org/10.1016/j.jacceco.2014.09.002
- Ding, K., Lev, B., Peng, X., Sun, T., & Vasarhelyi, M. A. (2020). Machine learning improves accounting estimates: Evidence from insurance payments. Review of Accounting Studies, 25(3), 1098–1134. https://doi.org/10.1007/s11142-020-09546-9
- Diouf, D., & Boiral, O. (2017). The quality of sustainability reports and impression management: A stakeholder perspective. Accounting, Auditing & Accountability Journal, 30(3), 643–667. https://doi.org/10.1108/AAAJ-04-2015-2044
- Epstein, B. J., & Jermakowicz, E. K. (2008). IFRS Policies and Procedures. John Wiley & Sons.
- Fernández-Gámez, M., García-Lagos, F., & Sánchez-Serrano, J. (2016). Integrating corporate governance and financial variables for the identification of qualified audit opinions with neural networks. Neural Computing & Applications, 27(5), 1427–1444. https://doi.org/10.1007/s00521-015-1944-6
- Feroz, E. H., Kwon, T. M., Pastena, V. S., & Park, K. (2000). The efficacy of red flags in predicting the SEC’s targets: An artificial neural networks approach. Intelligent Systems in Accounting, Finance & Management, 9(3), 145–157. https://doi.org/10.1002/1099-1174(200009)9:3<145::AID-ISAF185>3.0.CO;2-G
- García Jara, E., Cuadrado Ebrero, A., & Eslava Zapata, R. (2011). Effect of international financial reporting standards on financial information quality. Journal of Financial Reporting and Accounting, 9(2), 176–196. https://doi.org/10.1108/19852511111173121
- Gassen, J., & Schwedler, K. (2010). The decision usefulness of financial accounting measurement concepts: Evidence from an online survey of professional investors and their advisors. European Accounting Review, 19(3), 495–509. https://doi.org/10.1080/09638180.2010.496548
- Green, B. P., & Choi, J. H. (1997). Assessing the risk of management fraud through neural network technology. Auditing, 16, 14–28. https://www.researchgate.net/profile/Brian-Green-12/publication/245508224_Assessing_the_Risk_of_Management_Fraud_Through_Neural_Network_Technology/links/5be84e8792851c6b27b740a8/Assessing-the-Risk-of-Management-Fraud-Through-Neural-Network-Technology.pdf
- Hassan, S. U., & Ahmed, A. (2012). Corporate governance, earnings management and financial performance: A case of Nigerian manufacturing firms. American International Journal of Contemporary Research, 2(7), 214–226. https://www.aijcrnet.com/journals/Vol_2_No_7_July_2012/26.pdf
- Hassan, S. U., & Bello, A. (2013). Firm characteristics and financial reporting quality of listed manufacturing firms in Nigeria. International Journal of Accounting, Banking and Management, 1(6), 47–63. https://www.academia.edu/6335190/FIRM_CHARACTERISTICS_AND_FINANCIAL_REPORTING_QUALITY_OF_LISTED_MANUFACTURING_FIRMS_IN_NIGERIA
- Hitz, J.-M. (2007). The decision usefulness of fair value accounting–a theoretical perspective. European Accounting Review, 16(2), 323–362. https://doi.org/10.1080/09638180701390974
- Hoang, T. V., Dang, N. H., Tran, M. D., Van Vu, T. T., & Pham, Q. (2019). Determinants influencing financial performance of listed firms: Quantile regression approach. Asian Economic and Financial Review, 9(1), 78–90. https://doi.org/10.18488/journal.aefr.2019.91.78.90
- Houqe, N., van Zijl, T., Dunstan, K. L., & Karim, A. (2011). Does corporate governance affect earnings quality: Preliminary evidence from an emerging market. AT Business Review, 7(3), 48–57. https://ssrn.com/abstract=1726134
- Hung, D. N., Do Hoai, L. T., Hoa, T. V., T. M, D., & Ha, H. T. V. (2018). Factors influencing accrual earnings management and real earnings management: The case of Vietnam. Paper presented at the Proceedings of 14 th International Conference on Humanities and Social Sciences 2018 ThaiLan.
- Inchausti, B. G. (1997). The influence of company characteristics and accounting regulation on information disclosed by Spanish firms. European Accounting Review, 6(1), 45–68. https://doi.org/10.1080/096381897336863
- Klai, N., & Omri, A. (2011). Corporate governance and financial reporting quality: The case of Tunisian firms. International Business Research, 4(1), 158–166. https://citeseerx.ist.psu.edu/document?repid=rep1&type=pdf&doi=ecc1e680ec4857114d7d6f5ad6d76889d2d803c3
- Kothari, S. (2000). The role of financial reporting in reducing financial risks in the market. Paper Presented at the Conference Series-Federal Reserve Bank of Boston, 44(1), 89–102. https://core.ac.uk/download/pdf/6706729.pdf
- Kueppers, R. J., & Sullivan, K. B. (2010). How and why an independent audit matters. International Journal of Disclosure and Governance, 7(4), 286–293. https://doi.org/10.1057/jdg.2010.22
- Mackenzie, B., Coetsee, D., Njikizana, T., Chamboko, R., Colyvas, B., & Hanekom, B. (2012). Wiley IFRS 2013: Interpretation and Application of International Financial Reporting Standards. John Wiley & Sons.
- Pedregosa, F., Varoquaux, G., Gramfort, A., Michel, V., Thirion, B., Grisel, O., and Dubourg, V. (2011). Scikit-learn: Machine learning in Python. The Journal of Machine Learning Research, 12, 2825–2830. https://www.jmlr.org/papers/volume12/pedregosa11a/pedregosa11a.pdf?ref=https:/
- Perols, J. (2011). Financial statement fraud detection: An analysis of statistical and machine learning algorithms. Auditing: A Journal of Practice & Theory, 30(2), 19–50. https://doi.org/10.2308/ajpt-50009
- Perols, J. L., Bowen, R. M., Zimmermann, C., & Samba, B. (2017). Finding needles in a haystack: Using data analytics to improve fraud prediction. The Accounting Review, 92(2), 221–245. https://doi.org/10.2308/accr-51562
- Pourheydari, O., Nezamabadi-pour, H., & Aazami, Z. (2012). Identifying qualified audit opinions by artificial neural networks. African Journal of Business Management, 6(44), 11077–11087. https://doi.org/10.5897/AJBM12.855
- Qinghua, W., Pingxin, W., & Junming, Y. (2007). Audit committee, board characteristics and quality of fi nancial reporting: An empirical research on Chinese securities market. Frontiers of Business Research in China, 1(3), 385–400. https://doi.org/10.1007/s11782-007-0023-y
- Quinlan, J. R. (1986). Induction of decision trees. Machine Learning, 1(1), 81–106. https://doi.org/10.1007/BF00116251
- Quinlan, J. R. (1996, August). Bagging, boosting, and C4. 5. Aaai/Iaai, 1(1), 725–730. http://www.cs.ecu.edu/~dingq/CSCI6905/readings/BaggingBoosting.pdf
- Saif, S. M., Sarikhani, M., & Ebrahimi, F. (2013). An expert system with neural network and decision tree for predicting audit opinions. IAES International Journal of Artificial Intelligence, 2(4), 151–158. https://ijai.iaescore.com/index.php/IJAI/article/view/1375
- Sánchez-Serrano, J. R., Alaminos, D., García-Lagos, F., & Callejón-Gil, A. M. (2020). Predicting audit opinion in consolidated financial statements with artificial neural networks. Mathematics, 8(8), 1288. https://doi.org/10.3390/math8081288
- Schipper, K., & Vincent, L. (2003). Earnings quality. Accounting Horizons, 17(s–1), 97–110. https://doi.org/10.2308/acch.2003.17.s-1.97
- Sharma, A., & Panigrahi, P. K. (2013). A review of financial accounting fraud detection based on data mining techniques. International Journal of Computer Applications, 39(1), 37–47. https://doi.org/10.5120/4787-7016
- Shubita, M. F. (2021). The ability of cash flows to predict the earning: Evidence from Jordan. Investment Management & Financial Innovations, 18(4), 36–44. https://doi.org/10.21511/imfi.18(4).2021.04
- Soliman, M. M., & Ragab, A. A. (2014). Audit committee effectiveness, audit quality and earnings management: An empirical study of the listed companies in Egypt. Research Journal of Finance and Accounting, 5(2), 155–166. https://d1wqtxts1xzle7.cloudfront.net/31769175/Audit_Committee_Effectiveness_1_-libre.pdf?1392312120=&response-content-disposition=inline%3B+filename%3DAudit_Committee_Effectiveness_1.pdf&Expires=1677489097&Signature=ZZf2EJWA7tezmT-LB1I-uoZbmSraWuGjNk~D5KRIWQ6QfX5ml-WIh~bIFhO2DM3dtdAzruD2UuoNXygdUmfkly19tKpA5C-O2G4VoEHOjI5rRcLluA~xJl52mPfAMZiTaHBhPR7opAgmqb~SrlrhyVHnWe9nUi0EzXMIJ9FrNuqcNEN6myr0VGqLV~kXsQY84SOV4Gs43~DXrihhiSV99gAOk3E5oN4SVL0zGONeFwUJGJXxeuuaTiFH6q4Woi9vf5to~cXXRxVPQNDp-pLwtL-wlhRCQQ0vkj2eMdg5DoQVdahPNDFfGi~ypdHE7BOHM~ovpdzi-QTbH3UMIlSOaA__&Key-Pair-Id=APKAJLOHF5GGSLRBV4ZAhttps://d1wqtxts1xzle7.cloudfront.net/31769175/Audit_Committee_Effectiveness_1_-libre.pdf?1392312120=&response-content-disposition=inline%3B+filename%3DAudit_Committee_Effectiveness_1.pdf&Expires=1677489097&Signature=ZZf2EJWA7tezmT-LB1I-uoZbmSraWuGjNk~D5KRIWQ6QfX5ml-WIh~bIFhO2DM3dtdAzruD2UuoNXygdUmfkly19tKpA5C-O2G4VoEHOjI5rRcLluA~xJl52mPfAMZiTaHBhPR7opAgmqb~SrlrhyVHnWe9nUi0EzXMIJ9FrNuqcNEN6myr0VGqLV~kXsQY84SOV4Gs43~DXrihhiSV99gAOk3E5oN4SVL0zGONeFwUJGJXxeuuaTiFH6q4Woi9vf5to~cXXRxVPQNDp-pLwtL-wlhRCQQ0vkj2eMdg5DoQVdahPNDFfGi~ypdHE7BOHM~ovpdzi-QTbH3UMIlSOaA__&Key-Pair-Id=APKAJLOHF5GGSLRBV4ZA
- Spathis, C., Doumpos, M., & Zopounidis, C. (2003). Using client performance measures to identify pre-engagement factors associated with qualified audit reports in Greece. The International Journal of Accounting, 38(3), 267–284. https://doi.org/10.1016/S0020-7063(03)00047-5
- Stanišić, N., Radojević, T., & Stanić, N. (2019). Predicting the type of auditor opinion: Statistics, machine learning, or a combination of the two? The European Journal of Applied Economics, 16(2), 1–58. https://doi.org/10.5937/EJAE16-21832
- Summers, S. L., & Sweeney, J. T. (1998). Fraudulently misstated financial statements and insider trading: An empirical analysis. Accounting Review, 131–146. https://www.jstor.org/stable/248345
- Suwanda, D. (2015). Factors affecting quality of local government financial statements to get unqualified opinion (WTP) of audit board of the Republic of Indonesia (BPK). Research Journal of Finance and Accounting, 6(4), 139–157. https://iiste.org/Journals/index.php/RJFA/article/view/19978/20506
- Tang, Q., Chen, H., & Lin, Z. (2016). How to measure country-level financial reporting quality? Journal of Financial Reporting and Accounting. https://doi.org/10.1108/JFRA-09-2014-0073
- Van Beest, F., Braam, G., & Boelens, S. (2009). Quality of Financial Reporting: Measuring qualitative characteristics. Nijmegen Center for Economics (NiCE). Working Paper, 09–108. https://repository.ubn.ru.nl/bitstream/handle/2066/74896/74896.pdf
- Van, H. T. T., Hung, D. N., Van, V. T. T., & Xuan, N. T. (2019). Managing Optimal Working Capital and Corporate Performance: Evidence from Vietnam. Asian Economic and Financial Review, 9(9), 977–993. https://doi.org/10.18488/journal.aefr.2019.99.977.993
- Van Khanh, V. T., & Hung, D. N. (2020). Impact of Earnings Quality on the Debt Maturity: The Case of Vietnam. Asian Economic and Financial Review, 10(1), 1–12. https://doi.org/10.18488/journal.aefr.2020.101.1.12
- Xie, B., Davidson, W. N., & DaDalt, P. J. (2003). Earnings management and corporate governance: The role of the board and the audit committee. Journal of Corporate Finance, 9(3), 295–316. https://doi.org/10.1016/S0929-1199(02)00006-8
- Yaşar, A., Yakut, E., & Gutnu, M. M. (2015). Predicting qualified audit opinions using financial ratios: Evidence from the Istanbul Stock Exchange. International Journal of Business and Social Science, 6(8), 57–67. https://ijbssnet.com/journals/Vol_6_No_8_1_August_2015/6.pdf
- Zou, H., & Hastie, T. (2005). Regularization and variable selection via the elastic net. Journal of the Royal Statistical Society. Series B, Statistical Methodology, 67(2), 301–320. https://doi.org/10.1111/j.1467-9868.2005.00503.x