
Abstract
This research attempts to apply Image Theory to examine whether the tendency to continue the initial strategy or maintain the status quo known as escalation of commitment (EoC) from institutional investors leads to positive investment performance in unstable real environmental conditions with certain changing trends. In the equity market, investors are always faced with the option of maintaining their existing portfolio (initial strategy) or modifying it (generate emergent strategy) to increase assets as the goal. However, they have a tendency to EoC. Based on this situation, the authors conduct a quantitative study with covariance-based structural equation models (CB-SEM) approach one of the fund management industry in the Indonesian equity market during bearish conditions in the midst of the 2008 global economic crisis and bullish conditions during the crisis recovery as the background. This study shows that EoC is not always associated with more negative performance because it can result in more positive performance in high image compatibility state.
1. Introduction
In strategic management, strategy process is essentially related to decision-making (Hettich & Kreutzer, Citation2021). Decisions are incremental, interrelated, and influenced by contextual (objective content) and psychological factors (van Assen, Citation2020), which are carried out by managers, not organizations, in response to environmental changes (Laureiro‐martínez & Brusoni, Citation2018). Thus, the decision-making process in organizations (strategic) is complex and is influenced by many aspects (Liao et al., Citation2020).
In relation to the theory of decision-making, managers’ cognitive and values can be well adopted by Image Theory (Penney et al., Citation2019). Image theory can accommodate the rational and psychological aspects of strategic decision-making as proposed by Yang et al. (Citation2019). The rational aspects are reflected: (1) when decision makers determine the strategy image, namely planning and forecasting, and (2) through profitability testing when more than one alternative appears. The psychological aspects are reflected in the interaction of the three images (value, trajectory, and strategy) in shaping environmental perceptions (image compatibility). Meanwhile, the characteristic aspects of the industry serve as guidelines and governance that limit the generation of trajectory and strategy images, so that they can be classified implicitly into a value image.
Image compatibility, the manager’s perceptions or beliefs on the alignment of the strategies used with the initial targets (Ogbeibu et al., Citation2020), then becomes a determinant to predict further decisions. When image compatibility is high, managers tend to continue and/or escalate their initial decisions (initial strategy) and, vice versa, managers are motivated to change or modify initial decisions (generate emergent strategies). The tendency to continue with the initial strategy or maintain the status quo is known as escalation of commitment (EoC) (Sleesman et al., Citation2018). Huang et al. (Citation2019) involved EoC as an element in the psychological context. The reason is that EoC reflects (1) the incremental process of making decisions towards goals and (2) the interdependent nature of current decisions with past decisions. These two characteristics are consistent with the description of strategic decisions according to Sleesman et al. (Citation2018).
Kalmanovich-Cohen et al. (Citation2018) argue that managers have a tendency to maintain the initial strategy (status quo), which is also referred to as escalation of commitment (EoC), especially when their tenure has been relatively long in the same organization or industry. This tendency (EoC) also increases when managers are actively involved during the deciding of the initial strategy (Nouri, Citation2020; Staw, 1976), and when decisions become a concern in their social environment (Ohlert & Weißenberger, Citation2020). To date, the literature on EoC tends to be associated with increasingly negative performance, for instance Zorn et al. (Citation2020).
In relation to Image Theory, EoC holds the potential to be related to Image compatibility because both explain the subsequent decision mechanism. By linking EoC and Image Theory, there is a chance that the resulting performance will be positive or more positive. This is due to the high image compatibility indicating confidence in the realization of the trajectory in the future, and thus motivating decision makers to continue or escalate their commitment. This linkage has not been studied empirically in the previous literature.
Based on the description above, the authors are motivated to examine managerial behavior when faced with extreme environmental conditions. This study specifically examines the strategies undertaken by managers: whether to maintain the initial strategy (status quo) or generate an emergent strategy so that performance remains positive. This study uses upper echelons theory (Abatecola & Cristofaro, Citation2018; Hambrick & Mason, Citation1984) as a foundation, which is operationalized through Image Theory, and is linked to EoC and performance. In the context of strategic management, this study aims at exploring EoC behavior that can result in more positive performance, by taking into account the compatibility of the manager’s image.
To achieve this research objective, the authors performed observation on of the fund management industry in the Indonesian equity market and considered bearish conditions during the crisis and bullish conditions during the post-2008 global economic crisis recovery as the background. In the equity market, investors are always faced with the option of maintaining their existing portfolio (initial strategy) or modifying it (generate emergent strategy) to increase assets as the goal. The transition from a declining and negative environment (bearish conditions) to a significantly increasing and positive (bullish condition) environment in a relatively short period of time is a rare moment to observe the strategy formation process in the real world, especially in Indonesia. To date, research on Image Theory has been driven by stable environmental conditions (negative or positive). This research attempts to apply Image Theory in unstable real environmental conditions and with certain changing trends. Therefore, it is expected that the results of this study can be used as a guide to determine the two options that lead to positive performance even in conditions of market crash recovery, such as conditions in the equity market during the recent COVID-19 pandemic.
2. Literature review and hypothesis construction
In this section, the research model construction and hypotheses to be tested will be described. The basic construction of the research model uses the foundation of upper echelon theory (Hambrick & Mason, Citation1984) as shown in Figure . This figure explains that the objective situation will affect the psychological orientation of managers, who are involved in the perception process, resulting in a specific strategic choice.
Figure 1. An upper echelons perspective of organizations (Hambrick & Mason, Citation1984).
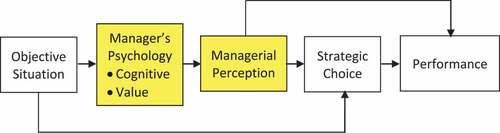
In this research, the objective situation is represented by bearish and bullish conditions. The psychology and perception of managers are, respectively, represented by the three images (value, trajectory, and strategy image), and image compatibility. The strategic choice is represented by escalation of commitment (EoC) and is a manifestation of follow-up decisions. While performance is defined as returns.
Specifically, this research aims to explore how investment managers treat the portfolios they manage (emergent strategy) in two different environmental trends (bearish and bullish), and how the performance of the emergent strategy is. Therefore, this research does not examine how investment managers determine the new stocks that will be bought (stock picking). Figure is the conceptual model derived from Figure .
Figure 2. Conceptual model.
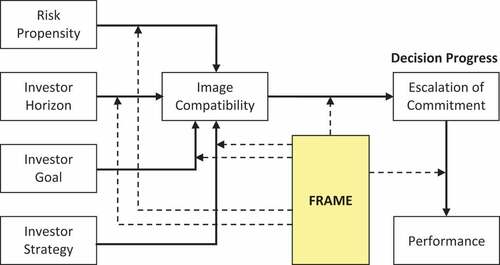
From , it can be seen that framing plays an important role in moderating all relationships between variables. The decisions made by someone are greatly influenced by the type of information presented in a certain frame. The type of frame, whether positive or negative, will evoke certain preferences and behaviors in the decision-maker facing the problem (Tversky & Kahneman, Citation1981). This is evidenced among others by Kahneman and Tversky (Citation1979) who said that in a positive frame, someone tends to be a risk averter, and becomes a risk seeker in a negative frame. Bateman and Zeithaml (Citation1989) found evidence that resources will be allocated more when in a positive frame. While Klein (Citation1989) believes that when information is positive, cognitive processes tend to be reactive, in other words, less comprehensive and systematic. Conversely, when information is negative, decision makers tend to be more active in processing information with more in-depth analysis. Dunegan et al. (Citation1995) believe that there is a significant relationship between the frame and image compatibility. Specifically, decision makers will be more active in using the information obtained when image compatibility is low, and vice versa.
Based on the conceptual model in and the description above, the author builds the research model as illustrated in Figures in the next section. In this research, the variable frame is not measured specifically, but is used as a differentiator for the two models to be tested, which are the model when the frame is negative and the model when the frame is positive. In terms of construction, the model building and variable measurement do not change. The difference lies in the data content, which is data obtained from the same respondents when in each of those conditions. The negative frame period (bearish) is observed starting January 2008 to February 2009, and the positive frame period (bullish) starts March 2009 until now. The symbols “a” and “b” on each hypothesis are interpreted, respectively, as the hypothesis when the frame is negative and the frame is positive.
Figure 3. Research model for hypothesis 1–6.
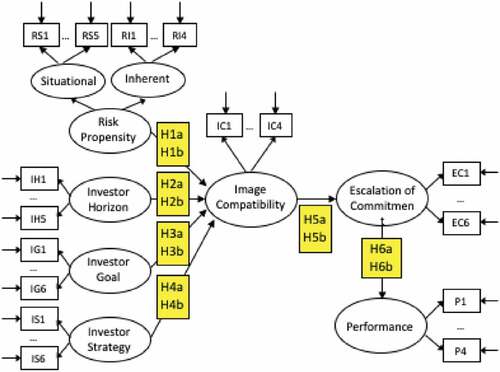
Figure 4. Research model for hypothesis 7.
In the next section, the hypotheses to be tested will be described based on the research model above. The variables of risk propensity and investor horizon represent the value image of the investor, while investor goal and investor strategy, respectively, represent the trajectory and strategy image. EoC in this case is a representation of progress decision, which is similar to continue or add strategy in the Image Theory proposition.
2.1. Value image: Risk propensity and investor horizon
In value image, there are beliefs, norms, morals, and values that are inherent in a person and motivate that person to take certain actions. Collectively, a collection of values, morals, and beliefs in the value image form the basic principles and provide a description of the characteristics of the person (Ng & Sears, Citation2020; Beach, 1998). Based on its definition, the value image in the framework of Image Theory (Penney et al., Citation2019; Beach & Mitchell, 1987) is identical to the value in upper echelons theory (Abatecola & Cristofaro, Citation2018; Hambrick & Mason, Citation1984). Therefore, in this study, the authors can operationalize the value image with risk propensity and investor horizon. This opinion is reinforced by Kim et al. (Citation2020) and Tang (1992, 1996) stating that in addition to risk propensity, the investment horizon is a factor that must be considered in forming an optimal investment profile.
In relation to risk propensity, a study by Nguyen et al. (Citation2019) and Pablo and Weingart (1995) shows a negative relationship between risk propensity and risk perception. Risk perception may be associated with image compatibility in this study, and risky decision-making behavior is associated with escalation of commitment. Such an association is also supported by the fact that stock investment is a realm of high-risk decisions. However, image compatibility has a broader context than risk perception because it is fixed not only on risk factors but on the alignment of three images: value, goal, and strategy. Therefore, although they have almost identical relationship paths, the negative effect of risk propensity on risk perception (Nguyen et al., Citation2019; Pablo & Weingart, 1995) cannot simply be used to describe the effect of risk propensity on image compatibility in this study.
Value image, in this case risk propensity and investor horizon, can indeed be sorted in certain ordinal. For instance, Sultana et al. (Citation2018) and Pablo and Weingart (Citation1995) categorize high-risk propensity as a risk seeker and low-risk propensity as a risk converter. However, in relation to image compatibility, such an order cannot be used. This is due to the absence of the literature linking these variables. A risk seeker, for instance, does not necessarily have a higher image compatibility than a risk converter, or vice versa, and similarly with daily traders and long-term investors on the investor horizon variable. However, as a principle in value image, these two variables should act as a reference to generate a consistent trajectory and strategy image.
Both risk propensity and investor horizon are essentially the basic characteristics of investors. However, these characteristics can change due to situational factors, which can lead to changes in compatibility. In addition, the two characteristics also play a role when investors are motivated to revise or change their strategy in a progress decision. Both function as filters to select several goals and/or plans, respectively, as a new trajectory and/or strategy image (Nadeem et al., Citation2020; Nobre et al., Citation2018; Beach, 1998). Thus, the authors argue that the existence of value image has a significant role in the compatibility test, both in negative and positive frames, so that the following hypotheses can be formed:
H1:
Risk propensity affects image compatibility.
H2:
Investor horizon affects image compatibility.
2.2. Investor goal and investor strategy
In this study, the investor goal and the investor strategy are the representations of trajectory and strategy image, respectively. The strategy image is an investment decision plan chosen by the investor in order to create a trajectory image. The alignment between the trajectory and the strategy image is the core of the compatibility test, which is carried out continuously due to the latest information at a certain time. Trajectory and strategy images are, by definition, identical to cognitive in upper echelons theory (Penney et al., Citation2019; Hambrick & Mason, Citation1984).
In determining subsequent decisions, for each compatibility test, investors will conduct compatibility tests to re-evaluate strategies (plan and forecasting) in the future. Thywissen et al. (Citation2018), Nobre et al. (Citation2018) and Beach (1998) state that if planning and forecasting are not perceived as capable of realizing the trajectory image, the strategy image will be revised or replaced. If revisions or changes do not allow the trajectory image to be achieved, the trajectory will be changed or adjusted. Conversely, if the tactics and consequence predictions are perceived as capable of realizing the trajectory image, the strategy image will be maintained or even enhanced. This indicates that the decision-maker is always trying to maintain or find new alignments (image compatibility). Therefore, it can be concluded that both trajectory and strategy image individually influence the compatibility test, while the high and low compatibility test results are influenced by the harmony between the two.
The compatibility test is a subjective evaluation because it is based on the decision makers’ perceptions of tactics and their prediction of consequences (Eze et al., Citation2018; Dunegan, Citation1995). In this case, perception relates to the level of confidence of decision makers on what should be done to realize the trajectory image, both in negative and positive frames. This indicates that in the negative frame, the image compatibility is not always low because the compatibility test is more influenced by perceptions of information content than the objective content of the information (Xu & Akther, Citation2019; Eze et al., Citation2018; Dunegan, Citation1995). In this case, perception is related to the level of confidence of the decision-maker, namely the confidence in the generated trajectory image capable of solving problems or meeting their needs, and the level of confidence in the strategy image capable of realizing the trajectory image. Thus, hypotheses can be formed:
H3:
Confidence in image trajectory affects image compatibility.
H4:
Confidence in image strategy affects image compatibility.
2.3. Image Compatibility and Escalation of Commitment (EoC)
The proposition of Image Theory depicts that when image compatibility is high, decision makers tend to continue their initial strategy (continuation) or increase resource allocation (addition) and otherwise change their strategy (change) (Drury‐grogan, Citation2017; Beach, 1990). Decisions on continuation and addition are the behavior of escalation of commitment, while decisions on change are de-escalation. This premise can be used to analyze the possible relationship between image compatibility and escalation of commitment in the context of portfolio investment.
In the negative frame, the price of assets, such as stocks, drops drastically, which worsens the performance of the portfolio owned by investors. At the time, there were two choices that investors could make: maintaining or selling their portfolios, each of which had unpredictable consequences. According to Duxbury et al. (Citation2020) and Staw (1976), this condition fulfills the requirements for the occurrence of EoC, which in this case can be in the form of time escalation, namely maintaining the position of the portfolio, as well as financial escalation, which is adding similar assets to the portfolio. The determinants that trigger the escalations are divided into two debatable groups: non-rational factors—such as psychological or social, and rational factors (Lee et al., Citation2018; Brockner, 1992).
Although it is rather difficult to identify which determinant plays the most role in this negative frame, Prospect Theory (Gregoriou et al. 2019; Tversky & Kahneman, Citation1979) can provide a sufficient elaboration. When the frame is negative, the asset price falls below its purchase price and the option to hold the asset has high uncertainty. If the asset is sold, the investor is certain to suffer a loss in accordance with the difference between the purchase price and the selling price. If the asset is maintained or even added, there is a possibility that (1) the price will rise again, and thus profit can be gained or loss can be minimized, or (2) the loss will be even greater. Prospect theory predicts that investors tend not to sell their portfolios, which means EoC has occurred, both in terms of time and financially.
In the negative frame, it is also rather difficult to identify the compatibility of the investor’s image is with the portfolio. Although the available information, both micro and macro, is negative, it is not always deemed negative in investors’ minds. Ogbeibu et al. (Citation2020) and Dunegan (Citation1995) state that how decision-makers perceive information is more important and influential in image compatibility tests than the objective content of the information. For instance, investors who believe that the price decline is only temporary and will soon rise again have high image compatibility, and therefore assets will be maintained or even added, and vice versa. When image compatibility is high, the predictions of Image Theory decisions are in line with EoC, but these predictions are the opposite when compatibility is low. Because the perception of image compatibility could not be predicted at the time, the following hypothesis can be formed:
H5a:
In the negative frame, image compatibility has no effect on escalation of commitment.
Through literature review, the authors predict that image compatibility has no effect on EoC in the negative frame (H5a). So far, there has never been any empirical research that proves this statement. Because this statement is a prerequisite for proving the subsequent hypothesis, namely H7, then H5a (bearish condition) must be raised and tested in this study. A provisional outcome can be perceived as compatible or incompatible, depending on the three images of the decision makers.
Jonsson et al. (Citation2017), Drury‐grogan (Citation2017) and Dunegan (Citation1995) state that decision makers tend to maintain the status quo, where little positive information can lead to high image compatibility. When entering the positive frame, investors tend to perceive the situation as something positive, so that image compatibility with their portfolios tends to be high. This is reinforced by the fact that in the months following the transitional period (March 2009), the composite share price index continued to increase although it had not yet reached its original state. Thus, investors would tend to maintain or increase their assets.
The decision to maintain or add assets by investors is basically a form of EoC. Essentially, the EoC concept is the tendency to make decisions that are against a rational perspective. Therefore, when the frame is positive (bullish), and when the price has risen back above the purchase price, investors should sell their assets. In fact, there are always investors who act the other way around: maintaining or adding to their assets, which make them classify as EoC. Thus, the relationship between image and EoC compatibility becomes apparent, which can be hypothesized as follows:
H5b:
In the positive frame, image compatibility has a positive effect on escalation of commitment.
2.4. Performance
Hinojosa et al. (Citation2017) and Brockner (1992) state that the Cognitive Dissonance Theory is currently one of the important explanations for EoC behavior from a negative frame perspective. Garland (1990) describes EoC as throwing good money after bad. Several studies, such as Katjazi et al. (2018), Ross and Staw (1986, 1993), Staw and Ross (1987) and Teger (1980), indicate that in the negative frame, decision performance will be increasingly negative if EoC continues. The cases of Expo 86 (Ross & Staw, 1986) and Shoreham Nuclear Power Plant (Ross & Staw, 1993) show that, up to a certain stage, decision makers are faced with the choice of exit (withdraw) or permanent failure.
Sleesman et al. (Citation2018) add that EoC behavior can also be explained by several other theories, such as the Prospect Theory (Huang et al., Citation2019; Kahneman & Tversky, Citation1979). According to this theory, a person tends to become a risk seeker when faced with a negative frame, which can trigger him to perform EoC. This decision is very risky and often ends in failure or a fiasco decision (Whyte, 1986). One example is the Japanese attack on Pearl Harbor in 1941 which was a very high-risk decision and had fatal consequences (Levi and Whyte, Citation1997). Another example is the Cuban Crisis in 1962 which prompted Kennedy and Khrushchev to make a series of decisions that were increasingly risky due to a worsening situation and the potential for nuclear war (Hass, Citation2001). However, that did not take place after Khrushchev suddenly withdrew his troops from the Bay of Pigs.
It can be seen from the descriptions of several studies above that EoC that continues to be carried out in a negative frame has the potential to result in increasingly negative performance. Thus, the authors form the following hypothesis:
H6a:
In the negative frame, the escalation of commitment has a negative effect on performance.
When the frame is positive or tends to be positive, Jain et al. (Citation2020) and Dunegan (Citation1995) suggest that image compatibility will increase and become relatively high. When image compatibility is high, investors believe that their tactics and plans are capable of realizing the trajectory image. According to Beach (1998), this belief is triggered by the ability of decision makers to predict (forecasting) the consequences of tactics and planning realistically. Experienced decision makers will trigger past relevant information in their memory to support their needs in forming tactics and predicting consequences (Cristofaro, Citation2020; Beach, 1998). In that situation, if the investor then carries out EoC to maintain assets or refrain from liquidating profit, the basis for consideration is factors that are more rational and realistic, including considering the risks that will be borne potentially (Kajtazi et al., Citation2018; Akhtar et al., Citation2018). Thus, it can be concluded that the resulting performance will be more positive. Therefore, the authors form the following hypothesis:
H6b:
In the positive frame, the escalation of commitment has a positive effect on performance.
The research model from hypotheses 1–6 can be depicted in Figure :
2.5. Image compatibility as a moderator
The image compatibility variable is a precondition for EoC. If hypothesis 5a is supported by research data, the precondition relationship is irrelevant. Therefore, the authors need to further explore the role of image compatibility that is more appropriate in the relationship between EoC and performance.
In relation to Image Theory, when image compatibility is low, the tactics used by investors and their prediction of consequences are perceived as incapable of realizing the trajectory image (Ogbeibu et al., Citation2020; Drury‐grogan, Citation2017; Beach, 1998). Therefore, decision makers need to revise or change strategies. However, if there is no change in strategy (continue initial decision) or EoC occurs, this shows that EoC is more triggered by non-rational determinants, as suggested by researchers supporting the Cognitive Dissonance Theory, for instance Jeong et al. (Citation2019), Hinojosa et al. (Citation2017). These researchers indicate that performance tends to be more negative if EoC is continued.
On the other hand, when image compatibility is high, decision-makers have confidence that the tactics and consequent predictions are capable of realizing the trajectory image, so decision makers will continue their initial decision, or in other words, carry out EoC. This argument is supported by several researchers, for instance Jurczyk et al. (Citation2019), who emphasize on rational determinants because of the prospect or expectation of achieving the original goal, and/or other rational values that can be obtained in future (Brockner, 1992).
In the negative frame and when image compatibility is high, the resulting performance can remain negative, but the scale is lower than EoC, which is triggered by irrational determinants. Sleesman et al. (Citation2018) as well as argue that the decrease in the intensity of psychological and social factors makes decision makers more rational in considering EoC risks and in seeing the possibility of making an exit decision. Eliëns et al. (Citation2018) and Bowen (1987) state that EoC decisions are triggered more by more rational motives, for instance the desire to put in extra effort to see whether the initial decision can result in positive performance, a learning process to gain new knowledge, or as part of strategy and planning from a broader perspective. These motives indicate that decision makers still have expectations of achieving positive results or obtaining other values in the future.
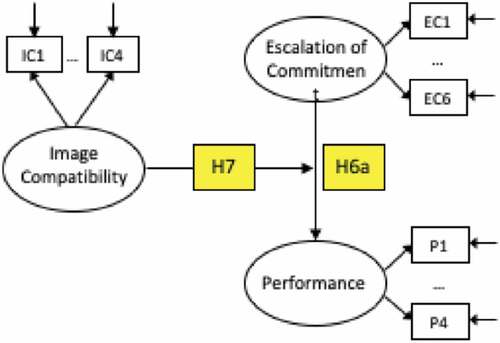
It can be seen from this description that the existence of image compatibility can affect the level of performance of EoC. When image compatibility is high, if EoC is carried out, the performance will be more positive (although still in the negative category) than that of when image compatibility is low. Therefore, the authors will further explore the relationship between EoC and image compatibility-moderated performance by developing a model like .
As previously described, if hypothesis 5a is supported by research data, and based on the model in Figure , the authors will explore the role of image compatibility as a moderator by forming the following hypothesis:
H7:
In the negative frame, image compatibility moderates the relationship between escalation of commitment and performance; Escalation of commitment has a negative effect on performance when image compatibility is low.
3. Methods
3.1. Sample and data collection
The selection of the stock portfolio investment domain (equity market) in this study is based on the consideration of the amount of risk contained in it (Zhou & Xu, Citation2018;) and it is straightforward to observe. This large amount of risk is caused by changes that occur in other markets, which always have direct and instantaneous impacts on the equity market. For instance, the crisis of 1929 (triggered by the equity market itself), the crisis of 1973 (triggered by the commodity market), the crisis of 1997 in Asia (triggered by the financial market), and the crisis of 2008 (triggered by the mortgage market). The number of risks reflects real conditions (uncertainty, complexity, and dynamics), so it is truly relevant in the context of the strategy process as a decision-making process. Meanwhile, the selection of bearish conditions while the crisis and bullish conditions during the post-2008 global economic crisis as a background to environmental conditions were based on the consideration that the crisis was the most recent and relatively still remembered by investors.
The unit of analysis in this study is institutional investors, which are securities and mutual funds companies. These institutional investors are represented by three groups of respondents: (1) WMI (certified investment managers) in securities and mutual funds’ companies that fully manage third-party funds, (2) fund managers at insurance companies and pension fund companies, and (3) finance directors, treasury managers, investment managers, or portfolio managers in non-financial companies that manage the companies’ excess funds in the form of shares, stock indexes, or their derivatives.
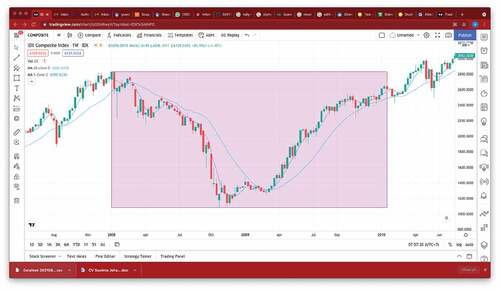
From the index movement and the value of stock trading on the Indonesia Stock Exchange (IDX) chart as shown in Figure , it is apparent that there have been two periods that differed significantly from January 2008 to January 2010. The period from January 2008 to February 2009 was a bearish period representing the negative frame, while the period from March 2009 to January 2010 was a bullish period representing the positive frame. The limits for the two periods are February and March 2009. Since March 2009, there has been a turning point (reversal) and has continued to show an increase, both in index and value, and tends to increase to date. The combination of the two periods is the observation period in this study. The positive and negative framing was conducted on the questionnaire so the respondent fills their response in both bullish and bearish period.
Figure 5. IDX index from January 2008 – January 2010 (tradingview.Com).
Data collection was carried out through several stages of the process up to survey activities in the field. The field survey was conducted by distributing 300 questionnaire copies to institutional respondents. Respondents’ domiciles are spread across six major cities in Indonesia: Jakarta, Surabaya, Semarang, Bandung, Solo, and Medan. The majority distribution mechanism was carried out directly by authors, by providing explanations to respondents if there were questions that were hard to understand. Meanwhile, the rest of the questionnaire copies were sent by post (letter) and followed up by phone. Communication by phone was also carried out when respondents’ answer was unclear, or when respondents did not fill in answers to several questions.
3.2. Measures and statistical methods
Data collection begins with the formulation of a questionnaire, interviews with potential respondents about the questions/statements in the questionnaire, and then pre-tests the questionnaire with institutional and individual respondents. The pre-test of the questionnaire resulted in changes in several questions in the questionnaire so that they were better and more contextual in accordance with conditions in the field. The results of the questionnaire can be seen in Table .
Table 1. Measurement indicators for questionnaire
The data obtained from the questionnaire will be analyzed using descriptive data analysis methods and analysed with covariance-based structural equation models (CB-SEM). This study uses CB-SEM since the statistical objective is to estimate model parameters that minimize the difference between the observed sample covariance matrix and the covariance matrix estimated after the revised theoretical model is confirmed. This is done by comparing the sample covariance matrix that was calculated before the analysis with the matrix estimated after the model is confirmed. This statistical objective is different from PLS-SEM in that it maximizes the variance explained by the dependent variables (Hair et al., Citation2017).
The CB-SEM analysis was carried out in two steps: measurement model analysis and structural model analysis. The measurement model analysis covers the Overall Model Fit analysis, which contains testing on how well the research model fits with the sample data, validity testing, and reliability testing. We analyze the overall structural model of the model and test the significance of the causal coefficient relationship (path coefficient).
The researchers also conducted FGD (Focus Group Discussion) with several sources from each group of investors, equity market observers, and academic advisors, after obtaining the processed data using SEM (Structural Equation Modeling) software. The aim was to discuss the research findings comprehensively and obtain practical explanations, especially if any unproven hypotheses were discovered later. The FGD guidance consists of exploring the factors that influence fund managers’ investment decisions, such as market analysis, risk management, and portfolio construction, discuss how personal values, beliefs, and self-image might impact their investment choices, probe for any instances where participants felt that their self-image influenced their decisions, positively or negatively, introduce the concept of image compatibility and explain its potential impact on decision-making, discuss whether participants believe that image compatibility plays a role in their investment choices, encourage participants to share experiences or examples where they felt that their self-image aligned or clashed with their investment decisions, ask participants to suggest ways that fund management institutions can minimize the impact of image compatibility on investment decisions, and also exploring the feasibility of implementing these strategies, such as diversifying decision-making teams, establishing clear investment processes, and fostering open communication.
4. Results and discussion
4.1. Results
The total number of questionnaires filled out and accepted by institutional respondents was 175 copies. After examining and testing the criteria for the submitted questionnaire, including the missing value imputation process, 166 institutional respondents became the sample of this study. The fund managers who represent their institution consist of 114 males and 52 females. Eighty eight of them have less than 5 years working experience, 32 fund managers have 5–10 years working experience, and 46 of the respondents have more than 10 years working experience. Furthermore, 68 of the respondents manage less than IDR 1 billion investment fund, 28 of them manage between IDR 1–5 billion investment fund, and the rest 70 respondents manage more than IDR 5 billion investment fund. Eighty one of the respondents have less than IDR 1 billion monthly transaction, 20 of them have between IDR 1–5 billion monthly transactions, while the rest 65 fund managers have more than 5 billion monthly transactions.
The presentation of the mean and standard deviation of the main research variables is intended to provide a general description of the respondents’ answers to the questions in the questionnaire. The questions used a 6-point Likert scale. The scale of 1 shows extremely negative (e.g., strongly disagree), while the scale of 6 shows extremely positive (e.g., strongly agree). The mean, standard deviation, minimum and maximum scores of the main research variables can be seen in Table . The data in this research show that the skewness is near to zero and the kurtosis is near to three that indicate normally distributed random variables.
Table 2. Mean and standard deviation variables (sample size = N = 166)
4.1.1. Measurement models
In the Overall Model Fit Test, which contains testing on how well the research model fits the data sample, the study model fulfills this measure of fit known as the Goodness-of-Fit Indices (GOFI) (Hair et al., Citation2017). Tables show the value of GOFI in bearish and bullish conditions.
Table 3. GOFI value in bearish condition
Table 4. GOFI value in bullish condition
In the validity test of the measurement model using criteria, an observed variable or indicator is a valid measure of a latent variable or has good validity if: (1) t-value≥1.96 and (2) the standardized loading factor (SLF) value ≥ 0.50 (Hair et al., Citation2017; Wijanto, 2008; Igbaria et al., 1997). The variables of this study also met the criteria. Finally, the reliability test of the measurement model is measured using 2 (two) criteria: Construct Reliability (CR) and Variance Extracted (VE) whose values in this study have met the threshold criteria: CR ≥ 0.70 and VE ≥ 0.50 (Hair et al., Citation2017).
4.1.2. Structural model testing
The structural model testing was conducted based on the research model discussed in section 2. The estimation results of the research model for institutional respondents in a bearish (negative environment) state are shown in Table while the results in a bullish (positive environment) state are shown in Table .
Table 5. Summary of hypotheses test results for research model in bearish conditions
Table 6. Summary of hypotheses test results for research model in bullish conditions
4.2. Discussion
4.2.1. The determining factors of image compatibility
The hypothesis testing results indicate that risk propensity positively impacts image compatibility, but only during bullish conditions (H1b, t-value = 2.26). As per Sitkin and Weingart (Citation1995), institutional investors who are risk-takers perceive the risk they face (risk perception) as low. This perception was later confirmed by the market, which demonstrates a continuous upward trend in share prices. As a result, institutional investors reap substantial profits and achieve their initial targets. The ease of attaining these targets indicates that the investment strategy—specifically, the portfolio’s composition of shares—becomes more compatible with the trajectory, resulting in higher image compatibility. In other words, the more risk-taking institutional investors become, the higher their image compatibility, supporting hypothesis 1b.
In bearish conditions, the average risk propensity of institutional investors is lower than in bullish conditions. However, with a score of 3.74 from a scale of 6, the mean is not exactly low. This shows that, in general, institutional investors tend to be risk takers, and their risk propensity increases when they are in a bullish condition. It is just that, in a bearish condition, investment decisions that are increasingly risky are not always compensated by positive feedback and are even more likely to become negative.
In this study, high and low investor horizons are defined, respectively, as the more long-term investors (long-term investment) and more day traders (short-term investments). The results of the descriptive analysis in Table -16 show that in a bullish condition, investor horizon tends to be higher than in a bearish condition (p < 0.05). However, a mean value below 3.0 (bearish condition = 2.65 and bullish condition = 2.88) indicates a short-term trend of investor horizon.
The redemption rate increase in bearish conditions was triggered by customers who were concerned about their investment prospects or financial difficulties. Several institutional investors in the interviews stated that around 50% of customers made withdrawals during the bearish period (January 2008–February 2010). Although not as much as during bearish conditions, redemptions still occurred during bullish conditions, especially for customers who managed to make a profit. This is because the potential loss was quite large during the bearish period, and they were worried that the potential gain would be lost again. This phenomenon is consistent with the disposition effect (Shefrin & Statman, 1985; Odean, 1998), Prospect Theory (Kahneman & Tversky, Citation1979) and a study conducted by Sitkin and Weingart (Citation1995). The existence of redemption caused institutional investors to sell some of their portfolios, even though they might still believe that the prospects would still be promising in the future.
The test results support H3 in a bearish condition (t-value = 2.02), and H3 in a bullish condition (t-value = 2.05). The existence of a positive relationship indicates that the higher institutional investors’ confidence in the trajectory, the higher the image compatibility, and the lower the belief in the trajectory, the lower the image compatibility.
In a bearish condition, institutional investors tend to tolerate a decline in performance and shift their trajectory focus to relative targets. If institutional investors believe that their portfolios will produce better performance than JCI and/or other fund management institutions, their image compatibility will be high. Conversely, if the confidence is low, the image compatibility will also be low. Meanwhile, in a bullish condition, institutional investors refocus on absolute targets without disregarding their relative targets. The positive movement of the JCI increased the confidence of institutional investors because the value of the portfolio led to its original trajectory.
The test results support H4 in a bearish condition (t-value = 3.78), and H4 in a bullish condition (t-value = 3.01). The positive relationship indicates that the higher the confidence of institutional investors in the portfolios they manage, the higher the image compatibility, and the lower the confidence, the lower the image compatibility. The proofing of H3 and H4 is empirical evidence of the application of the Image Theory cognitive processes in the Indonesian equity market.
In both bearish and bullish market conditions, institutional investors who have confidence in the future prospects of their share compositions are more likely to believe in their portfolio’s ability to achieve its intended trajectory. This confidence translates to higher image compatibility. While minor adjustments may be made, such as replacing less promising shares, the overall investment strategy is typically maintained. This highlights the importance of investor confidence in the perceived compatibility between the investment strategy and the desired outcome.
4.2.2. The different effect of image compability on escalation of commitment in bullish and bearish condition
The results of hypotheses testing show that image compatibility only affects EoC when it is in a bullish condition (H5b, t-value = 6.61), and the effect is positive. Meanwhile, in a bearish condition, image compatibility has no relationship and influence on EoC. In this case, H5a which says “in the negative frame, image compatibility has no effect on escalation of commitment” is a representation of H0, not H1 (alternative). This is statistically possible, and with t-value = −0.97, H0 cannot be rejected, which means that H5a is supported.
During bearish market conditions, the persistent downward trend in share prices presents challenges for institutional investors seeking capital gains. However, investors with high image compatibility remain confident in the future prospects of the stocks within their portfolios. They believe that despite the current decline, share prices will eventually rebound. As a result, the majority of their stock portfolios are retained. Portfolio evaluations are still conducted during these conditions, primarily focusing on optimizing portfolio positions by identifying promising stocks to add and underperforming stocks to discard. The authors contend that decisions driven by high image compatibility can be considered rational, as they are based on thorough planning and forecasting analysis rather than psychological or social factors. Consequently, Escalation of Commitment (EoC) behavior exhibited by investors with high image compatibility is influenced by rational determinants.
4.2.3. The effect of escalation of commitment on investment performance
The test results support H6a in a bearish condition (t-value = −3.11), and also support H6b in a bullish condition (t-value = 2.63). The evidence for H6a in bearish conditions is consistent with existing literature, for example Sleesman et al. (Citation2018), Bockner and Rubin (1985), Staw (1976), Staw & Ross (1987), which indicate that the higher the EoC intensity, the more negative the performance tends to be. In general, it can be understood that when stock prices are in a declining trend, the value of the investors’ portfolio will continue to be smaller over time, so the time and financial escalation that is carried out lead to even greater losses.
As discussed earlier, Escalation of Commitment (EoC) behavior can also occur during bullish market conditions. Despite relatively high uncertainty, some potential gains may not be immediately liquidated. The authors argue that institutional investors perceive their portfolios as having strong prospects and prefer not to lose their positions in terms of relative performance measures. In bullish conditions, institutional investors are more likely to exhibit high image compatibility, leading to more rational decision-making. Consequently, the resulting performance also tends to be positive. Test results demonstrate that in bullish conditions, the more escalation is pursued, the better the performance outcome, thus supporting hypothesis H6b in a bullish context. This finding highlights the importance of rational considerations in driving positive performance during periods of market growth.
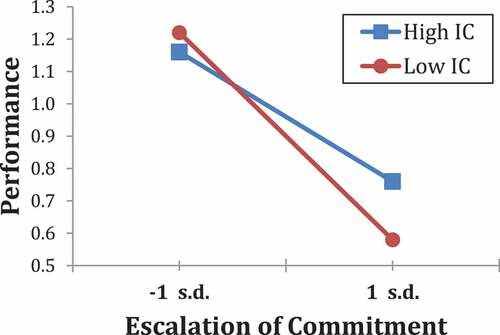
The test results show that image compatibility moderates the relationship between EoC and performance (supporting H7). With the sub-sample method, when the image compatibility is low, there is a negative relationship between EoC and performance (t-value = −3.37). This finding is consistent with H6a. Meanwhile, when image compatibility is high, there is no significant relationship between EoC and performance (t-value = −1.86). Then, it can be concluded that H7 is supported. The path diagram of the Escalation of Commitment (EC) and Performance (PF) relationship when Image Compatibility (IC) is low and IC is high can be represented by the linear mathematical equation as follows:
IC low:PF = −0.32 EC + 0.90
IC high:PF = −0.20 EC + 0.96
From the two linear equations, a graph of the relationship between EoC and performance can be drawn as shown in Figure . It is apparent that when the image compatibility is low, the slope of the EoC relationship and performance is greater (downward) than when the image compatibility is high.
Figure 6. Moderating effect of image compatibility.
5. Conclusion
The process of strategy formation is shaped by three key elements: the manager’s attributes, the environment, and the nature of the problem at hand. In this study, we examine how the characteristics of managers, specifically institutional investors, influence strategy development by focusing on their risk propensity. Risk propensity is determined by both trans-situational factors (such as age, education, wealth, and income) and situational factors. In addition, the environment plays a critical role in strategy formation, with explicit representation through the behaviors of individual investors and the overarching conditions of the market, such as periods of crisis or post-crisis. Implicit environmental factors, such as industry characteristics and regulatory frameworks, also impact strategy formation. By understanding the interplay of these elements, we can gain insights into the cognitive structures of managers (institutional investors) that inform their perceptions and ultimately guide them towards the selection of strategies that yield positive performance.
The results show that image compatibility can be used to predict strategy performance. The higher the image compatibility, the more positive the performance. Image compatibility is the alignment between value, trajectory, and strategy image. Each image (cognitive structure) generally has a positive effect on image compatibility. This indicates that Image Theory can be applied (applies) to the real equity market, especially in Indonesia. Various literatures say that EoC behavior often occurs in organizational environments, for instance Kalmanovich-Cohen et al. (Citation2018), Chulkov and Desai (2005), Keil (1995), Ross and Staw (1993). In relation to strategic management, the organization in question is a profit-oriented business enterprise. This study shows that EoC is not always associated with more negative performance because it can result in more positive performance in high image compatibility.
The results of this study provide theoretical implications that image compatibility may play a role in mediating the debate about the determinants of EoC as stated by Sleesman et al. (Citation2018) and Brockner (1992). Some researchers, such as Röber (Citation2020), Arkes and Blumer (1985), Brockner and Rubin (1985), Staw (1976), and Teger (1980), prefer to use non-rational determinants (for instance, psychological and social factors), while other researchers, such as Eliens et al. (2018), Bowen (1987), Levi (1982) and Rubin and Brockner (1975), explain EoC behavior with more rational determinants. Based on the study findings, if the decision-maker with high image compatibility does EoC, it can be concluded that the determinant is rational. This is because the decision-maker has calculated the plan and forecasting to realize the trajectory image. On the other hand, if the image compatibility is low, it is predicted that the plan will not be able to realize the trajectory image. If the plan is maintained, then this is motivated by non-rational factors. Thus, this study provides an alternative explanation for the occurrence of EoC and its impact on performance.
In terms of managerial implications, this study demonstrates that high image compatibility arises when decision-makers can effectively present logical plans and forecasts to achieve a particular goal or trajectory. To support this assertion, insights were drawn from fund management institutions. In an in-depth interview, a company leader explained that while WMI has the authority to manage its clients’ funds, collective decision-making is necessary when share prices experience significant fluctuations. When share prices drop dramatically or rise sharply in a short time, psychological and social factors may become dominant, particularly if WMI has exerted considerable effort to persuade clients to purchase the shares. Furthermore, individual decision-makers within WMI have multiple targets, including absolute and relative performance targets as well as personal goals, such as maintaining their status. These targets can vary and occasionally conflict with one another. The key insight derived from this scenario is the crucial need for companies to establish robust governance structures before deciding whether to engage in or avoid Escalation of Commitment (EoC). By implementing strong governance, organizations can better manage the influence of psychological and social factors on decision-making, ultimately leading to more informed choices.
The findings show us practical contribution that in the context of decision-making, high image compatibility occurs when a decision-maker’s choices are highly consistent with their personal values, beliefs, and how they perceive themselves. When there is high image compatibility, individuals are more likely to make decisions that affirm their self-image, even if those choices might not necessarily be the most logical or optimal. This can be influenced by various factors, such as personal values, past experiences, and expectations from others. For example, a fund manager with a self-image of being a conservative investor might consistently make low-risk investment decisions, even when the market presents opportunities for higher returns with calculated risks. This high image compatibility may lead to suboptimal investment performance as the manager’s personal self-image drives their decision-making instead of a comprehensive analysis of the market conditions.
It is essential for organizations to recognize the impact of high image compatibility on decision-making and implement strategies to ensure that decisions are made objectively and in the best interest of the company or its clients. When the market is in bearish condition, this study shows that high escalation of commitment results in low investment performance. In contrast, in bullish market condition, the high escalation of commitment provides high investment performance. Therefore, in bearish market condition, it is better to conduct group decision-making rather than individual decision-making in order to prevent the negative effect from individual high image compatibility and maintain the investment performance.
Disclosure statement
No potential conflict of interest was reported by the authors.
References
- Abatecola, G., & Cristofaro, M. (2018). Hambrick and Mason’s “Upper Echelons Theory”: Evolution and open avenues. Journal of Management History, 26(1), 116–22. https://doi.org/10.1108/JMH-02-2018-0016
- Akhtar, F., Thyagaraj, K. S., & Das, N. (2018). The impact of social influence on the relationship between personality traits and perceived investment performance of individual investors: Evidence from Indian stock market. International Journal of Managerial Finance, 14(1), 130–148. https://doi.org/10.1108/IJMF-05-2016-0102
- Bateman, T. S., & Zeithaml, C. P. (1989). The psychological context of strategic decisions: A test of relevance to practitioners. Strategic Management Journal, 10(6), 587–592.
- Cristofaro, M. (2020). “I feel and think, therefore I am”: An Affect-Cognitive Theory of management decisions. European Management Journal, 38(2), 344–355. https://doi.org/10.1016/j.emj.2019.09.003
- Drury‐grogan, M. L. (2017). Decision Making Processes in Organizations. The International Encyclopedia of Organizational Communication (pp. 1–21). Wiley. https://doi.org/10.1002/9781118955567.wbieoc055
- Dunegan, K. J., Duchon, D., & Ashmos, D. (1995). Image compatibility and the use of problem space information in resource allocation decisions: Testing a moderating effects model. Organizational Behavior and Human Decision Processes, 64(1), 31–37.
- Duxbury, D., Gärling, T., Gamble, A., & Klass, V. (2020). How emotions influence behavior in financial markets: A conceptual analysis and emotion-based account of buy-sell preferences. European Journal of Finance, 26(14), 1417–1438. https://doi.org/10.1080/1351847X.2020.1742758
- Eliëns, R., Eling, K., Gelper, S., & Langerak, F. (2018). Rational versus intuitive gatekeeping: Escalation of commitment in the front end of NPD. Journal of Product Innovation Management, 35(6), 890–907. https://doi.org/10.1111/jpim.12452
- Eze, S. C., Olatunji, S., Chinedu-Eze, V. C., & Bello, A. O. (2018). Key success factors influencing SME managers’ information behaviour on emerging ICT (EICT) adoption decision-making in UK SMEs Sunday C. Eze, Sulaimon Olatunji, Vera C. Chinedu-Eze, Adenike O. Bello. The Bottom Line, 31(3/4), 250–275. https://doi.org/10.1108/BL-02-2018-0008
- Haas, M. L. (2001). Prospect theory and the Cuban missile crisis. International Studies Quarterly, 45(2), 241–270.
- Hair, J. F., Jr., Matthews, L. M., Matthews, R. L., & Sarstedt, M. (2017). PLS-SEM or CB-SEM: Updated guidelines on which method to use. International Journal of Multivariate Data Analysis, 1(2), 107–123. https://doi.org/10.1504/IJMDA.2017.087624
- Hambrick, D. C., & Mason, P. A. (1984). Upper echelons: The organization as a reflection of its top managers. Academy of Management Review, 9(2), 193–206.
- Hettich, E., & Kreutzer, M. (2021). Strategy formation across organizational boundaries: An interorganizational process model. British Journal of Management, 32(1), 147–199. https://doi.org/10.1111/1467-8551.12473
- Hinojosa, A. S., Gardner, W. L., Walker, H. J., Cogliser, C., & Gullifor, D. (2017). A review of cognitive dissonance theory in management research: Opportunities for further development. Journal of Management, 43(1), 170–199. https://doi.org/10.1177/0149206316668236
- Huang, T. Y., Souitaris, V., & Barsade, S. G. (2019). Which matters more? Group fear versus hope in entrepreneurial escalation of commitment. Strategic Management Journal, 40(11), 1852–1881. https://doi.org/10.1002/smj.3051
- Jain, G., Gaeth, G. J., Nayakankuppam, D., & Levin, I. P. (2020). Revisiting attribute framing: The impact of number roundedness on framing. Organizational Behavior and Human Decision Processes, 161, 109–119. https://doi.org/10.1016/j.obhdp.2020.04.006
- Jeong, M., Zo, H., Lee, C. H., & Ceran, Y. (2019). Feeling displeasure from online social media postings: A study using cognitive dissonance theory. Computers in Human Behavior, 97, 231–240. https://doi.org/10.1016/j.chb.2019.02.021
- Jonsson, S., Söderberg, I. L., & Wilhelmsson, M. (2017). Households and mutual fund investments: Individual characteristics of investors behaving like contrarians. Journal of Behavioral and Experimental Finance, 15, 28–37. https://doi.org/10.1016/j.jbef.2017.07.002
- Jurczyk, V., Fröber, K., & Dreisbach, G. (2019). Increasing reward prospect motivates switching to the more difficult task. Motivation Science, 5(4), 295. https://doi.org/10.1037/mot0000119
- Kahneman, D., & Tversky, A. (1979). On the interpretation of intuitive probability: A reply to Jonathan Cohen. Cognition, 7(4), 409–411.
- Kajtazi, M., Cavusoglu, H., Benbasat, I., & Haftor, D. (2018). Escalation of Commitment as an Antecedent to Noncompliance with Information Security Policy. Information and Computer Security, 26(2), 171–193. https://doi.org/10.1108/ICS-09-2017-0066
- Kalmanovich-Cohen, H., Pearsall, M. J., & Christian, J. S. (2018). The effects of leadership change on team escalation of commitment. The Leadership Quarterly, 29(5), 597–608. https://doi.org/10.1016/j.leaqua.2018.03.004
- Kim, D., Kim, H. D., Joe, D. Y., & Oh, J. Y. J. (2020). Institutional investor heterogeneity and market price dynamics: Evidence from investment horizon and portfolio concentration. Journal of Financial Markets, 54, 100604. https://doi.org/10.1016/j.finmar.2020.100604
- Klein, H. J. (1989). An integrated control theory model of work motivation. Academy of Management Review, 14(2), 150–172.
- Laureiro‐martínez, D., & Brusoni, S. (2018). Cognitive flexibility and adaptive decision‐making: Evidence from a laboratory study of expert decision makers. Strategic Management Journal, 39(4), 1031–1058. https://doi.org/10.1002/smj.2774
- Lee, J. S., Keil, M., & Wong, K. F. E. (2018). Does a tired mind help avoid a decision bias? The effect of ego depletion on escalation of commitment. Applied Psychology, 67(1), 171–185. https://doi.org/10.1111/apps.12109
- Levi, A. S., & Whyte, G. (1997). A cross-cultural exploration of the reference dependence of crucial group decisions under risk: Japan's 1941 decision for war. The Journal of Conflict Resolution, 41(6), 792–813.
- Lewellen, W. G., Lease, R. C., & Schlarbaum, G. G. (1977). Patterns of investment strategy and behavior among individual investors. The Journal of Business, 50(3), 296–333.
- Liao, H., Mi, X., & Xu, Z. (2020). A survey of decision-making methods with probabilistic linguistic information: Bibliometrics, preliminaries, methodologies, applications and future directions. Fuzzy Optimization and Decision Making, 19(1), 81–134. https://doi.org/10.1007/s10700-019-09309-5
- Mitchell, T. R., & Beach, L. R. (1990). “… Do I love thee? Let me count…” Toward an understanding of intuitive and automatic decision making. Organizational Behavior and Human Decision Processes, 47(1), 1–20.
- Nadeem, M. A., Qamar, M. A. J., Nazir, M. S., Ahmad, I., Timoshin, A., & Shehzad, K. (2020). How Investors Attitudes Shape Stock Market Participation in the Presence of Financial Self-Efficacy. Frontiers in Psychology, 11, 553351. https://doi.org/10.3389/fpsyg.2020.553351
- Ng, E. S., & Sears, G. J. (2020). Walking the talk on diversity: CEO beliefs, moral values, and the implementation of workplace diversity practices. Journal of Business Ethics, 164(3), 437–450. https://doi.org/10.1007/s10551-018-4051-7
- Nguyen, L., Gallery, G., & Newton, C. (2019). The joint influence of financial risk perception and risk tolerance on individual investment decision‐making. Accounting & Finance, 59(S1), 747–771. https://doi.org/10.1111/acfi.12295
- Nobre, L. H. N., Grable, J. E., Silva, W. V. D., & Nobre, F. C. (2018). Managerial risk taking: A conceptual model for business use. Management Decision, 56(11), 2487–2501. https://doi.org/10.1108/MD-09-2017-0892
- Nouri, P. (2020). That’s why they didn’t let it go: Exploring the roots of women entrepreneurs’ escalation of commitment. Journal of Entrepreneurship in Emerging Economies, 13(2), 213–230. https://doi.org/10.1108/JEEE-02-2020-0034
- Ogbeibu, S., Senadjki, A., & Gaskin, J. (2020). Organisational cultures and the evoked effects of leader ability on employee creativity. American Journal of Business, 35(3/4), 153–173. https://doi.org/10.1108/AJB-09-2019-0068
- Ohlert, C. R., & Weißenberger, B. E. (2020). Debiasing escalation of commitment: The effectiveness of decision aids to enhance de-escalation. Journal of Management Control, 30(4), 405–438. https://doi.org/10.1007/s00187-019-00290-z
- Penney, C., Vardaman, J., Marler, L., & Antin-Yates, V. (2019). An image theory of strategic decision-making in family businesses. Journal of Family Business Management, 9(4), 451–467. https://doi.org/10.1108/JFBM-05-2019-0032
- Riley, W. B., Jr., & Chow, K. V. (1992). Asset allocation and individual risk aversion. Financial Analysts Journal, 48(6), 32–37.
- Röber, B. (2020). Escalating internationalization decisions: Intendedly rational, but only limitedly so? Business Research, 13(2), 455–484. https://doi.org/10.1007/s40685-019-0098-2
- Sitkin, S. B., & Weingart, L. R. (1995). Determinants of risky decision-making behavior: A test of the mediating role of risk perceptions and propensity. Academy of Management Journal, 38(6), 1573–1592.
- Sleesman, D. J., Lennard, A. C., McNamara, G., & Conlon, D. E. (2018). Putting escalation of commitment in context: A multilevel review and analysis. The Academy of Management Annals, 12(1), 178–207. https://doi.org/10.5465/annals.2016.0046
- Sultana, S., Zulkifli, N., & Zainal, D. (2018). Environmental, Social and Governance (ESG) and Investment Decision in Bangladesh. Sustainability, 10(6), 1–19. https://doi.org/10.3390/su10061831
- Thywissen, C., Pidun, U., & Zu Knyphausen-Aufseß, D. (2018). Process matters—the relevance of the decision making process for divestiture outcomes. Long Range Planning, 51(2), 267–284. https://doi.org/10.1016/j.lrp.2017.04.002
- Tversky, A., & Kahneman, D. (1981). The framing of decisions and the psychology of choice. Science, 211(4481), 453–458.
- van Assen, M. F. (2020). Empowering leadership and contextual ambidexterity–the mediating role of committed leadership for continuous improvement. European Management Journal, 38(3), 435–449. https://doi.org/10.1016/j.emj.2019.12.002
- Xu, F., & Akther, T. (2019). A Partial Least-Squares Structural Equation Modeling Approach to Investigate the Audit Expectation Gap and Its Impact on Investor Confidence: Perspectives from a Developing Country. Sustainability, 11(20), 5798. https://doi.org/10.3390/su11205798
- Yang, J., Zhang, W., & Chen, X. (2019). Why do leaders express humility and how does this matter: A rational choice perspective. Frontiers in Psychology, 10, 1925–1937. https://doi.org/10.3389/fpsyg.2019.01925
- Zhou, W., & Xu, Z. (2018). Portfolio selection and risk investment under the hesitant fuzzy environment. Knowledge-Based Systems, 144, 21–31. https://doi.org/10.1016/j.knosys.2017.12.020
- Zorn, M. L., DeGhetto, K., Ketchen, D. J., Jr., & Combs, J. G. (2020). The impact of hiring directors’ choice‐supportive bias and escalation of commitment on CEO compensation and dismissal following poor performance: A multimethod study. Strategic Management Journal, 41(2), 308–339. https://doi.org/10.1002/smj.3092