
Abstract
In this paper the virus theory is applied to gain insight into the intra-organizational diffusion and evolution of the Balanced Scorecard. The study draws on longitudinal data about the use of the Balanced Scorecard in a Norwegian bank, by interviews with managers and rich internal documents. The findings suggest that virus theory offers a diverse set of theoretical mechanisms that can describe a multitude of organizational processes in the evolution of a management idea. Specifically, it is found that the case organization was infected directly through top management´s contact with the idea and indirectly through an external institution. Interestingly, there was an incubation period and the idea was lingering in the organization without implementation. However, organizational immunity to the idea was averted by management, and new routines and structures led to replication. Furthermore, the idea mutated to resemble more a measurement than a strategical tool. The concept was eventually deactivated in the organization but may still lie dormant. The paper concludes that virus theory is well-suited for analysing the intra-organizational diffusion and evolution of management ideas. In this way, virus theory can fill in some of the blind spots of management fashion theory.
1. Introduction
1.1. Diffusion and evolution of management ideas
A range of different theoretical perspectives have been used to study the diffusion, evolution, and adoption of management ideas (Busco et al., Citation2015; Johanson & Madsen, Citation2019; Scheuer, Citation2021; Sturdy et al., Citation2019; Sturdy, Citation2004; Wæraas, Citation2021). The management fashion theory (MFT) has had a particularly dominant position in focusing on trends in diffusion and evolution at the macro-level and rise and fall in popularity in the marketplace for management concepts and ideas (Abrahamson & Piazza, Citation2019; Madsen & Slåtten, Citation2015; Perkmann & Spicer, Citation2008; Piazza & Abrahamson, Citation2020). There have been many studies employing MFT, providing insights into the diffusion and evolution of management ideas (Aksom, Citation2017; Ax & Ax, Citation2021; Berg & Madsen, Citation2020). However, there has been less attention to the post-adoption phase. The period in which the adoption decision has been made and organizations make sense of, adapt, and contextualize the ideas.
Røvik’s (Citation2011) virus theory offers an alternative approach to the diffusion and evolution of management ideas. The virus theory draws on the salient features of a virus to metaphorically describe the processes that take place when a management idea enters an organization. According to Røvik (Citation2011), the theory offers a complex and sophisticated framework of organizational idea-handling mechanisms, processes, and outcomes. The purpose of this research paper is to demonstrate the applicability of the virus theory in an empirical setting, evaluate its merits vis-à-vis MFT in studies of diffusion and evolution of management ideas, and develop insights into some of the less refined aspects of the theory.
The paper describes and theorizes about the development of the Balanced Scorecard (BSC) in an organization. The BSC is a management accounting idea that was introduced in 1992 by Kaplan and Norton as a new multi-dimensional performance measurement system (Kaplan & Norton, Citation1992). The BSC quickly attracted much attention in the business world and became highly fashionable (Ax & Bjørnenak, Citation2005; Cooper et al., Citation2017; D. Ø. Madsen & Slåtten, Citation2015). However, thirty years later, the BSC is still one of the most popular management ideas among companies around the world (Rigby & Bilodeau, Citation2018; Tawse & Tabesh, Citation2022). The BSC has also been a popular research topic among accounting and management researchers and there is a large body of literature about the concept’s development and use across organizations, industries, and countries (Hoque, Citation2014; Kumar et al., Citation2022).
1.2. Research questions and contribution
The virus theory can be applied on different levels, such as intra-organizational, inter-organizational, national, and global level (Johanson & Madsen, Citation2019). Here, the theory is applied at the intra-organizational level. This case study analyzes the development and evolution of the BSC in Sparebanken Vest (SPV), Norway’s second oldest bank. The study traces how the BSC was introduced in the organization, and how it has developed throughout two decades. The scope of this research is to describe and analyze the trajectory of the BSC in SPV using the characteristics and idea-handling mechanisms of the virus theory.
This study is one of the first longitudinal studies applying the virus perspective in studies of management ideas. So far, there is a limited number of studies that have explicitly utilized the virus perspective (e.g., D. Ø. Madsen & Slåtten, Citation2015; Hyndman & Lapsley, Citation2016; Jevnaker & Olaisen, Citation2022a, Citation2022b; Kjeldsen, Citation2013; Obed Madsen, Citation2021; Ogata et al., Citation2018; Puyt et al., Citation2017; Quist & Hellström, Citation2012). The main research question is:
How can the virus theory contribute to understanding the diffusion and evolution of management ideas?
The research question is approached by providing an in-depth analysis of the theory in a specific case setting. The study aims to gain insight into its contribution by analysing three areas of interest and answer the following specific questions:
How can virus theory be used in analyzing the diffusion and evolution of management ideas?
How are the organizational idea-handling processes within the virus theory interrelated?
Can virus theory provide a different understanding of the diffusion and evolution of management ideas than management fashion theory?
The first research question demonstrates how virus theory can be applied in analysing the trajectory of the BSC in a case study setting. The second question elaborates on the interrelatedness of the organizational idea-handling processes in the theory. The third question explores its relative contribution in comparison to currently prevalent theories, first and foremost, MFT.
1.3. Structure
The paper is structured as follows. Section 2 outlines the theoretical framework. In Section 3 the research method is described. The historical evolution of the BSC in the SPV case is presented in section 4. Section 5 contains the analysis of the case. Section 6 discusses findings and implications for the development of virus theory. Finally, Section 7 provides concluding comments, discusses limitations, and areas for further research.
2. Theoretical framework
2.1. Virus features and corresponding idea-handling processes
Røvik (Citation2011) identifies six virus characteristics, each of which has corresponding organizational idea-handling mechanisms.
The first characteristic of a virus is infectiousness. This characteristic relates to how managers are exposed to viruses, and the formal or informal decision to adopt or reject a management idea. Research has shown that the BSC is a highly infectious idea (Andon et al., Citation2005; Busco & Quattrone, Citation2015; D. Ø. Madsen & Slåtten, Citation2015). Immunity refers to the organization’s ability to resist the virus. To this point, Bourguignon et al. (Citation2004) found that organizations in France have been resisting the BSC to a considerably larger degree than seen in other countries.
Replication refers to the continuous reproduction of management ideas in organizations. It is here crucial to have a “champion” who can sell the concept (D. Ø. Madsen & Stenheim, Citation2014). Such idea-selling procedures may involve outside experts. By convincing organizational members who are sceptical that adoption and implementation have benefits, consultants could lower organizational immunity and resistance to the management idea. Several studies have shown that consultants have played an important role in the promotion and implementation of the BSC in client organizations (Ax & Bjørnenak, Citation2005; Banchieri et al., Citation2012; D. Madsen & Slåtten, Citation2013).
A virus’s incubation period could last for an extended period. It takes time, knowledge, and resources to implement the idea. Mutation refers to translation and contextualization in the host organization. The virus perspective conceives managers as “active hosts” who often translate the management idea in terms of the language used. Consultants may also contribute to mutations by customizing and tailoring their version of the management idea to the client organization. Several studies have demonstrated the role of consultants in mutations of the BSC (Ax & Bjørnenak, Citation2005; D. Ø. Madsen, Citation2014; Wagensveld, Citation2013).
Dormancy refers to the process where a management idea is inactivated and stowed away for a period. There are several possible factors that can lead to inactivation of management ideas. One factor could be related to pitfalls and barriers in the implementation process. Implementation efforts may stall due to organizational resistance. The application of management ideas is also accompanied by large investments. It could be challenging to persuade senior management to stick with the management idea given resource requirements.
Table provides a summary of the virus features and corresponding organizational idea-handling mechanisms.
Table 1. Virus characteristics and idea-handling mechanisms
2.2. Interrelations of idea-handling mechanisms
In addition to explaining the plausibility of applying the features of viruses to idea-handling mechanisms in organizations, Røvik (Citation2011) conceptualizes interrelatedness into three types of relations: succession, tangling and competition. Succession refers to one idea-handling mechanism leading to another, thus following each other consecutively. Tangling means that some idea-handling processes could run in parallel and therefore be hard to distinguish and view in isolation. Competition refers to the possibility of idea-handling mechanisms mutually excluding one another.
3. Method
3.1. Research approach
This research paper follows a case study methodology to study the diffusion and evolution of the BSC within the Norwegian bank SPV. The main interest was to analyse the evolution of the BSC in the organization as a whole. Thus, it was purposely chosen to empirically use one case study holistically. This allowed for a more thorough in-depth analysis, which is consistent with the research questions.
The case study design is longitudinal and combines primary and secondary data sources. Most of the primary data were collected in spring 2018. Furthermore, access was obtained to interviews collected in 2004 and published in a doctoral thesis (D. Ø. Madsen, Citation2011), as well as a prior study of the case organization (Knutsen, Citation2004). Combining these different sources of data enabled a rich description of the development of the BSC in SPV, from the early contact with the BSC idea around the year 2000 until spring 2018 when new interviews were conducted.
3.2. Primary data: Interviews
All interviewees had in-depth knowledge of the BSC in SPV and held managerial positions. The interviewees were chosen on the basis of insights into the design and use of the BSC, and who had held prominent positions in somewhat different time periods. An overview of the interviews is provided in Table .
Table 2. Overview of the interviews
The interviewees were first contacted via e-mail and followed up with phone calls. Interviewees received an information letter about the research and a short-list of questions before the interview. The interviews were face-to-face meetings in the city of Bergen where the headquarter of SPV is located. The participants consented to being recorded, which facilitated the transcription of the interviews. The interviewees read the transcriptions and consented to the quotations.
3.3. Secondary data
The secondary data can be divided into three main categories. The first category is the data from SPV. The Communication Plan and The Project Mandate were documents for internal use in SPV, which provided detailed information about the implementation of the BSC in SPV.Footnote1 A PowerPoint presentation that was originally used at conferences and workshops around Norway is also used in the case description. It provided useful data about the timeline of events related to the BSC implementation in SPV. Secondly, we have used interview data from 2004 (D. Ø. Madsen, Citation2011). The third category of secondary data comprises books, articles and web-resources about SPV and the financial industry in Norway. The secondary data were useful both in preparation of the interviews and in the analysis of the case.
3.4. Data analysis
The data analysis process was divided into two stages. The first stage of the analysis was to combine the secondary data and the salient features of the virus theory to cross-reference and identify distinct themes. This substructure was then used to form the general structure for the interviews. The interview questions were coded on the basis of the six virus characteristics. The structure of the interviews focused on the narrative of the BSC in SPV without any direct reference to the virus theory. It was divided into two main parts: 1) Questions investigating the timeline of the development of the BSC in SPV, together with the use of the BSC. 2) Questions regarding specific internal and external developments in the time frame of the case study, inspired by the secondary data.
All interviews were transcribed into text. In this work, the thematic approach of the first stage was used to code the text in the primary data. The purpose was to create a narrative based on the development of the BSC in SPV and to apply the virus theory to the specific examples from the case.
In the second stage, the analysis was done in accordance with the themes of the virus framework. This was a systematic review of primary data divided into the six characteristics of the virus theory. This was followed by a further analysis with the goal of reconnecting the characteristics and creating an understanding of their interrelatedness, and the general applicability of the virus theory for the analysis of the BSC.
4. The Balanced Scorecard in SPV
This section gives an overview of the key processes and activities that explain the evolution of the BSC in SPV. The case is presented in chronological order from the adoption and implementation of the management idea to its maturation and decline. The objective is to provide an overview with the focus on the events that are relevant for further analysis.
4.1. The idea
SPV was part of the Sparebank 1 Group until 31 December 2003. During this time, one of the other banks in this group, Sparebank 1 SR-Bank became involved with the BSC idea. This created an opportunity for SPV to become somewhat familiar with the concept.
Sparebank 1 SR-Bank was one of the first organizations in Norway to implement the BSC (Gjelsvik, Citation2004). The financial director of the SR-Bank had been to a seminar with Kaplan and Norton in 1996 and read their book (Kaplan & Norton, Citation1996) about the BSC idea. He had recently been assigned as responsible of strategic operations in the bank and was looking for tools that could achieve strategic goals. The financial director initiated discussions about introducing the BSC in the bank, although it took almost a year before the bank´s CEO became involved. However, the CEO soon became passionate about implementing the BSC in the SR-Bank (Gjelsvik, Citation2004). The process began in the late spring of 1997 when the CEO purchased copies of Kaplan and Norton’s book for the management team and initiated workshops to clearly define strategic objectives.
There was knowledge about the BSC concept in the Sparebank 1 Group, although the idea did not catch on in the whole group/alliance of banks. According to interview records (Interview, Citation2004) with the BSC coordinator who was responsible for developing the concept in SPV, the contact with the BSC occurred in the late 1990s when the CEO of SPV (CEO, 1990–2006) developed an interest in the management concept.
I believe it was he who started to play with the idea and think that it might not be so stupid, but that we had to do some strategic work first.
During that time, SPV was moving towards becoming a more sales-oriented organization. This may have caused interest in new management tools. It has not been possible to trace back the interest in the BSC directly to the implementation in the SR-Bank, but there is a possibility that the CEO of SPV had heard about the BSC at meetings as a part of the group/alliance of banks.
Another interviewee (Interview 2) tracks contact with the BSC to the early 2000 when the management group of SPV heard about the concept from two professors at the Norwegian School of Economics (NHH)
I believe we had some leader meetings, where there were impulses from the NHH. It is possible that it was not about Balanced Scorecards, but I believe it was. (Interview 2)
This contact coincided with a difficult time in the financial sector characterized by increased competition, caused by internet banking and non-financial institutions entering traditional banking markets. Increased competition led to lower profit margins, which in turn resulted in more focus on cost-effective operations. SPV was at this time seen as a bank relatively heavy on costs. The BSC could set focus on cost reduction and help incorporate several perspectives of operations into an integrated system that appealed to top management. One interviewee describes this period as follows.
There were a couple of tough years from 2000 and onwards. Among the main factors were losses on loans. There was tough competition between the banks, and the Balanced Scorecard was considered suitable for implementing and operationalizing the bank’s strategy. (Interview 2)
As the paragraph shows, there was some uncertainty about the moment of initial contact with the BSC. On the basis of the information above, the BSC was introduced to SPV around the turn of the millennium.
4.2. The decision to implement the Balanced Scorecard in SPV
The formal process of adopting the BSC in SPV started in spring 2001 and involved several phases. In 2001, in an internal info letter, the BSC was described as ´a tool that made it possible to measure several relevant dimensions and gave a simple and holistic understanding of the situation in the organization´. Furthermore, in the Project Mandate management defined the necessity of introducing the BSC as “a tool that ensures the realisation of strategic goals and the vision of SPV” (Knutsen, Citation2004, p. 20). Interestingly, the goal was not only to implement the BSC as a measurement and strategic tool, but also as a motivational tool. It was, from its introduction, meant to be connected to a bonus system.
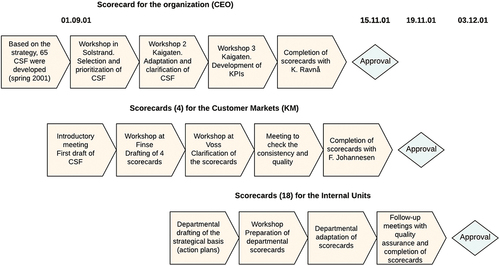
The process of setting the stage for implementation started with the creation of several target groups. The first goal was to develop ´Critical Success Factors´ (CFSs) based on the strategic goals of SPV. This led to several workshops during the second half of 2001 and resulted in the creation of the bank´s (CEOs) scorecard. Parallel to creating the scorecard for the organization, the extended management group worked out the scorecards for the Customer Markets and Internal Units. The extended management group consisted of about 40 people including regional bank management, support, as well as a a consultant from Cap Gemini Ernst & Young. The purpose of the extended management group was to lay the groundwork for the BSC and develop the Key Performance Indicators (KPIs) that derived from the strategy. The KPIs had to be specific, result oriented, realistic, simple and motivating (Roiseland, Citation2004). Moreover, the extended management group was regarded as one of the most important means for creating an understanding of the BSC among employees in different branches. The timeline for the development of scorecards is shown in Figure .
Figure 1. Timeline for the development of scorecards. Adapted from a PowerPoint presentation by SPV in 2002.
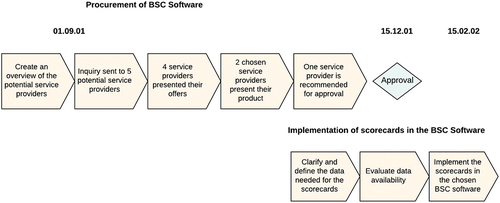
During the same time, two consultants specializing in the development of the data warehouse were involved in building an efficient data system to support the BSC (Interview, Citation2004). GE Capital provided the Cognos system. The timeline for the procurement and implementation process is shown in Figure .
Figure 2. Timeline for the procurement and implementation process of Balanced Scorecard software. Adapted from a PowerPoint presentation by SPV in 2002.
4.3. The implementation
The BSC was officially in use from January 2002 when the scorecards were rolled out in the organization. The rapid implementation was justified by developing and perfecting the BSC while using it.
The process started in 2001 and it was decided that we would have it up and running in February 2002, because the scorecards would be ready by January. The prerequisite was that it was not going to be a perfect system. It was not going to be a 100% solution. We were more focused on getting this off the ground and rather learn as we went along instead of having everything in place when we started.
After the BSC was implemented, different methods were used to update the systems and root the idea in SPV. The IT-section played a crucial role in providing the scorecards with reliable information (Interview 3). Parallel to this, considerable effort was put into spreading knowledge about the BSC and updates in the organization. This effort consisted of for example information through monthly info letters (VestAvis) and breakfast meetings.
The first version of the BSC in SPV had 92 scorecards. There were scorecards for the CEO, each administration and support unit, regional managers, and all branches. The scorecards were developed based on Kaplan and Norton´s concept. Hence, all the scorecards had the same four perspectives and causal-and-effect order. However, the scorecards were developed in Norwegian, so all terms and expressions were translated from English to Norwegian.
The scorecard process started with the corporate board setting the overall KPIs and targets for the CEO’s scorecard based on inputs from top management. Based on the CEO’s scorecard, top management set KPIs and targets for the rest of the scorecards in SPV.
The BSC was initially connected to the bonus. The introduction of the BSC did not, however, change other incentive or measurement systems in the bank. Alongside the BSC, another sales incentive system (Salgspoeng) continued to be used to increase sales of certain products. Some of the sales targets from Salgspoeng were incorporated in the BSC by creating KPIs related to new products or services.
The incentive system we had from before ran parallel to the scorecards. Reward was based on sales points, and we had sales points as one of the KPIs. You had scorecards, but also a reward system in the form of sales points. (Interview 3)
In addition, an experienced long-time employee in SPV was given the full-time responsibility as the BSC coordinator. This employee was involved in the project throughout the implementation of the BSC in SPV. The role consisted of checking the output of the data systems and verifying the results of the scorecards before they were sent out.
There were a couple of things in the beginning where my reaction was: “No, can this be right?” It was my job to receive the feedback. The system had no value if nobody trusted it. (Interview 3)
On occasion, it was necessary to travel to the offices to answer concerns related to the BSC, along with collecting feedback from users with the aim of improvement. In general, the coordinator was to ensure that the BSC was well received in SPV and that it would be the strategic tool it was intended to be.
As mentioned in the previous section, SPV was aware that problems and challenges could arise due to the fast implementation. Most of the challenges for SPV in the implementation phase derived from the bonus system. In general, many of the problems occurred due to the decision to connect the bonus payments to the scorecards early in the process.
The bonus was connected to the scorecards too early. It was done relatively fast and that created some unrest with respect to perceived inequality. In the beginning some of the KPIs were quite silly. (Interview 3)
There were three challenges with the bonus system: the model of the bonus system, i.e., how the bonus was measured and distributed within the organization, poorly defined KPIs and lastly, incompatibility of scorecards to administration and support units. The initial model of the bonus system required SPV as a bank to achieve the return-on-equity (ROE) target to pay out any bonuses, regardless of performance in the scorecards. When SPV achieved the target, 25% of the bonus was distributed among all employees, 60% of the bonus payment was distributed between the units based on scorecards, whereas the remaining 15% was distributed between individual employees based on subjective assessment.
The four perspectives; financial, customer, internal processes, and learning & growth, were weighted 30%, 30%, 20%, and 20% respectively. The distribution among the units was based on relative performance of the units, where only the units with the highest goal-achieved scorecards were awarded (Knutsen, Citation2004). Hence, there were units, which had obtained “green” values for all KPIs in their scorecards but did not receive bonus. This model lasted from 2002 to 2003. A modified bonus system was introduced from 2004. The ROE requirement was the same as before, but the distribution of the payment was changed. 30% of the bonus was distributed between all employees, while the remaining 70% of the bonus payment was distributed among all units that had achieved their targets. There was no relative comparison with other units, and the bonus payment was based only on the unit’s own performance.
Another challenge SPV frequently experienced during the initial years was poorly defined KPIs or KPIs with unintended effects. SPV experimented with both different KPIs and how the metrics of the various KPIs were calculated. One example was the KPI of “sick leave”. SPV had an organizational target of 3% for sick leave. In small local branches with only 3–4 employees, the potential sick leave rate would be 25–33% if one of the employees got sick.
When one out of three [employees] was gone then the sick leave would statistically be 33% and as wrong as it could possibly be. We promised early on to base the rewards on scorecards and when one was home sick, this led to ruining the bonus for the rest. Those at work would be irritated because you were sick and ruining the bonus. (Interview, Citation2004)
Therefore, SPV later aggregated the sick leave rate for these small offices to a regional level. It was aggregated to at least 50–100 employees.
The BSC was, as mentioned earlier, implemented in the whole organization. All bank branches had the same KPIs, while administration and support services had their own KPIs. Administration and support services served management and could not be measured in the same manner as the branches. One such department was the accounting department which could not be measured by work speed or number of sold products.
They [accounting] could choose the KPIs they knew they could deliver on. For example, deliver the budgets on the 10th of each month. That is what they have always done! So what was the motive then? It would not be any better if they delivered [the budgets] on the 3rd of each month. (Interview 3)
This led to measurements that did not contribute to improved results. These units often ended up with relatively more green indicators on the scorecards, which in turn resulted in more bonus.
There were internal satisfaction questionnaires. We had to stop those because they were too good. All scorecards were green, there was not a single yellow card among the internal units. It became apparent that it was meaningless and too much work. (Interview 3)
As a result, after three years, it was decided to stop using scorecards for the administration and support service units. The new bonus payment for these units was based on the CEO’s scorecard.
4.4. Maturation and decline of the Balanced Scorecard
After the initial challenges, management decided that the position of a BSC coordinator was no longer needed, and the position was terminated around 2008. The responsibility for the BSC was transferred to the product development department. From 2008 until 2011, there were not many changes to the BSC and the KPIs other than updates of the annual targets.
In 2011, SPV decided to strengthen its finance department and hired business controllers. At this time, the responsibility of the BSC was transferred from the product development department to the finance department. As the BSC had not been updated frequently from 2008, it became evident that several KPIs were outdated and even contradicting. Deposit growth was one such example. Historically, high deposit coverage was more beneficial for banks compared to interbank borrowing. However, that changed with the new LCR-regulations.
There were KPIs which were totally, in fact contradicting logical financial thinking (—) [SPV] measured deposit growth if I remember correctly, and it is not necessarily good. (Interview 4)
The KPI of “deposit growth” was replaced with “net interest rate”. Another example was the emphasis on new sales of insurance products. Internal documentation showed that portfolio retention had a greater impact on ROE than new sales. This led to the replacement of the KPI of “new insurance sales” with “portfolio” as KPI. In addition to changing or adjusting KPIs, the total number of KPIs was reduced as a part of a larger overhaul of measures and targets in SPV´s systems.
During this period, there were people in the management and staff who started to oppose and criticize the BSC. In 2013, the board expressed its interest in reducing the number of KPIs in the CEO scorecard. Moreover, the board was not concerned with the BSC, and there was some interest in replacing control and measurement with more dynamic management.
The board signalled that they wanted to reduce the number of KPIs, and that they were not concerned with the four perspectives of the BSC. (Interview 4)
The outcome of the discussions between the board and management was the discontinuation of the BSC as such. However, SPV has continued to use the scorecards and two perspectives as a compromise. Whereas some believed that it was enough to only measure ROE and let everything else be managed dynamically, others opposed the idea of eliminating the targets.
It was a compromise. Some thought that if you stopped measuring or if you only measured a few things, then people would not perform. So the discussion was more about whether to measure or not. Some thought that if you did not have targets with red, yellow, and green indicators, then people would perform worse. (Interview 4)
As of 2014, SPV used a management system that measured two perspectives—financial and strategic, with eight KPIs in total. The perspectives had equal weight and was requested by the board to include a maximum of four KPIs each. The financial perspective included the traditional KPIs, such as ROE and net interest rate, while the strategic perspective focused on ´must-win battles´ that often related to customers and strategic goals.
We had four [KPIs] for Retail Banking and five [KPIs] for Corporate Banking. It had been eight [in total] earlier, so it varied from year to year depending on what we needed to focus on. The reason for why we now have five [KPIs] for Corporate is that we are entering a period with a new strategy after Easter. (Interview 1)
In other respects, most of the processes have remained unchanged. The targets and suggestions for measurements were still set by the board based on the proposal from management. Most of these were based on budget decisions that had been ratified in advance. The scorecards were followed up every quarter, and the KPIs rarely change from year to year. The purpose was to create continuity and predictability for the employees. Much of the focus has been on simplifying processes and reducing time spent on measuring and changing the indicators. The overall goals were to deliver a ROE of 11% and be one of the two best savings banks in Norway. Everything else had to support those goals.
You understand that there are certain indicators important in that respect [to deliver on the two goals]. I have been a part of building these massive schemes with different targets when I have worked at other places. This has also been done here, but we have cut down on time spent on everything we don’t believe is relevant. We have simplified it. We skip much of the theoretical issues. Also, because it has been tried out before. (Interview 1)
It was still considered necessary with certain metrics in SPV. Even when new management ideas, such as Lean and Beyond Budgeting, inspired new routines in the bank, some aspects of the BSC remained present. The scorecards were used during performance reviews and the employees continued to think of goal achievement in terms of red, yellow, and green indicators.
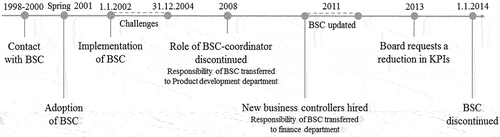
The aim of this section was to provide the empirical background for the study. The section introduced the historical background of SPV and described the development over the years. Focus has been on the development of the BSC in SPV in terms of adoption, implementation, challenges, maturation, and final decline. Figure provides a timeline depicting the major events related to the BSC in SPV.
Figure 3. Timeline depicting the major events related to the Balanced Scorecard in SPV.
5. Case analysis
Applicability of the virus theory is evaluated by formulating propositions that are directly derived from the characteristics of viruses identified by Røvik (Citation2011). These characteristics are then analysed through the corresponding organizational idea-handling mechanisms. The virus characteristics are discussed in the order proposed by Røvik (Citation2011): (1) infectiousness, (2) immunity, (3) replication, (4) incubation, (5) mutation, and (6) dormancy.
5.1. Infectiousness: Adoption
Proposition:
Organizations have an active role in becoming “infected” with management ideas.
The organizational idea-handling mechanism corresponding to infectiousness is the formal adoption of the management idea. A critical factor to determine whether virus theory offers a contribution to understanding the diffusion of ideas compared to MFT, is the notion of an active host. Here, it is crucial to examine the actions taken by the organization in the early stages of contact with the idea.
In this case, points of contact were distinguished that arguably could be occurrences of infection. Virus theory leaves some room for discretion about the definition of the active host. Here, the organization, in this case SPV, is defined as the host. The individual members, leaders, and managers of the organization are parts of the host and play a role in the process of being infected with the virus.
SPV came in contact with the BSC as a response to the strategic reforms that were taking place in the organization and the external turmoil that forced them to change in order to stay competitive.
There were some harsh times in the beginning of 2000. The work on improvement became very important. The Balanced Scorecard was seen as a suitable aid to implement and operationalize the bank´s strategy. (Interview 2)
To re-align the organization and to make better use of the strategic information, a system was needed that could be used by management and employees alike. In this sense, there was an active interest in finding a strategic tool that would fulfil those needs.
The initiative came from top management, although they needed credibility and that the rest of management [lower level] followed. It needed to be something that the top leadership believed in and the rest of management could believe in as well. (Interview 3)
Furthermore, there was a formal mandate to introduce the BSC in SPV that carried enough weight to be regarded as a formal decision to adopt the idea. The new idea spread in the organization as active translation and transformation took place. An example of this was the creation of the extended management group that was involved in building the original scorecards and worked on evaluating the CSFs. In addition, a new data system was purchased, and consultants were hired to help incorporate and adapt the systems to the organization.
Røvik (Citation2011) distinguishes between direct and indirect infection. Direct infection describes infection through contact between the manager and an idea that then continues to infect the rest of the organization. The indirect path describes the infection via intermediaries, such as consulting agencies, business schools or other agents. If the path from the BSC to SPV is based on the CEO and the interest of finding a new management tool that would help implement the new bank strategy, the infection can be classified as direct. On the other hand, if the initial contact is traced back to the meeting with the professors from NHH, the contact can be classified as indirect. There is somewhat conflicting information from the interviews and it cannot be concluded with certainty whether the initial contact was direct or indirect.
The analysis confirms that SPV had an active part in becoming ´infected´ with the BSC. They showed an active interest in the idea and created a formal mandate of the BSC adoption in SPV. Points of infection were the adoption of the BSC in an organization within the same bank group and contacts with professors from an academic institution.
5.2. Immunity: Non-adoption, isolation, expiry, rejection
Proposition:
When an idea meets an organization, it triggers reactions in the organization that can be described as one or several forms of defence mechanisms.
The organizational idea-handling mechanisms that correspond to immunity in viruses are non-adoption, isolation, expiry, and rejection. Two processes are identified as relevant to discuss in this case: isolation and rejection.
5.2.1. Isolation
When an idea reaches the organization, there is a possibility that it does not spread to the whole organization. The idea can for example reside at the management level, but actions are insufficient to carry it further to the whole organization. This can lead to isolation of the idea and the possibility of the idea dying out.
The early implementation process was top-driven. As explained earlier, there was a mandate and a proper plan for action that intended to involve the whole organization in realising the strategic goals. The scorecards were drafted for each branch. The regional scorecards functioned as personal scorecards for regional managers, but there were no individual scorecards for each employee. The process of developing the scorecards started in spring 2001. The scorecards were to be implemented already in the beginning of 2002, although it was difficult to involve all 700 employees in the organization from start.
We chose a process that did not involve all 700 employees. This would have been a hopeless process. (Interview, Citation2004)
Management was interested in following the advice from Kaplan and Norton by involving employees from several levels of the organization. This led to the formation of an extended management group of about 40 people from all regions and functions. The group worked on developing the scorecards and KPIs throughout the second half of 2001 with a consultant from one of the four largest consultancy firms. This exemplifies the desire to implement the idea properly from start, but also a compromise since not the entire organization was included in the process. Furthermore, no binding plan of action was developed for how the regional managers were expected to implement strategy and the scorecards. This created freedom for the regional managers to communicate the scorecards in their departments according to their perception, but also led to some confusion. Involvement was a problem when the targets were to be set for the year 2002.
I believe it was a good process for those who were involved, but then in December [2001] when we started to set the targets for next year’s budget, some fell off the wagon. We have some sour experiences from that time. Some of the regional bank managers did not feel they were involved in the process. (Interview, Citation2004)
The board and the steering committee decided on the targets. Some managers could not relate to the targets and had trouble communicating those to their respective units. Many of these managers turned to the coordinator with complaints about unfair treatment.
We used most of the first year to list the things users out there felt were unfair and difficult relating to, things they did not recognize. (Interview, Citation2004)
The period of confusion, when regional managers were struggling to understand and further implement the scorecards, is an example of isolation of the idea. Top management expressed a strong will to translate the idea into action, but due to miscommunication and insufficient involvement the process was compromised. This period lasted about a year from the initial target setting in December 2001. Management then assigned additional resources to increase the participation of the different regions. This eventually led to the successful implementation of the BSC and isolation of the idea was averted.
5.2.2. Rejection
The second idea-handling process that relates to immunity and which is interesting to discuss is rejection. As described in theory, this can refer both to the actions within different groups of the organization to block the idea, or to the discovery of incompatibilities when attempting to implement the idea. In the case, there is some evidence of incompatibility since employees could not fully relate to the KPIs. There was a fundamental problem in understanding which actions led to the results expected from leaders and how this was related to the strategic goals of the region as well as the organization. In an internal questionnaire about BSC knowledge, most of the employees claimed to understand the concept, but still the prevailing view was:
The BSC is probably beneficial for the bank, but what does it have to do with me? (Interview, Citation2004)
Ensuring each employee understood their role in the organization was one of the challenges during the implementation. The regional managers were responsible in creating understanding and enthusiasm for the new system in the organizational units. However, managers struggled to understand the KPI targets. In addition, managers also faced difficulties explaining the connection of the KPIs with the bonus systems. This led to communication problems with lower-level employees. Since the BSC was related to bonus payments, many employees became discontent with being rewarded according to scorecards without fully understanding how their actions related to the KPIs. Even though there was initial willingness to implement the new processes, being rewarded on confusing grounds was in direct opposition to the values of many employees. The employees had already experience with monetary incentives from a bonus system (´Salgspoeng´) that was well rooted in SPV. It was therefore important to make sure that the new bonus based on scorecards were perceived as fair for the BSC to be accepted. One of the examples of perceived unfair treatment based on scorecards was the sick leave KPI mentioned earlier in the case description. Furthermore, discrepancies in the scorecards for the internal units caused resistance. In general, the challenges regarding the bonus system that led to potential rejection derived from how the bonus was measured and distributed within the organization, as well as how the relevant KPIs were set and used in bonus payments.
The implementation issues were, however, solved by 2004. The lack of participation and miscommunication regarding the reasons for the new systems were no longer present. According to the interviewees, employees understood why they were measured on certain KPIs. One of the interviewees asserts that this was achieved through dedicated work from management to solve the implementation issues. They built routines to gather feedback from the regional managers that was analysed. As one of the interviewees put it:
There was a lot of changes in the first year of the implementation. This was intentional, because without the changes everything would have collapsed. Otherwise the managers and employees would have said that it [the feedback] was not taken into account. (Interview, Citation2004)
Thus, the implemented changes averted complete isolation and potential rejection of the BSC.
Based on the analysis it can be confirmed that when the concept of the BSC met SPV, it triggered immune responses. The corresponding idea-handling mechanisms of isolation was demonstrated by the tendency of the BSC staying at the top management level without successfully being implemented at lower levels of the organization. Rejection was demonstrated through the difficulties of explaining the connection between one’s activities and their effects on the organization and the bonus system. Both outcomes were averted because of the actions taken by top management.
5.3. Replication: Entrenchment
Proposition:
Management ideas replicate in organizations leading to new regulations, structures, and routines. This will facilitate the entrenchment of ideas.
The corresponding idea-handling mechanism of replication is entrenchment, referring to norms, practices, structures, routines, and daily activities, which affect large parts of organizations. There are two mechanisms that entrench ideas within organizations: regulation and education (Røvik, Citation2011). Whereas the first mechanism refers to pressure from external agencies, the second mechanism refers to processes initiated by the organization itself. In the Project Mandate, it was stated that the aim for implementing the BSC was to realise the strategic goals and vision of SPV using for example “strategy maps”. This could be understood as a sophisticated type of the BSC (Speckbacher et al., Citation2003).
There is no direct evidence of the regulation mechanism being of importance in SPV. There seemed to be an absence of legislation or external peer pressure to adopt and implement the BSC. However, from the interviews and secondary sources it was found that education and training were important.
Entrenchment can be further analyzed using the five principles of a strategy-focused organization (Kaplan & Norton, Citation2001). The first principle was to translate the strategy into operational measures, or KPIs. The ´Communication Plan´ and the ´Project Mandate´ prescribed how the BSC was to be introduced in the organization. These two documents specified the tasks for several groups in the implementation process, where communicating the essence of the BSC was of major importance.
The first step in the educational process was to involve an external consultant from Cap Gemini Ernst & Young. The goal was to teach and familiarize the extended management group with the BSC and its practices. Two other consultants were hired to set up a new data warehouse for the purpose of implementing the BSC. The extended management group then developed the relevant KPIs for SPV and helped translate the strategic goals into tangible outcomes that could be measured. This process was organized through several workshops that were held during 2001. The workshops were successful in translating the strategy to specific CSFs.
We [the extended management group] travelled to Finse one weekend with a fantastic consultant from Cap Gemini and worked out the relevant KPIs - the critical points related to the strategy. [We worked on] what was fundamental for the SPV and important to us. (Interview, Citation2004)
The strategy maps were used in the early stages of developing the scorecards, but were soon discarded due to high complexity. The maps contributed more to confusion than a holistic overview.
Yes, we devised strategic maps. I thought it was a bit difficult to convey those. I thought it was easier to work on specific goals. It was more important to operationalize the everyday practices. (Interview 3)
Based on this, there is evidence to claim that SPV was relatively successful in translating the strategy to operational terms but did not follow this principle to the letter. There was considerable effort into developing the CSFs and KPIs, but the use of strategic maps was very limited.
The second principle was to align the organization to the strategy. The principle was to avoid looking at the organization in separate silos according to their functions. This principle can be exemplified through changes in some of the daily activities. The usual PowerPoint presentations in management meetings were replaced by reviews of scorecards, and the focus was directed towards red and yellow KPI indicators. According to the BSC coordinator, the scorecards made it easier to visualize and present the data because the different status reports on different aspects of the bank could now be presented together in one place. This was possible with the help of integrated software and the use of dashboard-like presentations of the scorecards. It reformed how measures were used and how management meetings were held.
Of course, it [the scorecard] set the agenda. It was a fantastic tool for the manager, who could say “Here we have some red [indicators]. No credit cards were sold this month, why?” The scorecard with red, yellow, and green colors enabled communication with colleagues in a totally different manner. (Interview 3)
It is difficult to assess the direct results of using scorecards at the meetings, but there is reason to believe that it became easier to explain the overall strategy when presented as a dashboard with colour indicators. Scorecards made the information from different sources more available and easily presentable. This contributed to aligning the organization with the strategy.
The third principle was to “make the strategy everyone’s job” (Kaplan & Norton, Citation2001). As mentioned, the regional managers were responsible for educating their own employees in their respective branches. This reflected the goal in the Communication Plan of giving all employees an understanding of why the BSC was implemented as a strategic and performance management system. However, relying on the regional managers to communicate the BSC can also be seen as limiting the degree of entrenchment. Using regional managers to explain the concept, instead of educating every employee in the same manner, can be seen as a compromise from management´s side.
Involvement varied a lot and depended on the management in the respective offices. It is the same everywhere. If you are not successful in engaging middle management, you have lost. It is like that with the BSC as well. Eager managers enabled knowledge and engagement. Whoever was the manager in the office was the key to whether it worked or not. (Interview 3)
Due to insufficient education about the reasons for implementing the BSC in SPV, many employees lacked knowledge about the connections between the KPIs. They seemed to struggle with a holistic understanding of how the perspectives related to one another and to the goals of the bank. This was indicated by feedback from some of the regional offices.
‘“Couldn’t they rather have come and told us where we belong in the bigger picture? This would be more motivating than a pile of measures”’ (Interview 3)
One of the interviewees describes the BSC as a patchwork. Over the years, more and more KPIs had been introduced, without much regard to the strategy and interconnectedness of the perspectives. This could explain the employees´ view of the BSC as a measurement tool where the focus was on achieving the green targets, rather than using the targets to operationalize the bank’s strategy. Working towards the bank’s strategy through the BSC was planned to be a part of every employee’s daily work. There is little evidence showing that this was ever the case. One of interviewees suggested that this was also the result of connecting the incentive system with the scorecards too early.
One can ask whether the focus on money became the objective instead of the things that were actually measured. In that case, it was more like a measurement system and not a strategic tool. The bonus adds a dimension that can skew the goals. You add an economic carrot that becomes overly visible. (Interview 3)
The data from other interviews support this claim and show that the BSC was primarily used as a measurement tool.
There were many [employees] out there in the branch offices who did not understand how the bank´s finances were interconnected. (Interview 4)
On the other hand, it is likely that understanding of the BSC was affected by organizational position and the nature of the daily work.
At the top level, I believe that it [the BSC] was perceived more strategic than if one sat and talked with the customers the whole day. It was likely experienced in a different way for those that had more information related to the strategy at the management level, than those at the grass root level. At the grass root, I believe it was perceived more as a measurement tool (—) but at the management level it was perceived as a strategic tool. (Interview 4)
Based on the evidence above, it can be concluded that SPV did not succeed in completely following Kaplan and Norton`s prescription of successful “strategy-focused” implementation. SPV clearly managed to introduce the BSC, although it did not become as strategic as it was formulated in the Project Mandate and the Communication Plan.
The fourth principle was to make strategy a continual process. This required the company to review the strategy annually and the budget monthly and link them together. In the case study, there is little evidence to support the presence of this principle. First, in terms of strategy, the board reviewed the CEO’s scorecard regularly. However, SPV never implemented strategy maps and testing of “cause-and-effects” in the BSC was on an ad hoc basis. Secondly, SPV used annual budgets that were reviewed monthly. Some of the budget targets were reflected in the KPIs. However, there is no clear indication that budget and strategy were linked together more closely after the implementation of the BSC. Based on this, there is little indication that SPV made strategy a continuous process in the organization.
The fifth and last principle was to have a top management that enthusiastically supported the BSC. The support was clearly expressed in the Project Mandate, where top management declared the implementation of BSC as its highest priority. The interview from 2004 also clearly indicates that the initiative of the BSC in 2001 came from the CEO and the board of directors.
It [the BSC] was anchored in the top management group, and it still is. (Interview, Citation2004)
The BSC coordinator in SPV stated in the interview from 2004 that she dedicated a lot of time to the employees who had difficulties understanding how the strategy and the BSC were linked.
I travelled around in Hordaland and Sogn og Fjordane [Norwegian regions] and had meetings with all the employees and managers. (Interview 3)
This exemplifies the support and active participation of top management to create the necessary momentum for the success of the BSC.
Based on the analysis, the introduction of the BSC led to the diffusion of new structures and routines in the organization (replication). The new structures and routines partially followed the generic concept of the BSC. However, the BSC was not fully entrenched at levels below top management.
5.4. Incubation: Maturation
Proposition:
There is a period where ideas are lingering in the organization without any implementation of actual practices that lead to the materialization of the ideas.
The virus theory describes the period between the infection and the symptoms as an incubation period. One can think of the incubation period as the time between the organization´s initial contact with the idea and the materialization into organizational practice. Given this description, there is some room for interpretation. The implementation of the idea can be described through two mechanisms: “consistency rules for discourse and practise”, and “intensity” (Røvik, Citation2011).
The CEO was important in infecting SPV with the BSC. Even though it is difficult to pinpoint the actual infection moment, the CEO was open to the idea of the BSC and the infection occurred around year 2000. However, the BSC implementation process did not start before mid-2001. Thus, the BSC idea was lingering in the organization for some time. The external turmoil in 2001 increased competition and led to more difficult times for the bank. This may have accelerated the implementation work in 2001. Furthermore, even though the CEO and top management saw the potential benefits of adopting the BSC already in 2000, there is some evidence that SPV was not prepared, and that more groundwork was needed.
(—) we had to do a job first. We saw that this job was to be very clear about our strategy. (Interview, Citation2004)
This means that the lingering state could be related to formulating the overall strategy of the bank. The creation of the extended management group, weekend conferences and workshops, and formulation of the Project Mandate and Communication Plan are examples of activities that promoted the idea throughout the organization. In other words, they describe the intensity of putting the idea into practice. The intensity can be defined as high since most of the preparation work for the BSC was done in less than a year. Given that SPV was an organization spread out on the west coast of Norway with more than 50 branches, the effort to implement BSC in the whole organization was indeed fast. In addition, the work around implementing the BSC had priority according to the Project Mandate: “The project has the highest priority for top management and extra resources will be made available if needed.” The interviewees could not specify the exact budget allocated to the project but described the investment as considerable. In addition, two full time IT employees along with a BSC coordinator were dedicated to the BSC.
It [the BSC] was implemented in 2002, and given that the process started in 2001, I do not think it was a long time [in between]. It [the BSC] is relatively complex. One must have a system that can report on everything. One thing is the idea, but one must work with both the CSFs, KPIs, and have a data system that can report on all of this. I would not say that barely a year - from when we started with the technical aspects - was a long time. (Interview 2)
Based on this analysis, we can describe a period between 2000 and 2002 as a maturation process in which no actual practices that led to the materialization of the BSC were implemented. The implementation of practices occurred in 2002 when the whole organization was introduced to the BSC and the idea was put into practice through the implementation of scorecards. The mechanism that was mainly involved in the maturation process was the high intensity of actions taken to promote the idea throughout the organization from mid-2001 to 2002. There is little evidence to support that there was a decoupling of symbolic changes and actual changes. When top management felt that the organization needed to change course with the help of the BSC, actual changes came relatively quickly.
There was a relatively short incubation period in which the idea of the BSC lingered in SPV without materializing. The high intensity of then putting the idea into practice contributed to the maturation of the BSC.
5.5. Mutation: Translation
Proposition:
Management practice will be a version of the original idea that is translated to the specific organization and may differ in some respects from the theoretical idea.
SPV was influenced by several, at that time, influential publications by Kaplan and Norton (Kaplan & Norton, Citation1992, 1996, 2001). These publications outlined the core elements of the BSC.
The first core element was the presence of four perspectives: “financial”, “customer”, “internal processes”, and “learning and growth”. In updates of the BSC idea, these four perspectives have been instrumental, since much thinking and logic has been built and structured around them. The second core element was that all perspectives are linked together. More sophisticated versions of the BSC have modeled the perspectives in cause-and-effect relationships. The third core element is the idea of scorecards where all KPIs of the four perspectives are collected in one dashboard with green, yellow, and red indicators.
The virus theory asserts that changes in management ideas are expected and sometimes necessary for the idea to live on within the host organization (Røvik, Citation2011). There are different ways in which management ideas can be translated: copying, subtraction, adding, alteration and renaming.
5.5.1. Copying
According to the interviews, SPV chose to implement the BSC closely following the ideas of Kaplan and Norton.
‘There was a wish to be in accordance with the theory.’ (Interview 3)
This meant that the BSC was implemented according to the four perspectives. In addition, they started using the scorecards as dashboards where the achievement of targets was shown in different colours. The goal was to achieve all green KPIs, whereas the red KPIs marked the areas that needed extra attention. One of the main reasons for introducing the BSC to SPV was to become more strategy-focused and make strategy everybody’s work, although they were not completely successful in achieving the expected focus on strategy. Furthermore, the BSC system was connected to an incentive system, where the achievement of green KPIs was rewarded. This can be derived from the principles of a strategy-focused organization by Kaplan and Norton (Citation2001). They advise that targets and objectives should be incentivized through reward systems based on sensible and not easily manipulated measures. Because an incentive system was already in use (“Salgspoeng”), connecting the BSC with bonuses was natural since the employees had experience from financial incentives.
An indication of successful implementation is that SPV was awarded the Balanced Scorecard Award by Balanced Scorecard Forum Norway.Footnote2 The BSC coordinator in SPV was invited to speak about their experiences with the BSC over the whole country.
We have used a lot of different systems through the years to figure out whether we are doing well or not, and what we should do more or less of. However, this one withstood a lot longer. We received a number of rewards for what we had achieved. (Interview 3)
5.5.2. Further adaptations related to copying
Adaptations can be seen as adjustments within the original theory and do not deviate from the basic idea of the BSC. Even though Kaplan and Norton suggest an optimal number of KPIs and propose that the relative weighing of the perspectives should be well-balanced (Kaplan & Norton, Citation1992, 1996), they also mention that there is room for deviation in different industries and companies.
There are several examples of adaptations of the BSC in SPV. The first one was the change in the number of scorecards throughout the years. During the initial implementation, there were 92 scorecards, one for each unit and branch. In the following years, the work around setting fair targets proved to be very cumbersome for support units. As mentioned earlier, their scorecards were eventually dropped, and their bonus was attached to the CEO´s scorecard. The number of scorecards had decreased to 80 by February 2004 (Roiseland, Citation2004), and in 2011 there were about 60 scorecards.
Another adjustment related to the KPIs in each of the four perspectives. Some of the KPIs could not be measured fairly in all departments and had to be removed. Furthermore, many of the KPIs were related to specific products or services and became irrelevant as new products were introduced in the bank.
You learn while doing. There were many adjustments along the way, both in the scorecards and in the bonus system. (—) We kept the same [four] perspectives but the weighing of indicators was changed along the way. (Interview 2)
A third adjustment was the relative weighing of the four perspectives. Kaplan and Norton suggested a well-balanced weighing of the four perspectives. In SPV, there was always a certain imbalance. Possibly due to the historical use of metrics in the bank, the financial perspective was in practice given more weight than the other perspectives. This was often expressed by placing some financial measures under other perspectives where it was difficult to find KPIs.
In shortage of [good KPIs] we used portfolio [growth] in the process and customer perspectives. This makes no sense as it is a financial [measure]. This exemplifies some of the problems we had in finding good KPIs in the process and customer [perspectives]. (Interview 4)
5.5.3. Renaming
A special type of translation, which only refers to local linguistic changes, is renaming. As mentioned earlier, SPV chose to translate most of the expressions into Norwegian. Apparently, there were some regional differences with respect to the use of English terms and it was more accepted in some offices to use both languages. In some branches, on the other hand, it would have been difficult to engage employees without translating all the expressions.
There have been several expressions from English in the banking sector, and often the response was “Why on earth do we have to use it [the English expressions]? There must be a Norwegian word for it!” We expressed everything in Norwegian. (Interview 3)
5.5.4. Adding
SPV also translated the concept by adding a blue indicator in the CEO’s scorecard in 2005. The blue coloured indicator ranked above the green indicator, thus having red, yellow, green, and blue. The idea of adding another indicator was to motivate the CEO to perform even better. It should be equally hard to go from yellow to green, as to go from green to blue.
‘It was meant to stimulate for the little extra.’ (Interview 2)
This is a clear example that SPV adjusted the original concept according to its need.
5.5.5 Alteration
The changes which led to the abandonment of the BSC in 2014, can be defined as an alteration. As described in the case, the impulses from top management in 2013 led to major changes in the BSC. It was decided to focus on two perspectives: financial and strategic, with four KPIs in each. Røvik (Citation2011) defined alternation in virus theory as extensive adjustments to the original idea according to local understanding. Based on the definition, one could argue that the new management system from 2014 was an altered version of the BSC. However, when the changes are compared with the core elements of BSC, two core elements are absent. The new management system did not have four perspectives and the perspectives were not interconnected in any way. This is also supported by the statement of the current SPV employee, who claims that SPV does not use the BSC anymore. However, the employee claims there are remnants (i.e., scorecards), still present from the BSC concept. Based on this, it is difficult to define the management system from 2014 as an alteration of the BSC.
The BSC implemented was a close version of the original idea that over time was adapted to the organization. The examples of translation present in this case are copying, adding and renaming (mutations). We do not find the alteration or subtraction to be applicable in the case study.
5.6. Dormancy: Inactivation, reactivation
Proposition:
Given a long observation period, it will be possible to observe an alternation between active and inactive periods of management ideas within organizations.
The dormancy feature of the virus consists of two mechanisms: inactivation and reactivation. The organizational processes can be described as phases in which management ideas seem to fade and disappear, but then reappear in the same organization. To identify the recurrence of a management idea, one must first confirm the inactivation of the idea. In SPV, there were two processes that indicate the fading and then disappearance of the BSC.
The first process concerns the fundamental understanding of the BSC concept. Throughout the years, new employees and bank managers were hired, and these people had limited or no knowledge of the BSC. Often the new employees could not see the link between the KPIs in the scorecard and the overarching strategy of SPV. Moreover, no specific training or workshops were held regarding the BSC idea and its usage for the new employees.
Many of the bank managers did not understand its [the BSC] purpose. Most likely, they were not educated about the theory of the BSC. (Interview 4)
Fading of knowledge and understanding can be regarded as one of the processes towards the disappearance of the BSC in SPV. The second process can be described as a gradual fading of interest in the concept from top management. As concluded in the analysis of entrenchment, strong interest and support from top management in the early stages of introducing the BSC was vital in the implementation of the idea. It is difficult to pinpoint when top management started to lose interest in the BSC, although it seems related to the influence of new management ideas. Top management was invited to different conferences and presentations of new ideas, such as Beyond Budgeting and Lean Management.
Around 2013, the board was not very engaged in Balanced Scorecards (—) there was at least one [of the board members] who believed in Beyond Budgeting. (Interview 4)
In addition, the BSC had become resource heavy. The drafting of KPIs and verification of measurements had become extensive processes.
It has been a challenge. We were very detail oriented, almost to the extreme. So, we were trying to simplify and measure fewer things since we could see that it was often not beneficial to the customer. (Interview 1)
It is obvious that each department did not get customized targets. It was more like spreading out a number [between all scorecards]. With 60–70 scorecards and 20 KPIs in each it is not possible to consider everything. Then you have over-administered. (Interview 4)
This eventually led to the request from the board to start reducing the KPIs and a general simplification of measurements.
[The board] simply wanted to reduce the number of KPIs. They thought it was just too much. (Interview 4)
The diminishing understanding of the BSC concept and reduced interest from top management eventually led to the end of the BSC in 2014. Even though the BSC was described as a reasonable tool, it had turned out to be resource heavy and difficult to use.
It is not about the theory itself. There is a lot of sense in it. It is about the execution capability and the understanding of its meaning. This is what was missing (—) I believe it had survived had it been used in the correct way. (Interview 4)
Top management decided to drop three of the perspectives from their scorecards. Today, SPV then operated with two equally weighted perspectives: a financial and a strategic perspective. The strategic perspective had a set of “must-win battles”, which replaced the traditional KPIs. Moreover, the new management system did not incorporate interconnected relationships between the perspectives, but considered the two perspectives as independent sets of targets.
Today, we do not really have a BSC in the bank. We have scorecards, but not balanced according to the four perspectives. We do not have any human [learning and growth, internal processes and customer] perspective in our scorecard (—) but we have strategic and financial focus. (Interview 1)
The BSC was (as of March 2018) inactive and with no immediate plans for re-implementation.
The measurement system we have today is going to be used until we find something else, and there is no indication of something else just yet. There is a possibility that we will move away from using budgets, but this would mean that we will still have to continue measuring. Possibly in a different way, possibly measure more, but we will continue measuring. We will not go back [to the BSC]. (—) We are currently at a level we are comfortable with. (Interview 1)
There is no alternation between active and inactive periods in SPV. The BSC as idea and management system is inactive and there is no direct evidence to support that the concept has been reactivated.
6. Discussion
6.1. Applicability of the virus theory
The analysis implies that the virus theory provides a rich understanding of the processes that relate to the adoption of management ideas in the organization. This applies especially to the post-infection phase. One of the most salient elements in the virus theory is the idea of an active host (Røvik, Citation2011). Even though it was not possible to confirm the exact point of infection, the active interest in the BSC from SPV has been demonstrated. The travelling of the idea through intermediaries is also apparent in the case organization. The BSC may have infected SPV through professors at an academic institution, thereby making them the “virus carriers”. Hence, virus theory provides the possibility of describing the interaction between the demand and supply side.
In addition, by viewing the evolution of the BSC from a virus perspective, important events have been described that could otherwise have been overlooked. The processes of isolation and rejection drew attention to the difficulties in the adoption phase. However, the processes also highlighted the changes in routines and structures which facilitated the adoption and implementation of the BSC. SPV was successful in translating the strategy to operational terms by creating the extended management group and collaborating with consultants in the early stages of implementation. Due to the anchoring of the BSC in the top management group, they were successful in engaging large parts of the organization and in creating activities to build understanding of the new management concept. These are some of the specific examples of the detailed level of analysis one can conduct using the virus theory.
There are difficulties in defining some elements of the virus theory, which may or may not have affected the interpretation of certain processes. One example is the process of entrenchment where the definition of routines and structures allows for several interpretations. In this study, the influential work by Kaplan and Norton (Citation2001) about the BSC was used to empirically assess the degree of entrenchment. Another example is the interpretation of implementation in relation to the maturation of an idea. The definition of practices that mark the implementation of an idea can be quite subjective and case specific. This study followed a rather strict interpretation, defining implementation as a full-scale introduction of the idea in the organization. This has direct effects on the evaluation of the length of the process and can potentially alter conclusions.
Taken as a whole, applying the virus theory on a longitudinal case study has merits. The richness of vocabulary that the framework provides makes it possible to demonstrate a variety of mechanisms and processes that other theories neglect or downplay. Based on this case study, virus theory seems suitable for in-depth studies on diffusion and evolution of management ideas as it provides a useful framework for observing the trajectories of management ideas on the micro-level of analysis.
6.2. Interrelations of idea-handling mechanisms
Following Røvik (Citation2011), there are three types of interrelations: succession, tangling, and competition. Insights from the analysis in section 5 are used here to theorize about interrelations of idea-handling mechanisms and processes.
Contact with the virus is a prerequisite for infection and adoption. Thus, the mechanism of adoption naturally precedes all other mechanisms. Inactivation, on the other hand, is a process that succeeds other processes. Adoption, entrenchment, maturation and translation have to take place before it is possible to inactivate the idea. Indeed, not all the mechanisms are relevant in every organization, but in this case study they were present and preceded the inactivation of the management idea.
Based on the analysis, the mechanisms or processes of entrenchment, maturation and translation can be viewed in parallel. On the basis of the case analysis, there is little reason to define them as competing or having to occur in a specific order. Thus, they can be view as entangled mechanisms. The entanglement of the entrenchment and translation mechanisms can be exemplified by SPV translating the vocabulary related to the BSC into Norwegian language. This most likely contributed to the entrenchment of the BSC. However, there were other copying and adding mechanisms less likely to be related to entrenchment.
The maturation stage was interpreted as the time between the adoption of the idea and the implementation of the idea into practice. Given that it is difficult to define the start and endpoints for the different translation mechanisms, it seems plausible that some of the translation processes took place in the same time period as maturation. Similarly, the empirical analysis of maturation bears resemblance to the analysis of entrenchment. The mechanism or process of entrenchment was analyzed using the routines and daily activities with the goal of aligning the organization to the overall strategy. However, strategy formulation was also important in the analysis of maturation. It is therefore possible to see those processes as being closely related and in entanglement. Furthermore, processes of immunity (rejection, isolation and expiry) could to some extent overlap with the maturation, entrenchment and translation periods. It cannot be concluded that they are mutually exclusive or in succession. In other words, they are relevant to discuss in the same time frame. Finally, theoretically, it seems possible that reactivation could be entangled with entrenchment, maturation, and translation. However, reactivation was not observed in this case study so this interrelation can neither be confirmed nor rejected.
The interrelations of the six virus characteristics is shown in Figure . This visualization of the duration of the virus and corresponding idea-handling mechanisms is based on the specific case of the BSC in SPV. The timeline depicts the trajectory of BSC in SPV. Whereas the solid lines shows processes with relatively easily defined intervals, the dashed lines represent processes with less easily defined starting and endpoints.
Figure 4. The timeline of the six virus features and their corresponding idea-handling mechanisms.
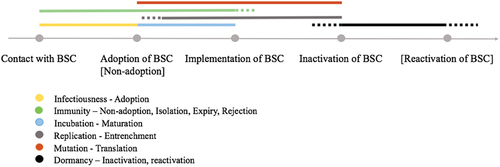
6.3. Virus theory in relation to management fashion theory
In this section, we will discuss whether Røvik’s (Citation2011) virus theory can provide a more nuanced picture in areas where fashion theory is criticized. Many different scholars have criticized MFT for an overemphasis on the supply side and assuming that organizations and managers are passive recipients (Benders & Van Veen, Citation2001; Clark, Citation2004). Generally, MFT assumes that management concepts/ideas change little when diffusing. It also assumes that there is a co-evolution between public discourse and concept diffusion (Nijholt & Benders, Citation2007).
MFT would imply that SPV was given the idea of the BSC and adopted it with very little regard to internal processes and needs. In comparison, virus theory shifts some of the focus towards the organization and gives a more detailed picture through the virus characteristics and corresponding idea-handling processes. The virus theory seeks to explain whether an organization chooses to adopt or reject an idea and how long it takes before the idea turns into practice (Røvik, Citation2011). The analysis shows that SPV was actively searching for new management ideas, rather than being a passive recipient.
Generally, MFT assumes that an idea will not change much during and after diffusion (Abrahamson, Citation1996). Some research scholars of management concepts and ideas see this as too deterministic, noting that there is interpretive flexibility (Benders & Van Veen, Citation2001). To some extent, the case organization copied the original concept of BSC developed by Kaplan and Norton (Kaplan & Norton, Citation1992, 1996, 2001). However, the picture was more complex as was illustrated in Figure . Virus theory presents four other types of mechanisms, in addition to copying (Røvik, Citation2011). This richer vocabulary enables researchers to present a more detailed picture of changes in ideas over time.
According to MFT, the staying power of ideas in organizations is linked to the level of public management discourse (Abrahamson, Citation1996). Once the public discourse around a certain idea is gone, it will also disappear from organizations. In comparison, virus theory decouples popularity from usage and allows for ideas to “stick around” although the public discourse around them has faded. In addition, the virus theory allows for the possibility that ideas can return or be resurrected despite little or no public discourse.
The analysis of SPV revealed that BSC was in use from 2002 to 2014. The Norwegian public discourse around BSC was very limited during this period (D. Ø. Madsen & Stenheim, Citation2013; D. Ø. Madsen, Citation2012). The database for Norwegian Journals, “Norart”, shows that there have been only 18 articles about the BSC from 1996–2018. According to D. Ø. Madsen (Citation2011), the BSC hype started during the late 1990s and culminated during the early 2000s. D. Ø. Madsen and Stenheim (Citation2016) use Google Trends to map the interest and awareness, i.e., hype of new concepts and ideas. Using Google Trends as a proxy for BSC hype in Norway shows that the idea lost its traction and levelled off from 2006 and onwards (see Figure ). The trend declined rapidly around year 2006. Based on MFT and the co-evolution assumption, SPV should have discontinued the BSC after 2006, but the data show that the BSC was in use for almost a decade after the decline of the public discourse.
Figure 5. Google trends showing normalized search history in all categories from 2004 to 2018 for the keywords: “Balanced Scorecard” (English) and “Balansert målstyring” (Norwegian) in the country of Norway. Data accessed 25.04.2018.

On the other hand, our research indicates that MFT may still be relevant in understanding the diffusion of management ideas. It can be recalled that one of the board members of SPV advocated Beyond Budgeting around 2013. This coincides with the period when there was intensive public discourse and high awareness (Google Trends as proxy) of Beyond Budgeting in Norway (Johanson, Citation2013). The tight coupling of diffusion and public discourse is consistent with the MFT. Furthermore, the case analysis has shown that the concept of the BSC was implemented in close resemblance to the original ideas of Kaplan and Norton. In other words, the BSC concept did not change much when diffused. This is also in line with MFT.
Based on this case, it is suggested that the virus theory can provide a more nuanced picture in areas where fashion theory is criticized. At the same time, the MFT is still highly relevant for understanding the emergence, evolution, and diffusion of management ideas. More specifically, its strength lies in understanding the diffusion and evolution of management ideas from the supply side perspective and for macro-level analyses of how fashionable ideas evolve over time (D. Ø. Madsen & Slåtten, Citation2015; Johanson & Madsen, Citation2019).
7. Conclusion
7.1. Contributions
This research paper has demonstrated how virus theory can contribute to understanding the diffusion and evolution of management ideas. The virus theory is particularly suitable for describing the multitude and diversity of organizational processes that take place in the post-implementation phase. A rich vocabulary enables researchers to describe the trajectory of management ideas at the micro-level of analysis.
The case study analysis has provided insights of how organizational idea-handling mechanisms are related. As discussed, some processes are case-specific while some can be applied more generally. The duration, coexistence, and interrelatedness of the various virus characteristics and idea-handling mechanisms were illustrated.
Finally, the virus theory offers theoretical insights that address some of the shortcomings of the MFT. The virus framework can contribute with a better understanding of the interaction between the supply and demand sides of the management fashion market and give a more nuanced picture of the processes related to the intra-organizational evolution of management ideas.
7.2. Limitations
The flexibility provided by the virus theory compared to the perhaps too deterministic features of the management fashion theory is a strength. However, the flexibility creates room for subjectivity in how the virus characteristics and corresponding idea-handling mechanisms are defined. One example is the definition of an “active host”. Possible subjectivity may result in different interpretations of the same case study and decrease the robustness of the results.
The virus theory draws on terminology which may trigger negative associations to illness and disease. Even though the term virus is only used metaphorically, it is possible that this can interfere with how the research is perceived and understood by readers. The negative associations may interfere with the data collection should the interviewees misunderstand the metaphorical use. Therefore, this study intentionally left out the vocabulary related to viruses in the data collection process. The data were collected in 2018, before the outbreak of the COVID-19 pandemic, which has brought virus terminology into the public spotlight. Terms related to viruses have been incorporated into our everyday language and conversations (Mweri, Citation2021). It is possible that the use of virus-related terms would be a greater concern had the data been collected at a somewhat later point in time.
7.3. Future research
There is limited empirical research on virus theory and its applicability in case study settings. Several directions for further studies can be identified: additional case studies to strengthen and complement the assumptions made in this paper on the applicability of virus theory; extending the analysis from a micro-level to macro-level; further investigating the uses of virus theory with respect to the supply-demand interaction of management ideas; and strengthening the robustness of virus theory by researching other management ideas.
This research paper has used longitudinal data collected about the development of the BSC in a Norwegian bank. Further studies with a longitudinal focus could give a clearer picture of possible BSC trajectories in the banking industry. Deeper insights could also be obtained using the virus framework on organizations from different industries or countries. This could reveal both meaningful applications of the theory, as well as limitations.
The virus theory was compared with MFT. This is primarily due to the prevailing dominance of MFT in research on management ideas (Piazza & Abrahamson, Citation2020). Auxiliary research could contrast the virus theory to other theoretical frameworks. This would contribute to better comprehension of supply and demand interactions in the diffusion and evolution of management ideas.
Finally, the prospect of applying the virus theory on different management ideas could shed light on the general robustness of the theory. The virus theory has been applied in the context of the BSC (D. Ø. Madsen & Slåtten, Citation2015; Ogata et al., Citation2018), Process Management (Quist & Hellström, Citation2012), SWOT analysis (Puyt et al., Citation2017), digital innovation ideas (Noesgaard et al., Citation2019), leadership ideas (Jevnaker & Olaisen, Citation2022a, 2022b) and New Public Management (Hyndman & Lapsley, Citation2016). We encourage further studies on contemporary ideas, such as Beyond Budgeting, Blue Ocean Strategy, Lean Management, or Agile Management. Richer data with respect to different management ideas could create a better understanding of how and why ideas diffuse and evolve over time.
Disclosure statement
No potential conflict of interest was reported by the authors.
Notes
1. The detailed content of the internal documents can be found in the thesis (appendices 4 and 5) by Abbas and Lepp (Citation2018).
2. “Balanced Scorecard Forum Norge” is a forum for practical implementations of the BSC. The forum was established by Magne Støvern in 1997 and focused on “Best Practice”. The forum has not been active since 2007.
References
- Abbas, A., & Lepp, S. (2018). The diffusion and evolution of Balanced Scorecard in Sparebanken Vest: A case study of Balanced Scorecard as a virus [ Thesis]. Norwegian School of Economics.
- Abrahamson, E. (1996). Management Fashion. Academy of Management Review, 21(1), 254–28. https://doi.org/10.2307/258636
- Abrahamson, E., & Piazza, A. (2019). The lifecycle of management ideas. In A. Sturdy, S. Heusinkveld, T. Reay, & D. Strang (Eds.), The Oxford Handbook of Management Ideas (pp. 42–67). Oxford University Press.
- Aksom, H. (2017). Infused with value? Trajectories, discourses and institutional constructions in beyond budgeting diffusion. International Journal of Management Concepts and Philosophy, 10(2), 199–225. https://doi.org/10.1504/IJMCP.2017.084059
- Andon, P., Baxter, J., & Mahama, H. (2005). The balanced scorecard: Slogans, seduction and state of play. Australian Accounting Review, 15(35), 29–38. https://doi.org/10.1111/j.1835-2561.2005.tb00249.x
- Ax, C., & Ax, E. (2021). When the supply side of a management accounting innovation fails–the case of beyond budgeting in Sweden. Accounting and Business Research. 52(4). 1–36. https://doi.org/10.1080/00014788.2021.1935685.
- Ax, C., & Bjørnenak, T. (2005). Bundling and diffusion of management accounting innovations – the case of the balanced scorecard in Sweden. Management Accounting Research, 16(1), 1–20. https://doi.org/10.1016/j.mar.2004.12.002
- Banchieri, L. C. (2012). Qualitative analysis of supply and demand of the balanced scorecard: Consultants versus information users. African Journal of Business Management, 6(14), 5061–5065. https://doi.org/10.5897/AJBM11.2887
- Benders, J., & Van Veen, K. (2001). What’s in a fashion? Interpretative viability and management fashions. Organization, 8(1), 33–53. https://doi.org/10.1177/135050840181003
- Berg, T., & Madsen, D. Ø. (2020). The historical evolution and popularity of activity-based thinking in management accounting. Journal of Accounting & Organizational Change, 16(3), 401–425. https://doi.org/10.1108/JAOC-03-2020-0030
- Bourguignon, A., Malleret, V., & Nørreklit, H. (2004). The American balanced scorecard versus the French tableau de bord: The ideological dimension. Management Accounting Research, 15(2), 107–134. https://doi.org/10.1016/j.mar.2003.12.006
- Busco, C., Caglio, A., & Scapens, R. W. (2015). Management and accounting innovations: Reflecting on what they are and why they are adopted. Journal of Management & Governance, 19(3), 495–524. https://doi.org/10.1007/s10997-014-9288-7
- Busco, C., & Quattrone, P. (2015). Exploring how the balanced scorecard engages and unfolds: Articulating the visual power of accounting inscriptions. Contemporary Accounting Research, 32(3), 1236–1262. https://doi.org/10.1111/1911-3846.12105
- Clark, T. (2004). The fashion of management fashion: A surge too far? Organization, 11(2), 297–306. https://doi.org/10.1177/1350508404030659
- Cooper, D. J., Ezzamel, M., & Qu, S. Q. (2017). Popularizing a management accounting idea: The case of the balanced scorecard. Contemporary Accounting Research, 34(2), 991–1025. https://doi.org/10.1111/1911-3846.12299
- Gjelsvik, M. (2004). Radikale innovasjoner og strategi. In G. Martin (Ed.), Radikale innovasjoner i etablerte foretak (pp. 210–222). Fagbokforlaget.
- Hoque, Z. (2014). 20 years of studies on the balanced scorecard: Trends, accomplishments, gaps and opportunities for future research. The British Accounting Review, 46(1), 33–59. https://doi.org/10.1016/j.bar.2013.10.003
- Hyndman, N., & Lapsley, I. (2016). New public management: The story continues. Financial Accountability & Management, 32(4), 385–408. https://doi.org/10.1111/faam.12100
- Interview. (2004). Unpublished. Interview.
- Jevnaker, B. H., & Olaisen, J. (2022a). Travelling leadership ideas as a business virus. In Reimagining Sustainable Organization: Perspectives on Arts, Design, Leadership, Knowledge and Project Management (pp. 31–54). Springer International Publishing. https://doi.org/10.1007/978-3-030-96210-4_2
- Jevnaker, B. H., & Olaisen, J. (2022b). Travelling leadership ideas as a business virus infection. In G. Enthoven, S. Rudnicki, & R. Sneller (Eds.), Towards a science of ideas: An inquiry into the emergence, evolution and expansion of ideas and their translation into action (pp. 199–218). Vernon Press.
- Johanson, D. (2013). Beyond budgeting from the American and Norwegian perspectives: The embeddedness of management models in corporate governance systems. In K. Kaarbøe, P. Gooderham, & H. Nørreklit (Eds.), Managing in Dynamic Business Environments: Between Control and Autonomy (pp. 69–91). Edward Elgar Publishing.
- Johanson, D., & Madsen, D. Ø. (2019). Diffusion of management accounting innovations: A virus perspective. Journal of Accounting & Organizational Change, 15(4), 513–534. https://doi.org/10.1108/JAOC-11-2018-0121
- Kaplan, R. S., & Norton, D. P. (1992). The balanced scorecard - Measures that drive performance. Harvard Business Review, 70(January–February), 71–79.
- Kaplan, R. S., & Norton, D. P. (1996). The balanced scorecard: Translating strategy into action. Harvard Business School Press.
- Kaplan, R. S., & Norton, D. P. (2001). The strategy-focused organization; How balanced scorecard companies thrive in the new business environment. Harvard Business School Press.
- Kjeldsen, A. K. (2013). Strategic communication institutionalized: A Scandinavian perspective. Public Relations Inquiry, 2(2), 223–242. https://doi.org/10.1177/2046147X13485329
- Knutsen, R. (2004). Balansert målstyring i Sparebanken Vest - Er “strategi blitt en hverdagsjobb for alle”? [ Thesis]. Norwegian School of Economics.
- Kumar, J., Prince, N., & Baker, H. K. (2022). Balanced Scorecard: A Systematic Literature Review and Future Research Issues. FIIB Business Review, 11(2), 147–161. https://doi.org/10.1177/23197145211049625
- Madsen, D. Ø. (2011). The impact of the balanced scorecard in the Scandinavian countries: a comparative study of three national management fashion markets [ Ph.D. Thesis, Norwegian School of Economics, Department of Strategy and Management].
- Madsen, D. Ø. (2012). The Balanced Scorecard i Norge: En studie av konseptets utviklingsforløp fra 1992 til 2011. Praktisk økonomi & finans, 4(4), 55–66. https://doi.org/10.18261/ISSN1504-2871-2012-04-06
- Madsen, D. Ø. (2014). Interpretation and use of the balanced scorecard in Denmark: Evidence from suppliers and users of the concept. Danish Journal of Management & Business, 78(3/4), 13–25.
- Madsen, D., & Slåtten, K. (2013). The role of the management fashion arena in the cross-national diffusion of management concepts: The case of the balanced scorecard in the Scandinavian countries. Administrative Sciences, 3(3), 110–142. https://doi.org/10.3390/admsci3030110
- Madsen, D. Ø., & Slåtten, K. (2015). The balanced scorecard: Fashion or virus? Administrative Sciences, 5(2), 90–124. https://doi.org/10.3390/admsci5020090
- Madsen, D. Ø., & Stenheim, T. (2013). Doing research on ´management fashions´: Methodological challenges and opportunities. Problems and Perspectives in Management, 11(4), 68–76.
- Madsen, D. Ø., & Stenheim, T. (2014). Perceived problems associated with the implementation of the balanced scorecard: Evidence from Scandinavia. Problems and Perspectives in Management, 12(1), 121–131.
- Madsen, D. Ø., & Stenheim, T. (2016). Big Data viewed through the lens of management fashion theory. Cogent Business & Management, 3(1), 1165072. https://doi.org/10.1080/23311975.2016.1165072
- Mweri, J. (2021). Corona Virus Disease (COVID-19) effects on language use: An analysis of neologisms. Linguistics and Literature Studies, 9(1), 36–47. https://doi.org/10.13189/lls.2021.090105
- Nijholt, J. J., & Benders, J. (2007). Coevolution in management fashions. Group & Organization Management, 32(6), 628–652. https://doi.org/10.1177/1059601106293781
- Noesgaard, M. S., Nielsen, J. A., Jensen, T. B., & Mathiassen, L. (2019). A virus perspective on digital innovation. IRIS: Information systems research seminar - Nokia, Tampere, Finland. https://vbn.aau.dk/en/publications/a-virus-perspective-on-digital-innovation
- Obed Madsen, S. (2021). Managementideer som en virus–hvad består det organisatoriske immunsystem af? Samfundslederskap i Skandinavien, 36(3), 140–160. https://doi.org/10.22439/sis.v36i3.6279
- Ogata, K., Spraakman, G., & Kemper, A. (2018). The Balanced Scorecard and virus-based change. Academy of Management Proceedings, 2018(1), 12154. https://doi.org/10.5465/AMBPP.2018.12154abstract
- Perkmann, M., & Spicer, A. (2008). How are management fashions institutionalized? the role of institutional work. Human Relations, 61(6), 811–844. https://doi.org/10.1177/0018726708092406
- Piazza, A., & Abrahamson, E. (2020). Fads and fashions in management practices: Taking stock and looking forward. International Journal of Management Reviews, 22(3), 264–286. https://doi.org/10.1111/ijmr.12225
- Puyt, R., Lie, F. B., & de Graaf, F. (2017). Contagious ideas and cognitive artefacts: The SWOT Analysis evolution in business. Proceedings of the BAM2017 Conference, Warwick University, UK (pp. 2–19). https://research.hva.nl/en/publications/contagious-ideas-and-cognitive-artefacts-the-swot-analysis-evolut
- Quist, J., & Hellström, A. (2012). Process management as a contagious idea: A Contribution to røvik’s virus-inspired theory. International Journal of Public Administration, 35(13), 901–913. https://doi.org/10.1080/01900692.2012.686034
- Rigby, D., & Bilodeau, B. (2018). Management Tools & Trends. https://www.bain.com/contentassets/f8361c5cd99e4f40bbbf83c17d6a91b9/bain_brief-management_tools_and_trends.pdf.
- Roiseland, M. (2004, February). Pedagogisk og god styringsmodell. Økonomisk Rapport Magasin. https://dagensperspektiv.no/nyheter/jobb_og_ledelse/-pedagogisk-og-god-styringsmodell-
- Røvik, K. A. (2011). From Fashion to Virus: An alternative theory of organizations’ handling of management ideas. Organization Studies, 32(5), 631–653. https://doi.org/10.1177/0170840611405426
- Scheuer, J. D. (2021). How ideas move: Theories and Models of translation in organizations. Routledge.
- Speckbacher, G., Bischof, J., & Pfeiffer, T. (2003). A descriptive analysis of the implementation of balanced scorecards in German-speaking countries. Management Accounting Research, 14(4), 361–388. https://doi.org/10.1016/j.mar.2003.10.001
- Sturdy, A. (2004). The adoption of management ideas and practices. Theoretical perspectives and possibilities. Management Learning, 35(2), 155–179. https://doi.org/10.1177/1350507604043023
- Sturdy, A., Heusinkveld, S., Reay, T., & Strang, D. (2019). The Oxford Handbook of Management Ideas. Oxford University Press.
- Tawse, A., & Tabesh, P. (2022). Thirty years with the balanced scorecard: What we have learned. Business Horizons, 66(1), 123–132. https://doi.org/10.1016/j.bushor.2022.03.005
- Wæraas, A. (2021). Understanding change in circulating constructs: Collective learning, translation and adaptation. The Learning Organization, 28(1), 1–14. https://doi.org/10.1108/TLO-08-2020-0140
- Wagensveld, J. (2013). The travel and translation of balanced scorecards. PhD thesis, Radboud University Nijmegen. https://repository.ubn.ru.nl/bitstream/handle/2066/101048/101048.pdf