
Abstract
Semantic analysis is becoming increasingly important not only in computing but also in the business world. The purpose of the current study is to apply semantic network analysis to the service industry, one of the economic sectors. To learn more about the crowded environment in the service sector, the study interviewed customers and employees by using dyad approach in the service sector. The data collected was analyzed using a text mining approach in Python library and Ucinet software. The text data collected through interviews was analyzed using multiple techniques like sentiment analysis, centrality analysis, and CONCOR analysis. The results from the two data sets of interviews with employees and consumers revealed certain effects and behavior that they exhibit in a crowded environment. When providing services to consumers in a crowded environment, employees experience a variety of behavioral changes, whether due to physical, psychological, emotional, habitual, or work-related factors. Additionally, findings show that crowding has an emotional and psychological impact on customers’ behavioral responses. The study offers important implications of text analysis for business intelligence.
1. Introduction
Data analytics is in vogue, and recent developments in the field of data brought many solutions such as machine learning, text mining, sentiment analysis etc. to analyze the exceedingly growing data across every disciple. In the field of business, sentiment analysis has gained much importance due to its ability to analyze consumer behavior and their online reviews. In the context of consumer attitude, the sentiment analysis is mostly used in aspects such as “tools for market analysts to refine the offerings produces wish to make available and known to consumers or tools for consumers to mine experiences of peers in face of a challenging purchase decision” (Karlgren et al., Citation2012). These can also be true in the context of the service sector, where building and maintaining customer satisfaction is a great challenge. Customer perceived crowding is one of several factors, which have significant impact on the service quality and ultimately customer satisfaction.
“Crowding is an ubiquitous ambient factor in retail settings” (Aydinli et al., Citation2021, p. 1) On one hand, in order to retain (and increase) profitability, retailers are seeking for ways to get customers into their physical locations (Kumar et al., Citation2014). Hence, they strive to increase store traffic, however, on the other hand crowding can cause stress in a retail setting due to less physical space or poor layout design. The perceived crowding is a major problem for managers as customers may feel uncomfortable in this situation due to the excessive congestion and consider the people density as being too high, which could affect customer satisfaction levels (Buckley, Citation2009; Ryan & Cessford, Citation2003). Retailers therefore attempt to appear less congested to customers by changing the layout of the store, staffing levels, or the number of check-out counters etc. (Mehta, 2013 as cited in Aydinli, et al. 2020).
Perceived crowding is a multidimensional construct having two dimensions social and spatial crowding (Machleit et al., Citation1994). The social crowding, on one hand, refers to an increased human density that leads to a feeling of confinement among individuals and not only concerns the number of individuals but also the rate of interaction and the extent of social interaction in an environment among individuals (Li et al., Citation2009). On the other hand, spatial crowding is an increased spatial density due to which people feel physically restricted. Both spatial and social crowding can significantly affect frontline service employees’ and customers’ behavior in service encounters.
Perceived crowding is usually referred to as the undesirable evaluation of compactness in an area (Zehrer & Raich, Citation2016). The social crowding is also referred as perceived human crowding in some studies e.g. Wall and Mathieson (2006, p. 33) defined it as “the maximum number of people who can use a site without an unacceptable alteration in the physical environment and the social, cultural and economic fabric of the destination and without an unacceptable decline in the quality of the experience gained by visitors”. Perceived crowding refers to the stress that a person goes through when a person’s demand for space beats supply (Jin et al., Citation2016). By creating a pleasurable physical shopping environment or a positive mental image of the store in the consumers’ thoughts, retailers can induce either exhilaration or stress feelings in their customers (Tran, Citation2020).
In the case of sentiment analysis, most of the studies focused on online data and reviews of customers (e.g. Wang et al., Citation2018). Similarly, in the context of studying crowding effects, most of the studies focused on retail stores, the tourism sector, shopping malls, etc. For example, Li et al. (Citation2009) investigated the effect of human as well as spatial crowding on consumer shopping behavior through many emotions. However, very limited studies have focused on the customer crowding effect in the banking and telecom sector. To the author’s knowledge, no such study has been conducted in which sentiment analysis or text mining technique has been applied to understand the customer crowding phenomena in a service sector.
The banks and telecom sectors are an important part of the service sector and are high in competition. Difficulties arise due to perceived crowding when a large number of people are assembled in an area and the usage of resources and environment exceeds the perimeters of the physical setting (Zehrer & Raich, Citation2016). In that case, visitors feel the undesirable effects of crowding which results in lower customer satisfaction. This can be true in the banking and telecom sector as well.
The business services industry has experienced consistent, rapid growth. Despite its scale, business services sector changes typically receive less attention than those in other areas of the economy (Manalo & Orsmond, Citation2013). The service sector is always keen to become more economical for consumers. In the present day’s industrial setup, companies deal with a huge population of potential customers. The number of customers is increasing every passing day and making both banks and telecom franchises conscious of their service quality and this scenario has further accelerated competition in the services sector.
Customers are nowadays more attracted towards better service, latest technology usage, less rate of interest or number of services offered. Such factors help to evaluate how long the customer will support a particular setup. It can be said that a decrease in customer satisfaction is indirectly the downfall of a service organization, and this calls for a need to answer customer crowding-related difficulties in the services sector. Consequently, it is important to investigate the phenomena of crowding on both employees and customers, as employees are also known as the internal customers in the marketing domain. Therefore, the current study is unique in a way that first it collected the primary data from service sector employees and customers (internal as well as external customers reviews) and then used text mining (sentiment analysis) to understand their opinions and attitudes to bring out some important dimensions. The study has an objective to investigate the opinions of internal and external customers towards crowded workplace in the service sector by employing text mining and semantic network analysis.
This study contributes to the existing literature in the domain of the service sector by elaborating on the perilous effects of perceived crowding when employees are providing services to a large number of customers and when customers are receiving services in a crowded environment. The methodological choice of conducting semi-structured interviews and the data analysis technique of semantic network analysis present this study uniquely. To the authors’ knowledge, this study is the first one that has taken initiative to collect primary data for applying the technique of text mining and semantic network analysis to study the phenomena of crowding from the eyes of both employees and customers. In previous studies, the viewpoint of both internal (employees) customers and external customers are very rare. Therefore, the study is significant in the ways it has chosen the problem area of investigation, the way of the unit of investigation, and the way of conducting data analysis techniques. The study can be considered significant for providing a text mining approach via semantic networking analysis for highlighting areas of business intelligence.
After the introduction section, the following section begins with a review of the extant literature on perceived crowding. Next, the study’s methodology and data analysis techniques are presented. Finally, the study results and conclusion are discussed.
2. Literature review
2.1. Semantic network analysis
Semantic network analysis (SNA) is a text mining technique that is built on the merging of two sciences i.e., “computational linguistics and text processing” (García et al., Citation2021). Sentiment analysis is used in a variety of sectors, including customer reviews of products and services. Sentiment classification has been extensively researched as one of the most important branches of sentiment analysis (Yuan et al., Citation2018). The uses of text mining have been described by Brun and Senso (Citation2004) as “identifying specific facts and information based on the document’s text; determine the subject(s) covered in the documents; identify the concepts covered in the documents and create concept networks … ” Qualitative approaches are rarely studied in sentiment analysis research (Ren & Matsumoto, Citation2015) despite the need to filter or remove meaningless statements that are deemed noise, namely in the Twitter corpus (Fraisse & Paroubek, Citation2014a, Citation2014b), which has a wealth of data (as cited in Guimaraes et al., Citation2017). As a result, there is a substantial gap in the use of sentiment analysis in the context of obtaining qualitative data, especially data collected through primary means.
2.2. Perceived crowding
Among numerous pieces of research on the service sector, one of the emergent issues is how frontline service employees get affected when they provide services to the crowds of customers. It has been eminent that perceived crowding portrays an essential factor of the environment that could significantly affect frontline service employees’ behavior. According to Vaske and Donnelly (Citation2002, p. 256) “Perceived crowding combines descriptive information (the density or encounter level experienced by the individual) with evaluative information (the individual’s negative evaluation of that density or encounter level)”. Perceived crowding is a term that is commonly used and comes from an individual’s experience and its evolution of density in a Specific environment (Jin et al., Citation2016). When social and environmental resource usage crosses the changing capability of an area then people perceive the crowd (Manning et al., Citation2002) in a particular setting.
2.3. Frontline service employees in the service sector
Both in academia and practical world, frontline service employees are the ones who come in direct contact with the customers and this contact could be either face-to-face or on-call depending upon the nature of the job and the purpose of this interaction is to fulfill the customers’ needs (Chen et al., Citation2019). Both the banking and telecom sectors (franchises) are central and challenging in the services sector all over the world. Also, for increasing profitability and retaining customers (Karatepe & Aleshinloye, Citation2009), management must focus on customer satisfaction and the provision of effective services. Frontline service employees are responsible for the delivery of excellent service to the customers because they are representing the organizational culture. Frontline service employees are an important part of the service experience because they play a prominent role in customer satisfaction (Whiting et al., Citation2011). Nowadays in a competitive business environment, a business owner wants frontline service employees not only to provide a better service to the customer but also to achieve sales targets, and to create a fruitful or long relationship with their customers (Gaur et al., Citation2017).
Over the last decade, the plumb of power within the commercial relationship has been gradually going towards the customer side. Customers are more demanding in terms of value, so if frontline service employees fulfill the customer expectation and demands then a good innate exchange process creates between customer and organization (Kumar et al., Citation2014). Crowding may affect frontline service employees negatively. And this effect may be based on the task which they are performing or due to work overload. Work overload results in increased stress and lower job satisfaction (Qureshi et al., Citation2012). In the past few years, an increasing effect has been found on the influences of job-related responsibilities on frontline service employees’ mental and physical health. Emotional conditions significantly affect employees’ physical health due to which they are unable to perform the job well. Hence, studying the impact of crowding on employee behavior is an important aspect of this research.
2.4. Perceived crowding and customers behavior in the service industry
Crowding puts a question on service quality and may even force the customers not to choose that place’s services in the future, as the satisfaction level declines (Machleit et al., Citation2000) and as a consequence crowding adversely affects feelings (Li et al., Citation2009). Marketing experts refer to both service quality and satisfaction of customers as exchangeable terms. Negative observation of crowds among customers most likely results in weakening customer satisfaction. The occurrence of a crowd within an area may unfavorably affect the customer’s level of excitement. The emotions generated after this may produce an impact on the relationship between satisfaction and crowding. The negative effects of crowding may ultimately lead to negative evaluations by customers of the service evaluation. However, good quality of service and lessening negative effects caused by the perceived crowding may result in higher customer satisfaction. The long-existing rulebook in the service industry stating “Customer is a god” gives direction to all service employees to have a perfect service encounter with the customers considering their needs and demands with an ultimate aim of pleasing those (Yang & Lau, Citation2019). Hence, service encounters and relationship quality between frontline employees and customers help to determine customer satisfaction and customer perceived value. Investigating the effects of crowding on customer happiness in the context of service sector is crucial due to the inconsistent impacts of crowding (Ali, et al. 2021) in previous studies.
3. Methodology
3.1. Data collection
The objective of this research is to comprehend and explore how perceived crowding influences the behavior of frontline service employees and customers by using the semantic network analysis. To probe this research, first a qualitative and then a quantitative methodology was embraced. First, data was collected via semi-structured interview from twenty frontline service employees and twenty customers of two service sector categories, i.e., banks and telecom franchises. The data set generated was dyadic in nature as both employees and customers of the same branches served as respondents and the both dyads experienced the crowding effect in the same place. Thus, the employee-customer dyad not only helped to include the two parties’ perspectives (i.e., both employees and consumers) but also “enabled us to develop a full picture of the dynamic employee—consumer relationships” (Kim & Byon, Citation2018). The employees had no influence in selecting the customer, thus, the systematic bias risk was eliminated (Homburg & Stock, Citation2004).
The development of interview guidelines in the light of study of Qu and Dumay (Citation2011) assisted in giving an organized form to the questions which were to be asked of the employees and customers during the interview. The fundamental criteria for employees to be eligible for an interview was that they must be regular employees of either bank or telecom franchise for the past two years. Official numbers of banks and franchises were retrieved via the internet and after communicating with them it was decided whether to carry on a telephonic interview or arrange a meeting with them at their itemized time, day, and respective office.
Participants in the study were questioned about their demographics at the start of each interview, and then questions on crowding and its effects on them were asked. Collected information during the interviews was critically analyzed. English and Urdu language were used as a medium of communication during interviews. Later a language translation expert was contacted for Urdu to English translation of interviews. Both the telephone and in-person conversations took place. The typical interview lasted between twenty and forty minutes. All the interviews (face to face & telephonic) of the participants were interpreted one by one, word to word that eventually resulted in 87 A4 text pages with a total of 17,640 words. The informed consent principle and principles of confidentiality were followed for this research. According to the informed consent principle, participants were given adequate knowledge about the research, which helped them in deciding whether they wanted to be a part of this study or not (Bryman, 2008). Concerning confidentiality principal participants were ascertained that their responses will only be used for research and academic purposes. Moreover, participation was voluntary and they had the right to skip a question or withdraw from the interview as and when they required.
4. Data analysis
4.1. Data collection
The transcript of interviews (both employees and customers) of the service sector was prepared. The transcribed answers were processed to produce a file that could be used to do sentiment and semantic network analysis. Python programming language was used for the preprocessing of the collected data. The interview responses were preprocessed with the spaCy library in Python, which is an open-source advanced natural language processing python library. The text was initially tokenized, which involved breaking it up into segments for words, punctuation, and so on. All text was converted to lowercase for uniformity. Words were lemmatized and a custom list of stop words was created which included the stop words that were provided by the spaCy library. These stop words were then removed from the text. Frequency analysis was performed to figure out which words were used most frequently and a list of meaningful words was extracted. A pre-trained model that comes with Natural Language Tool Kit (NLTK) python library was also used for sentiment analysis. Using spaCy’s rule-based matcher engines, related pairs of words were extracted from the text for the semantic network analysis. Ucinet software was used for this purpose which includes a NetDraw module for network analysis. Using the Ucinet software, frequency, degree centrality, betweenness centrality, and eigenvector centrality were computed. CONCOR analysis was also conducted to discover the meaningful relations among words. Centrality analysis is the connection of the relationship and discovering patterns between words, and the greater the similarity of the connection relationship patterns, the greater the degree of structural equivalence of the other words. It forms clusters that include keywords with similarities to each other. CONCOR analysis is a method of repeatedly analyzing correlations to search certain levels of similarity groups. To visualize the results, NetDraw in UCINET 6.0 program was applied.
5. Results
5.1. Positive, neutral, and negative sentences
The study used two data sets of interviews i.e., employees and customers. As the data is based on their opinions and emotions, hence, in the first step, sentiments of data were obtained. Sentiment analysis is one of the applications of machine learning that helps in sentiment mining, opinion extraction, emotion and affect analysis, etc. It is usually done at three levels, i.e., document, entity, and sentence levels (Bachtiar et al., Citation2020). For this purpose, using the Python library, total negative, positive and neutral sentences were counted in this study. By using a pre-built library in Python, the values ranged from −1 to + 1 showing negative and positive respectively. The value of 0 indicates neutral sentiment. In both datasets, negative sentences were more than positive sentences. However, total neutral sentences were greater in number than both positive and negative sentences. These are depicted in Table and Figures .
Figure 1. Sentiments in Employees’ Interviews.
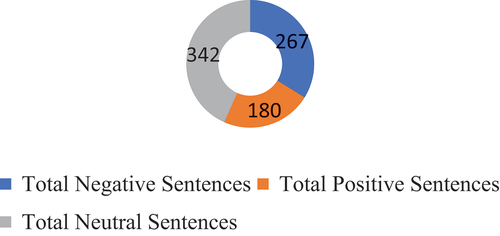
Figure 2. Sentiments in Customers’ Interviews.
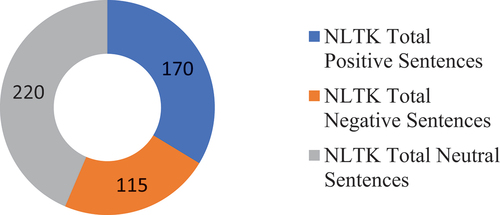
Table 1. Positive, Negative, and Neutral Sentences
5.2. Keywords Centrality Analysis
In this research, datasets of employee and customers’ interview were analyzed. In the frequency analysis, the most frequent words were extracted. The terms were filtered from the extracted list of words, and phrases like “obviously, plainly, absolutely” were eliminated. For further analysis, 129 keywords were retrieved from the data set of employees, while 85 keywords were collected from the data set of consumers. The degree centrality, betweenness centrality, value rank, and eigenvector centrality were calculated before the CONCOR analysis. Tables II and III present the frequency, rank frequency, degree centrality, betweenness centrality, and eigenvector centrality. The degree centrality was done to identify those keywords that have a central position on the network. The high degree of centrality shows the presence of many connections between the nodes or keywords. The betweenness centrality depicts the position of the node acting as a bridge between the two other nodes. The low degree means that if the particular node is excluded, communication can be easier (Jeon & Kim, Citation2020). Eigenvector values depict the influence of nodes in the network and a high eigenvector means that nodes having a high degree of centrality have a major influence over nodes having lower values (Youn & Jung, Citation2021).
In Table of employees’ interview data, it is shown that the keywords, “problem”, “quality”, “consume”, “burden” and “tensed” have a low degree of centrality values, and the highest values of degree centrality in descending order was of “tea”, “pain”, “pressure”, “calm” and “panic” respectively. The data also show that keywords of “pressure”, “tension”, “tea”, “pain”, and “panic” have the highest value of eigenvector values in descending order. Similarly, the keywords of “tea”, “calm”, “pain”, “pressure” and “service” have the highest betweenness centrality in descending order.
Table 2. Keywords Centrality Analysis from Employees’ Interview
In Table of customers’ interview data, it is shown that the top 5 words having a high degree of centrality and eigenvector values were “time”, “crowd”, “staff”, “customers”, and “rush”. Similarly, words like “time”, “customers”, “staff”, “crowd” and “behavior” have a high degree of betweenness.
Table 3. Keywords Centrality Results from Customers’ Interview
5.3. Semantic network diagram and CONCOR analysis
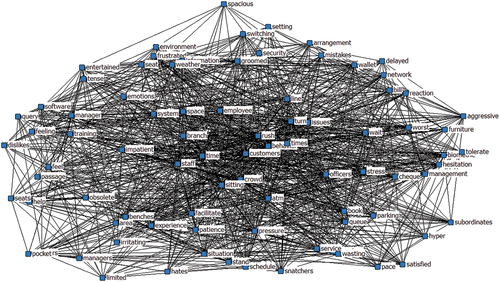
It is possible to determine the most pressing problems experienced by customers and employees in a busy workplace through keyword analysis. Apart from this, there are certain profound associations between words that can provide specific interpretations for future study. The connections among keywords can be explored by using semantic network analysis, which expresses words as nodes and depicts the relationships among nodes.
The semantic network diagram contains both nodes and lines. The nodes present attributes and the lines show the connections established between them, hence, displaying the connections between the words. The semantic network analysis was visualized using Netdraw in Ucinet 6.0 program. Figures show the keyword visualizations of both employees’ and customers’ interviews.
Figure 3. Keyword Visualization of Employees’ Interviews.
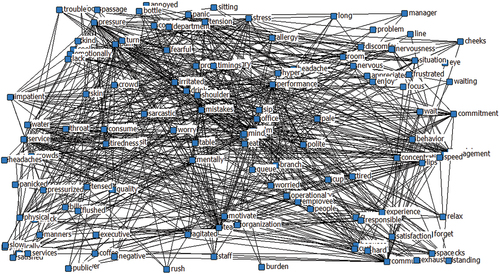
Figure 4. Keyword Visualization of Customers’ Interviews.
5.4. CONCOR analysis
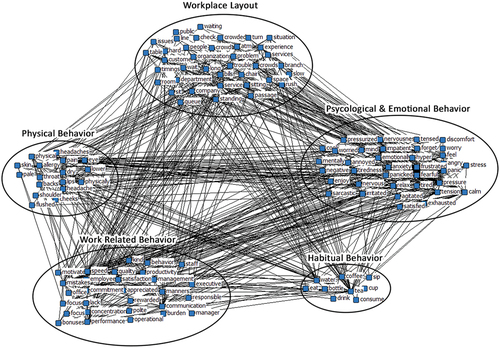
After the centrality analysis, CONCOR analysis was performed which stands for the convergence of iterated correlations. “The CONCOR analysis technique is an assessment that uses a matrix representing the frequency of simultaneous emergence between keywords based on Pearson’s correlation to identify the relationship between networks. The CONCOR analysis is intended to analyze the Pearson correlation of the co-occurrence matrix between words, identify blocks of nodes (keywords), and investigate the relationships between blocks” (Youn & Jung, Citation2021). In this method, similar words are grouped in a cluster by demonstrating a social network that has a certain meaning. Thus, CONCOR analysis identifies the interrelationships and specific patterns that can exist between words and constructs. The CONCOR analysis was also conducted using UCINET 6.7 version and the NETDRAW tool.
Figure shows the CONCOR analysis visualization of keywords. According to the Figure , keywords were clustered into five groups that were labeled psychological & emotional behavior, physical behavior, habitual behavior, work-related behavior, and workplace layout. The keywords in the category of psychological and emotional behavior show that frontline service employees mentioned words like nervousness, frustrated, annoyed, angry, worried, discomfort, tense, etc. From the interviews and the keywords, it can be inferred that crowding exerts certain psychological and emotional effects on the frontline service employees. These emotions are mostly negative effects that these employees feel in their crowded work environment.
Similarly, in the category of physical behavior, employees used the keywords of “pain”, “headache”, “flushed” “cheeks”, “shoulder”, “skin”, “allergy” etc. This indicates that employees may also have certain physical effects on their bodies in a crowded workplace environment. The category of habitual behavior indicates the keywords like “tea”, “water”, “coffee”, “cup”, “eat”, “drink” etc. A piece of information can be drawn from these keywords that employees in a crowded service sector, may develop certain food and drink habits that are different than usual or they may begin consuming more tea, coffee, water, or any food.
In the category of work-related behavior, keywords related to the organizational behavior of employees were observed. These words were “satisfaction”, commitment“, “motivation” “rewarded”, “mistakes” and “productivity” etc. These words indicate that a crowded work environment may also affect employees’ organizational or work-related behavior.
The keywords related to workplace layout category were “chair”, “passage”, queue” “ATM”, “trouble”, “long”, “wait” etc. These words indicate the problems that employees may face in a workplace layout setting or during their daily work routine. These words indicate certain infrastructural provisions such as adequate furniture, passage, space, etc (See Figure ).
Figure 5. Keyword Visualization of Employees’ Interviews.
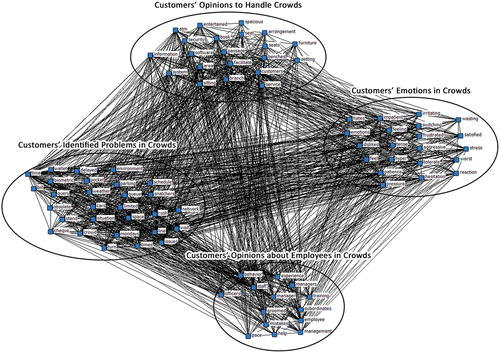
The CONCOR analysis of customers’ interview data shows that keywords were clustered into four groups. The groups or clusters were labeled as customers’ emotions in crowds, customers’ opinions about employees in crowds, customers’ identified problems in crowds, and customers’ opinions to handle crowds. The analysis shows that customers have depicted their emotional reactions in a crowded situations that they face in the service sector. These emotions contained words like, “hate”, “frustrated”, “switching”, “hyper”, “tense”, “irritating”, etc. These words express how they are feeling in a congested environment and these could be considered the effects of crowded situations on customers.
Along with it, customers also had opinions about employees. The category of customers’ opinions about employees shows the words like “manners”, “training”, “subordinate”, “help”, “mistake”, “management” and “behavior” etc. A piece of information from this and the interviews can be drawn that customers have this opinion of the front-line staff. Therefore, the professionalism and training of these front-line staff members can aid in preventing errors and ineffective customer service while dealing with large crowds.
The third cluster of keywords is customers’ identified problems in crowds. The keywords show the “delayed”, “wait”, “network”, “obsolete”, “turn”, “information” and even “snatcher”, “wallet” and “pocket” etc. The information can be drawn that customers in crowded situations face problems like network error, lack of information, obsolete system, long wait, long time standing in queues, problems related to cheques and bills, parking space, etc. Even the customers also indicated the problems of wallet and pocket stealing.
In the fourth category, customers’ opinions to handle crowds, words like, “books”, “furniture”, “area”, “software”, and “security” were observed (See Figure ). From this, it can be deduced that the service industry must have facilities such as adequate furniture, books to engage customers, security to prevent thefts of property, and enough branches of banks or telecom to prevent the overcrowding situation at a particular branch as well as enough ATM facilities, etc. in order to operate effectively in crowded situations.
Figure 6. Keyword Visualization of Customers’ Interviews.
6. Conclusion
The study has used semantic network analysis on primary data collected through conducting interviews with employees and customers of the selected service sector. This is an important contribution to the study where such a technique was applied on a primary data set, whereas the majority of the previous studies focused on secondary data such as tweets and web reviews. This provides an important implication in both methodology and data analysis techniques in the particular context of the service sector. From an academic point of view, the study contributes to disciples such as computing (text mining), information system, psychology, consumer behavior as well as the business sector.
The study has aimed to investigate an important phenomenon i.e., customer crowding in the service sector. One of the crucial elements in the service sector is the effects of crowding. Although previous studies have examined certain effects of customer crowding on customers’ behavior and very few studies have investigated this effect on service sector employees. This study has taken the first initiative to use the primary data for conducting the semantic network analysis in this study area. Moreover, the study has studied the combined effect of crowding both employees and customers in the same setting.
This research aimed to provide a better understanding of the effects of perceived crowding on frontline service employees and customers within the services sector. The findings of the study indicated that customers and frontline service employees are sensitive to the presence of crowds. It can be said that in crowded situations, customers and employees both experience various types of emotional and psychological effects. Hence, crowding is a phenomenon that affects the sentiments of both customers and employees in the service sector. In a crowded situation, frontline service employees undergo various types of behavioral changes. Those behaviors, in this research work, are classified as physical, psychological, emotional, habitual, adaptation, and job-related behavior. Frontline staff members reported pain, a headache, shoulder pain, flushed cheeks, and skin allergies under physical behaviour. Psychologically, they reported getting panicked, pale and worried, tensed, stressed, impatient, fatigued, and exhausted. Habitually, it was found that they frequently started eating more in a crowded setting or, in another instance; they didn’t even have time to get up from their seat to eat because of the throng and intense customer service.
It is a well-known fact that frontline services employee’s (FSE’s) attitude while providing services to a large number of customers is crucial both in banks and in franchises. In the services sector presence of other customers in the surroundings pose a limitation on the ability of other customers to move around. This can be controlled by advancements in technology, providing adequate infrastructure and awareness among people. The study shows that people depict various behavioral responses when their freedom is threatened. Restriction in movement while providing services can result in different outcomes.
The research can conclude that if a bank and franchise have proper infrastructure and arrangement of furniture and space layout, then it can enhance the experience of customers and facilitate employees as well. Customers’ everyday experience and satisfaction are significantly affected by the service encounter they have with the frontline service employee. Therefore, the management of both banks and franchises must allocate adequate resources to manage and reduce crowds. According to the internal marketing, all organizations operating in the services sector must train and groom their front-line service employees in such a way that they work as a team. They must be motivated and encouraged to act like that to maximize the satisfaction of the customers. Perceived crowding could be significantly managed and reduced if at the time of hiring appropriate staff is recruited and then later, they must be trained and oriented carefully so they could be able to provide unparalleled and best services to the customers.
The practical implications of this research are very fruitful for service organizations to adopt and reduce the effects of perceived crowding on frontline service employees and to overall improve the experience of the customers. Service organizations must strategize in such a way that they could maximize the customer service experiences and also their satisfaction level. Frontline service employees are a valuable asset to the company and therefore service organizations must try to meet their needs and preferences and train and groom them accordingly because happy frontline service employees make happy customers. The study also contributes to the methodology by using semantic network analysis on the primary data that highlights more applications of text mining in different settings.
The crowding issue is particularly relevant for the industry these days, as due to the COVID pandemic, crowding is discouraged. The study also highlighted the negative impacts of crowding in the service sector. The study is limited in the sense that it has studied only two areas i.e., banking and telecom, however, future research could also include more sectors for study. Along with it, future studies can take the CONCOR analysis results of this study to further do the factor analysis and regression analysis to confirm these effects in different settings.
Disclosure statement
No potential conflict of interest was reported by the authors.
References
- Aydinli, A., Lamey, L., Millet, K., Ter Braak, A., & Vuegen, M. (2021). How do customers alter their basket composition when they perceive the retail store to be crowded? An empirical study. Journal of Retailing, 97(2), 207–18. https://doi.org/10.1016/j.jretai.2020.05.004
- Bachtiar, F. A., Paulina, W., & Rusydi, A. N. (2020, March). Text mining for aspect based sentiment analysis on customer review: A case study in the hotel industry. IICST, 105–112.
- Brun, R. E., & Senso, J. A. (2004). Artículo Minería textual. El profesional de la información, 13(1), 11. https://doi.org/10.1076/epri.13.1.11.29021
- Buckley, R. (2009). Ecotourism: Principles and practices. CABI.
- Chen, K. Y., Chang, C. W., & Wang, C. H. (2019). Frontline employees’ passion and emotional exhaustion: The mediating role of emotional labor strategies. International Journal of Hospitality Management, 76, 163–172. https://doi.org/10.1016/j.ijhm.2018.05.006
- Fraisse, A., & Paroubek, P. (2014a, May). Toward a unifying model for opinion, sentiment, and emotion information extraction. Proceedings of the 9th International Conference on Language Resources and Evaluation, Reykjavik, Iceland (pp. 3881–3886). European Language Resources Association (ELRA).
- Fraisse, A., & Paroubek, P. (2014b, May). Twitter as a comparable corpus to build multilingual affective lexicons. Proceedings of the 7th Workshop on Building and Using Comparable Corpora, Iceland (pp. 17–21).
- García, M. C. F., De Nicolás, V. L. D. N., Blanco, J. L. Y., & Fernández, J. L. (2021). Semantic network analysis of sustainable development goals to quantitatively measure their interactions. Environmental Development, 37, 100589. https://doi.org/10.1016/j.envdev.2020.100589
- Gaur, S. S., Sharma, P., Herjanto, H., & Kingshott, R. P. (2017). Impact of frontline service employees’ acculturation behaviors on customer satisfaction and commitment in intercultural service encounters. Journal of Service Theory & Practice, 27(6), 1105–1121. https://doi.org/10.1108/JSTP-08-2016-0138
- Guimaraes, R. G., Rosa, R. L., De Gaetano, D., Rodriguez, D. Z., & Bressan, G. (2017). Age groups classification in social network using deep learning. IEEE Access, 5, 10805–10816. https://doi.org/10.1109/ACCESS.2017.2706674
- Homburg, C., & Stock, R. M. (2004). The link between salespeople’s job satisfaction and customer satisfaction in a business-to-business context: A dyadic analysis. Journal of the Academy of Marketing Science, 32(2), 144–158. https://doi.org/10.1177/0092070303261415
- Jeon, Y. S., & Kim, J. J. (2020). Identification of sentiment keywords association-based hotel network of hotel review using mapper method in topological data analysis. The Korean Journal of Applied Statistics, 33(1), 75–86.
- Jin, Q., Hu, H., & Kavan, P. (2016). Factors influencing perceived crowding of tourists and sustainable tourism destination management. Sustainability, 8(10), 976. https://doi.org/10.3390/su8100976
- Karatepe, O. M., & Aleshinloye, K. D. (2009). Emotional dissonance and emotional exhaustion among hotel employees in Nigeria. International Journal of Hospitality Management, 28(3), 349–358. https://doi.org/10.1016/j.ijhm.2008.12.002
- Karlgren, J., Sahlgren, M., Olsson, F., Espinoza, F., & Hamfors, O. (2012, April). Usefulness of sentiment analysis. In European Conference on Information Retrieval (pp. 426–435). Springer, Berlin, Heidelberg.
- Kim, K. A., & Byon, K. K. (2018). A mechanism of mutually beneficial relationships between employees and consumers: A dyadic analysis of employee–consumer interaction. Sport Management Review, 21(5), 582–595. https://doi.org/10.1016/j.smr.2018.01.003
- Kumar, P., Dass, M., & Topaloglu, O. (2014). Understanding the drivers of job satisfaction of frontline service employees: Learning from “lost employees”. Journal of Service Research, 17(4), 367–380. https://doi.org/10.1177/1094670514540981
- Li, J. G. T., Kim, J. O., & Lee, S. Y. (2009). An empirical examination of perceived retail crowding, emotions, and retail outcomes. The Service Industries Journal, 29(5), 635–652. https://doi.org/10.1080/02642060902720121
- Machleit, K. A., Eroglu, S. A., & Mantel, S. P. (2000). Perceived retail crowding and shopping satisfaction: What modifies this relationship? Journal of Consumer Psychology, 9(1), 29–42. https://doi.org/10.1207/s15327663jcp0901_3
- Machleit, K. A., Kellaris, J. J., & Eroglu, S. A. (1994). Human versus spatial dimensions of crowding perceptions in retail environments: A note on their measurement and effect on shopper satisfaction. Marketing Letters, 5(2), 183–194. https://doi.org/10.1007/BF00994108
- Manalo, J., & Orsmond, D. (2013). The business services sector. RBA Bulletin, March, 1-10.Retrieved from https://www.rba.gov.au/publications/bulletin/2013/mar/1.html
- Manning, R., Lawson, S., Newman, P., Laven, D., & Valliere, W. (2002). Methodological issues in measuring crowding-related norms in outdoor recreation. Leisure Sciences, 24(3–4), 339–348. https://doi.org/10.1080/01490400290050781
- Qu, S. Q., & Dumay, J. (2011). The qualitative research interview. Qualitative Research in Accounting & Management, 8(3), 238–264. https://doi.org/10.1108/11766091111162070
- Qureshi, I., Jamil, R., Iftikhar, M., Arif, S., Lodhi, S., Naseem, I., & Zaman, K. (2012). Job stress, workload, environment and employees turnover intentions: Destiny or choice. Archives of Sciences (Sciences Des Archives), 65(8).
- Ren, F., & Matsumoto, K. (2015). Semi-automatic creation of youth slang corpus and its application to affective computing. IEEE Transactions on Affective Computing, 7(2), 176–189. https://doi.org/10.1109/TAFFC.2015.2457915
- Ryan, C., & Cessford, G. (2003). Developing a visitor satisfaction monitoring methodology: Quality gaps, crowding and some results. Current Issues in Tourism, 6(6), 457–507. https://doi.org/10.1080/13683500308667966
- Tran, V. D. (2020). Assessing the relationship between perceived crowding, excitement, stress, satisfaction, and impulse purchase at the retails in Vietnam. Cogent Business & Management, 7(1), 1858525. https://doi.org/10.1080/23311975.2020.1858525
- Vaske, J. J., & Donnelly, M. P. (2002). Generalizing the encounter–norm–crowding relationship. Leisure Sciences, 24(3–4), 255–269. https://doi.org/10.1080/01490400290050718
- Wang, Y., Lu, X., & Tan, Y. (2018). Impact of product attributes on customer satisfaction: An analysis of online reviews for washing machines. Electronic Commerce Research and Applications, 29, 1–11. https://doi.org/10.1016/j.elerap.2018.03.003
- Whiting, A., Donthu, N., & Baker, A. M. (2011). Investigating the immediate and long-term effects of job stressors on frontline service employees. International Journal of Research in Marketing, 28(4), 319–331. https://doi.org/10.1016/j.ijresmar.2011.05.006
- Yang, F. X., & Lau, V. M. C. (2019). Evil customers, an angel boss and coopetitive coworkers: Burnout of frontline employees. International Journal of Hospitality Management, 83, 1–10. https://doi.org/10.1016/j.ijhm.2019.04.004
- Youn, C., & Jung, H. J. (2021). Semantic network analysis to explore the concept of sustainability in the apparel and textile industry. Sustainability, 13(7), 3813. https://doi.org/10.3390/su13073813
- Yuan, X., Sun, M., Chen, Z., Gao, J., & Li, P. (2018). Semantic clustering-based deep hypergraph model for online reviews semantic classification in cyber-physical-social systems. IEEE Access, 6, 17942–17951. https://doi.org/10.1109/ACCESS.2018.2813419
- Zehrer, A., & Raich, F. (2016). The impact of perceived crowding on customer satisfaction. Journal of Hospitality & Tourism Management, 29, 88–98. https://doi.org/10.1016/j.jhtm.2016.06.007