
 ?Mathematical formulae have been encoded as MathML and are displayed in this HTML version using MathJax in order to improve their display. Uncheck the box to turn MathJax off. This feature requires Javascript. Click on a formula to zoom.
Abstract
Supplier selection plays a crucial role in enhancing the competitiveness and operational efficiency of manufacturing industries. In the Indonesian manufacturing sector, where market conditions are dynamic and complex, the need for an effective supplier selection methodology is particularly critical. The suggested method converts conventional DEA (Data Envelopment Analysis) models into fuzzy events through the application of credibility measures. Additionally, the relative closeness (RC) index is employed to enhance the differentiating capability of traditional DEA. This article incorporates three input criteria and five output criteria. The findings suggest that higher values of the RC Index correspond to superior performance by the supplier. Furthermore, the study’s outcomes reveal that the credibility index influences the RC index. Imposing stricter credibility constraints can diminish the value of the RC index.
1. Introduction
Supplier evaluation refers to the examination, assessment, and continuous observation of supplier performance, along with the analysis of business procedures and methods, intending to minimize expenses and mitigate risks (Gordon, Citation2008). Supplier evaluation holds significant significance within supply chain management, as opting for the appropriate supplier can enable the supply chain to accomplish its objectives and secure a competitive edge (Abel et al., Citation2020). In the production process, a variety of suppliers play a vital role by providing essential raw materials that meet specific criteria. These suppliers are carefully selected to ensure the smooth functioning of the production line. Their involvement is crucial in maintaining the overall resilience of the supply chain, as they contribute to the consistent and timely availability of the required materials. The effectiveness and productivity of a company can be influenced by its purchasing activities. Changes in purchase prices and issues such as insufficient supply or low-quality materials can disrupt the production process (Stainer et al., Citation2016). During the implementation of purchasing strategies, various challenges arise due to suppliers, including non-compliant raw materials, delivery delays, and discrepancies between ordered and received quantities. These issues are caused by poor supplier performance. Suppliers play a crucial role in meeting the product, component, and material requirements of a company, which are essential for maintaining a competitive edge (Bai & Sarkis, Citation2010). Choosing appropriate suppliers ensures a productive supply chain and overall customer satisfaction (T.-C. Wen et al., Citation2020).
In the field of procurement, companies are closely intertwined with their suppliers, as suppliers can have a significant impact on a company’s legal compliance and reputation (Bai & Sarkis, Citation2010). Therefore, it is crucial for companies to carefully choose their suppliers. Supplier selection involves the process of identifying appropriate suppliers who can deliver products and/or services at the right price, quantity, and time (Dargi et al., Citation2014). The issue of supplier selection is highly critical within the supply chain system (C. T. Chen et al., Citation2006). Opting for the right supplier can yield substantial benefits such as cost reduction in procurement, shorter production lead times, enhanced customer satisfaction, and increased company competitiveness (Soner Kara, Citation2011). Price typically holds the utmost significance in supplier selection, as companies aim to maximize profits (Baskaran et al., Citation2012). However, a study by Kannan and Tan (Citation2002) indicated that quality and delivery accuracy have emerged as primary criteria in supplier selection. This suggests that previous supplier selection criteria only encompassed price, quality, delivery, and service (Molamohamadi et al., Citation2013). Notably, there has been limited research incorporating attributes like product defect rate, flexibility to accommodate order changes and hygiene. This paper aims to incorporate these three criteria for supplier selection in the context of Indonesian manufacturing, specifically frozen food production.
Bai and Sarkis (Citation2010) conducted a study indicating that the decision-making process for supplier selection can be unclear. To address this ambiguity, various approaches have been explored in research. For instance, Rashidi and Cullinane (Citation2019) utilized Fuzzy DEA (Data Envelopment Analysis) and Fuzzy TOPSIS (Technique for Order Preference by Similarities to Ideal Solution) in sustainable supplier selection; Tavassoli et al. (Citation2020) introduced stochastic Fuzzy DEA to evaluate supplier sustainability. Moreover, Zhou et al. (Citation2016) employed Type-2 fuzzy multi-objective DEA to asses sustainable supplier evaluation; Mirmousa and Dehnavi (Citation2016) developed criteria for supplier selection using Fuzzy DEMATEL (Decision-Making Trial and Evaluation Laboratory). In addition, Chin-Nung (Citation2012) utilized Fuzzy MSGP (Multi-Segment Goal Programming) for green supplier selection. Nevertheless, a major challenge arises when the final scores for different suppliers are equal, making it difficult for the decision-maker to make a choice. J. Wang et al. (Citation2016) in their study indicated that A major drawback is evident when the decision-maker is confronted with the dilemma of deciding as the final score becomes indistinguishable. Similarly, Mohammadnazari et al. (Citation2022) believed that one issue lies in the fact that when the final score reaches an identical value, the decision-maker faces a significant challenge in reaching a decision. Hence, the main aim of this research is to employ Fuzzy DEA Credibility Constrained and Relative Closeness (RC) Index approaches in order to identify the most suitable supplier. According to Wardana et al. (Citation2021), increasing the credibility level enhances the ability to differentiate effectively without sacrificing any information. Consequently, this study also demonstrates the influence of credibility level on the ultimate score.
The structure of this paper is as follows. In section 2, we review the assessment standards and the method used to evaluate suppliers. Following that, we elaborate on our proposed approach in section 3. Section 5 delves into the fuzzification of numbers and the consistency of rankings, including a comparison of the results obtained through different methods. Section 6 discusses the practical and theoretical implications, while section 7 provides a conclusion for the paper.
2. Literature review
2.1. Supplier evaluation
According to Fei et al. (Citation2018), supplier selection is a part of Multi-Criteria Decision Making (MCDM). Their study utilizes the D-S VIKOR (Dempster—Shafer Višekriterijumsko Kompromisno Rangiranje) approach to determine the optimal supplier. Numerous investigations have been carried out in the field of supplier selection. Another study by Toloo and Nalchigar (Citation2011) also researched supplier selection. They used the cardinal and ordinal data DEA method with 18 supplier selection specifications. Moreover, Dargi et al. (Citation2014) researched supplier selection using the Fuzzy Analytical Network Process (Fuzzy-ANP) method implemented in the automotive sector with five supplier assessment specifications. Based on the research conducted by Bulgurcu and Nakiboglu (Citation2018), it has been established that the AHP (Analytic Hierarchy Process), DEA, and TOPSIS techniques are extensively employed for supplier evaluation and selection. In this particular study, the Fuzzy DEA Credibility Constrained method and the Relative Closeness Index methodologies are utilized to address and resolve any uncertainties or ambiguities. This innovative approach combines the Fuzzy DEA Credibility Constrained method with the Relative Closeness Index to create an updated evaluation method. The Relative Closeness Index is employed to tackle ambiguity, while the credibility constraint is applied to handle ambiguities.
2.2. Assessment of criteria
The process of decision-making, particularly when it comes to choosing suppliers, involves the crucial task of selecting appropriate criteria (K.-L. Chen et al., Citation2014). K.-L. Chen et al. (Citation2014) stated that companies evaluate their suppliers according to various standards, which can vary depending on specific circumstances and contexts. Previous research has explored several studies focused on supplier selection, as outlined below.
Table illustrates that numerous types of research delve into the topic of supplier choice. The analysis reveals that the commonly employed factors comprise cost, excellence, on-time delivery, service excellence, adaptability for order modifications, and the supplier’s reputation. Presently, the supplier selection process primarily integrates MCDM techniques alongside fuzzy methods, as indicated in Table .
Table 1. Assessment standards utilized in prior studies
The evaluation process relies on the crucial task of establishing criteria, which entails considering alternative qualifications (Soner Kara, Citation2011). Within the DEA method, the criteria can be categorized into two groups: input and output. Output criteria aim to be maximized, while input criteria aim to be minimized (Mousavi-Nasab & Sotoudeh-Anvari, Citation2017). A criterion with a higher value is referred to as maximizing, whereas a lower value is considered minimizing. The forthcoming study will employ the following criteria.
2.2.1. Input
−Price
The cost of the product plays a significant role in its overall expenses. Consequently, the procurement department aims to acquire the commodity at the most economical price to minimize the overall costs (Kilincci & Onal, Citation2011; Masudin, Ramadhani, et al., Citation2021).
−Location
The geographical position of the supplier company holds importance due to its impact on shorter delivery times, reduced transportation costs, and quicker technical support required (Kilincci & Onal, Citation2011).
−Product Defect Rate
The level of damage observed in previous agreements with suppliers (Aydin & Kahraman, Citation2010).
2.2.2. Output
−Quality
Requirements for goods must be met by suppliers according to the company’s specifications (Aydin & Kahraman, Citation2010).
−Delivery Accuracy
Suppliers are expected to follow the agreed-upon delivery schedule accurately.
−Service quality
The benefits offered by a service supplier can be assessed using service performance criteria. These criteria should always be considered when selecting a supplier, as purchasing involves various service levels like order processing and information provision (Aydin & Kahraman, Citation2010; Masudin et al., Citation2020).
−Flexibility to Order Changes
Suppliers need to be flexible and adapt to changes in orders as required.
−Hygiene
Suppliers must ensure the cleanliness of raw materials during delivery. The condition of delivery vehicles and equipment should be checked during each delivery, and the delivered products must meet the expected level of quality (Masudin, LAU, et al., Citation2021; Trafialek, Citation2019).
2.3. Supplier evaluation method
Supplier evaluation is a part of Multi-Criteria Decision Making (MCDM) and involves various techniques for selecting suppliers. Past research has utilized MCDM to evaluate supplier performance, including studies by Hoseini et al. (Citation2020), who employed the Fuzzy sets-Z number method to identify 13 criteria for supplier assessment. Moreover, Kara et al. (Citation2022) also conducted a literature review and gathered opinions to investigate sustainable suppliers. Their approach involved using the Fuzzy DEA credibility constrained and relative closeness index.
2.3.1. Data envelopment analysis (DEA) model
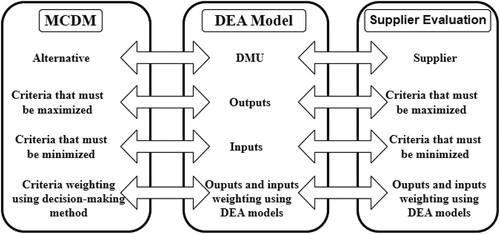
Data Envelopment Analysis (DEA) is a technique focused on data that assesses the performance of Decision-Making Units (DMUs), which are entities capable of converting multiple inputs into multiple outputs (Cooper et al., Citation2011). According to Mousavi-Nasab and Sotoudeh-Anvari (Citation2017), there exists a methodological relationship between DEA and MCDM, where parameters to be maximized are treated as outputs and parameters to be minimized are considered inputs, as depicted in Figure . In addition, Karsak and Dursun (Citation2014) also explain that inputs correspond to parameters that need to be minimized, while outputs refer to parameters that should be maximized. Cook et al. (Citation2014) conducted a study and found that in general comparative scenarios, inputs are typically performance measures where a lower value is desirable, whereas outputs are usually performance measures where a higher value is desirable. Additionally, the determination of whether a parameter is considered an input or output depends on the specific problem being evaluated.
Figure 1. MCDM and DEA process of decision making.
Charnes, Cooper, and Rhodes (CCR) first introduced the Data Envelopment Analysis model in 1978 as a mathematical measurement model with a nonparametric method that can evaluate several activities by measuring the efficiency of the DMU (Cooper et al., Citation2011). The DEA model used in the followings the CCR model used to evaluate the DMU:
Subject to:
Where:
Ej : Efficiency of DMUj
: Output weight
: Input weight
: Input DMUj
: Output DMUj
In addition to supplier selection, the DEA method has been applied in previous studies to various scenarios. For instance, Peixoto et al. (Citation2020) employed the DEA method to evaluate the performance of hospital management. Similarly, the DEA model serves as a helpful tool in assessing the quality of radiotherapy treatment plans for patients with head and neck cancer, as demonstrated by Raith et al (Raith et al., Citation2021). Furthermore, Eftekhari et al. (Citation2020) utilized the DEA method to assess ground motion prediction in their research.
2.3.2. DEA and RC index model
Data Envelopment Analysis (DEA) is a nonparametric technique utilized to evaluate the relative efficiency of decision-making units (DMUs) by considering multiple inputs and outputs (M. Wen et al., Citation2009). DEA has garnered significant theoretical and practical attention since its introduction in 1978. Over time, several theoretical extensions have been developed based on the fundamental DEA model. The conventional DEA model yields the same efficiency value for DMUs, posing a challenge in determining the best-performing DMU (Wardana et al., Citation2021). Therefore, to avoid this, in his research, Kim et al. (Citation2019) incorporated the Relative Closeness index into the DEA approach in their research. They compared two virtual DMUs, namely the ideal DMU (IDMU) and anti-ideal DMU (ADMU), and ranked them based on their relative closeness. The IDMU model can be solved through a linear programming model, as demonstrated below:
Subjected to:
The inputs and outputs of IDMU, denotes as and
, respectively, are obtained from the maximum value of
and the minimum value of
. The optimal efficiency of IDMU is represented as
. The subsequent task involves comparing the efficiency of each DMU with the optimal efficiency value of the DMU. The following model describes this process:
Subjected to:
θj represents the efficiency rating of DMUj in relation to the efficiency rating of. The subsequent stage involves calculating the efficiency score of ADMU (φADMU) using the following model:
Subject to:
Subject to:
represents the efficiency score of DMUj which is compared with the efficiency score of
. After determining the score
the next step is to calculate the relative closeness as follows:
Y.-M. Wang and Y (Citation2006) also use the DEA method and the RC index to illustrate solving the DMU selection problem.
3. Proposed approach
3.1. Fuzzy DEA credibility constrained and RC index
The conventional DEA model assumes that all inputs and outputs are represented as precise numbers. Nevertheless, this assumption may not hold true in practical situations. To address this issue, fuzzy DEA’s credibility is restricted, mainly due to the presence of uncertainty caused by obscurity. As a solution, the RC index model is introduced as a linear programming model to tackle real-world problems (Wardana et al., Citation2020, Citation2021). Following that, we proceed with the fundamental idea of credibility theory and implement it within the framework (2–5), resulting in a novel model constrained by the fuzzy DEA credibility and RC index. Ultimately, in a conducted investigation undertaken by Wardana et al. (Citation2021), The credibility of the DEA is utilized to address the uncertainty, while the RC index is employed to resolve the ambiguity.
Definition 1
Let be ξ as a fuzzy variable with a distribution function μ: → [0,1]. The fuzzy variable (ξ) is normal if it comes from a real number r so that μ (r) = 1.
Definition 2
Let Pos and Nec be two specific fuzzy measures defined at (, U), where U is the set of
. Furthermore, Pos and Nec are a pair of multiple fuzzy measures, and the model is Pos {A} = 1 - Nec {AC} where AC is the complement of A.
Definition 3
The credibility measurement model is as follows:
For any
Consider ξ as a triangular fuzzy number (k1,k2,k3) knowing the value of k1 ≥ k2 ≥ k3, so the membership function is as follows:
Based on this definition, the fuzzy probability constraint model can be formulated as follows (X. LI & B, Citation2006):
Subject to:
Based on the model (9), the first constraint must be greater than or equal to
. The
is the Credibility level scalar, and usually, the credibility level should be greater than 0.5 (Meng & Y, Citation2007). Moreover, it is advantageous to have a deterministic model for the fuzzy probability constraint model in order to streamline the optimization model. Ultimately, theory 1 is employed to transform FCCP into an equivalent crisp representation.
Theory 1 Let be an independent triangular fuzzy number (
and šo be an independent triangular fuzzy number (
with a level credibility α ∈ [0,5, 1].
According to the FCCP concept, models (2), (3), (4), and (5) can be transformed into a credibility-limited model as follows:
Subject to:
Subjected to:
Subjected to:
The conversion process outlined in theorem 1 transforms models (14), (15), (16), and (17) into crisp equivalents as follows:
Subjected to:
Subjected to:
Subjected to:
Subjected to:
The models numbered 16, 17, 18, and 19 correspond to the subsequent models listed below.
Subjected to:
Subjected to:
Subjected to:
Subjected to:
According to the study conducted by Wardana et al. (Citation2021), the decision-making technique involving the combination of fuzzy DEA credibility constrained and the RC index is represented in Figure .
Figure 2. Supplier selection flowchart.
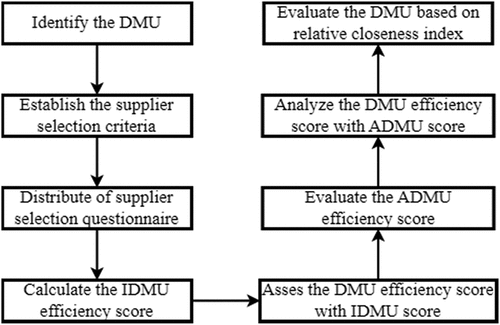
Identify the DMU
The DMU can be determined by conducting an interview with the company’s expert to establish the number of suppliers currently utilized.
Establish the criteria for supplier selection
The criteria for supplier selection are determined by consulting with the company’s expert to determine the suitable criteria that align with the company’s requirements.
Distribute the questionnaire for supplier selection
The supplier performance evaluation questionnaires were distributed to the company’s expert.
Calculate the efficiency score of the IDMU
The IDMU efficiency score can be computed using EquationEquation (20)
(20)
Assess the DMU efficiency score using the IDMU value
Compare the DMU efficiency score with the IDMU value by utilizing the solving model (17) or (21).
Evaluate the efficiency score of the ADMU
Determine the ADMU efficiency score through the solution model (18) or by employing Equationequation (22)
Analyze the DMU efficiency score with the ADMU score
Compare the DMU efficiency score with the ADMU score using the solving model (19) or Equationequation (23)
Evaluate the DMU rating based on the calculation of the relative closeness value
This research was conducted in the frozen food manufacturing industry in Indonesia. The data collection for this research comes from the experts, so this research needs to identify the experts. The expert meaning has been discussed in the previous sections and the expert who becomes our data source should have enough knowledge about frozen shrimp quality and production, supplier criteria, and all of the attributes of this research. In this study, the experts are the managers of the logistics and purchasing divisions. The questionnaire was designed according to the desired criteria such as price, supplier location, product return rate, quality, delivery, service, order flexibility, and hygiene. The rating scale of the questions in the questionnaire for respondents in this study used 7 scales namely excellent, very good, good, fair, poor, and very poor. In this study, GAMS software was used to complete steps 7 and 8.
4. Results and discussion
4.1. Fuzzification
After gathering data from the survey, the obtained results are converted into fuzzy values for further analysis. The process of transforming the findings involves assigning fuzzy numbers to represent the collected data. Table provides a comprehensive overview of the fuzzy numbers utilized in the analysis, offering a consolidated representation of the fuzzy values employed in the evaluation. Table and Table display the outcomes obtained by transforming the linguistic variables of each DMU into fuzzy numbers. These fuzzy numbers will serve as inputs for coding the GAMS software. Table show the definationof notation that used in this article.
Table 2. Notation definition
Table 3. Fuzzy number
Table 4. Fuzzy number input criteria
Table 5. Fuzzy number output criteria
Based on the provided table, it is evident that DMU 3 ranks first, followed by DMU 15, DMU 7, DMU 11, DMU 6, DMU 13, DMU 10, DMU 9, DMU 1, DMU 4, DMU 8, DMU 12, DMU 5, DMU 2, and finally DMU 14. Some DMUs, namely DMU 4, DMU 6, DMU 8, and DMU 11 have identical IDMU values of 0.732. Among these four DMUs, it is observed that higher ADMU values correspond to greater RC Index values. Therefore, it can be inferred that an increase in the ADMU value leads to a higher RC Index value, and the same principle applies to an increase in the IDMU value. When employing the Fuzzy DEA Credibility Constrained method and the RC Index for supplier selection, it was found that certain suppliers obtained low scores on multiple criteria, resulting in their subpar performance.
4.2. Ranking consistency
Table displays the outcomes of the supplier evaluation, which are additionally reassessed with various credibility constraints. This reassessment aims to determine the level of ranking consistency associated with each credibility constraint being employed. The credibility constraints employed include values of 0.6, 0.7, 0.8, 0.9, and 1. Table show score of IDMU, ADMU, and RC index using credibility constrained 0.7.
Table 6. Score IDMU, ADMU, and RC index using credibility constrained 0.7
Table 7. Ranking consistency
Based on Table , it is evident that the RC Index value changed when the Credibility constraint increased by 0.1. Multiple prior studies also employed credibility constraints and achieved similar outcomes (X. M. LI et al., Citation2015; Wardana et al., Citation2021; Zhang & P, Citation2017). However, the variance in DMU ratings for each credibility constraint is negligible. Additionally, it can be observed that the IDMU value of each DMU decreases as the credibility constraint increases, while the ADMU score rises with the increasing credibility constraint. These findings align with the research conducted by Wardana et al. (Citation2021). Figure depicts the pattern of the RC Index based on different Credibility constraints.
Figure 3. Relative Closeness Index.
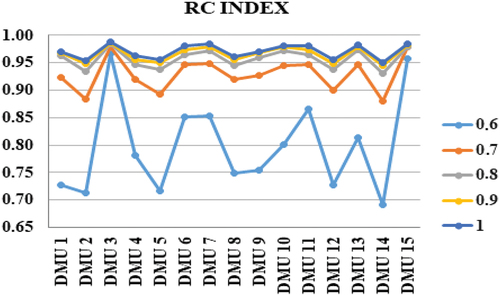
Figure illustrates that when the Credibility Ratio falls within the range of 0.6 to 0.8, the rankings of DMUs remain relatively consistent or show only slight deviations. This suggests that the evaluation results are dependable and can be trusted. On the other hand, when the Credibility Ratio exceeds the range of 0.9 to 1, the credibility diminishes substantially. This indicates that the reliability of the rankings obtained is compromised, and caution should be exercised in interpreting the evaluation outcomes.
4.3. Comparison results of conventional DEA with Fuzzy DEA credibility constrained and relative closeness index
After acquiring the questionnaire results, calculations were conducted utilizing Conventional DEA to compare the outcomes of both approaches. The subsequent analysis contrasts the calculations performed using Conventional DEA alongside Fuzzy DEA Credibility Constrained and Relative Closeness Index.
According to the table, it is evident that several DMUs possess identical efficiency values when evaluated using Conventional DEA. As a result, determining the top-performing DMU becomes challenging. This can be seen from the many values of ranking 1 generated using conventional DEA, making it difficult for decision-makers to choose the best DMU. Kim et al. (Citation2019) noted that the use of Conventional DEA often leads to multiple DMUs having the same efficiency value, making it difficult to distinguish the best performer. This phenomenon can also be caused by the presence of outliers or extreme values within the dataset can also impact the DEA results and pose challenges in determining the best DMU accurately. According to Berghäll and Nisar (Citation2016), the outlier values within the dataset can distort the efficiency scores and rankings, potentially leading to misinterpretations or misleading conclusions. Therefore, it is essential to carefully consider the limitations and uncertainties associated with the DEA method when attempting to determine the most efficient DMU.
Meanwhile, the use of the fuzzy DEA and credibility-constrained approach (see Table ) shows better results than the conventional DEA approach. This is indicated by the decrease in the number of DMUs ranked 1 when compared to conventional DEA. However, there are still two DMUs with the same ranking, for example, a DMU ranked 13th, which would also make it difficult for decision-makers to choose the best DMU. When employing fuzzy DEA, the concept of credibility becomes crucial in ensuring the reliability of the obtained results. Credibility refers to the degree of trustworthiness or believability of the evaluation outcomes. Meng et al. (Citation2011) believed that credibility-constrained are imposed on the fuzzy DEA model. These constraints define a range of credibility ratios within which the rankings of DMUs are considered reliable. For instance, a credibility ratio value between 0.6 and 0.8 May indicate a stable ranking, while a value above 0.9 suggests low credibility (Konings et al., Citation2006).
Table 8. Comparison of results using DEA vs Fuzzy DEA and credibility constrained
Conversely, the Fuzzy DEA Credibility Constrained and Relative Closeness Index produced dissimilar outcomes for each DMU. When employing credibility constraints, if the RC Index yields identical results, the credibility constraint can be adjusted to clarify the superior DMU (Wardana et al., Citation2021). This adjustment is attributed to the influence of the credibility index on the RC index, whereby an increase in the credibility index leads to a decrease in the RC index value. In addition, LIN and LU (Citation2023) argued that the Fuzzy DEA Credibility Constrained approach and Relative Closeness Index are superior due to their ability to handle uncertainty and provide a comprehensive evaluation of DMU performance. These methods go beyond traditional approaches, allowing decision-makers to make more informed decisions based on a realistic understanding of the rankings and proximity to optimal performance
5. Managerial and theoretical implications
Based on the previous discussion, stakeholders can implement various managerial policies regarding the criteria for selecting suppliers to ensure that the chosen supplier is the most suitable for industry needs. Decision-makers must consistently assess the necessary supplier criteria. Furthermore, personnel responsible for supplier selection should enhance their skills in adapting to change. Decision-makers also need to understand the digital technology advancements that suppliers possess. Therefore, regular training activities and skill development in information technology are essential. A well-planned training program is necessary to empower individuals, reduce internal levels within the organization, and foster quality improvement (Hanaysha, Citation2016). Moreover, periodic training would enhance the purchasing staff’s ability to choose the optimal supplier for the business (Masudin, Aprilia, et al., Citation2021).
Another aspect that decision-makers must take into account during the supplier selection process is the connection between the buyer and the supplier. It is crucial for decision-makers on both sides, buyers, and suppliers, to establish a strong working relationship. A favorable and stable working relationship regarding supply and demand activities ensures the satisfaction of requirements based on industry standards. Additionally, this buyer-supplier relationship facilitates efficient and effective information sharing between the two parties (Zaim et al., Citation2003). A strong and dependable working relationship concerning supply and demand activities guarantees the fulfillment of needs according to industry criteria. Moreover, this buyer-supplier relationship aids in the efficient and effective exchange of information between the two entities. The occurrence of information distortion between buyers and suppliers in business-to-business interactions has a significant impact on meeting demand (Souza et al., Citation2000).
The findings of this study indicated that the valid data flows from buyers and suppliers impact significantly the quality of the information received by the stakeholders involved. In enhancing communication and information exchange, it is beneficial to make use of technology solutions and data-sharing platforms. Technology solutions and data-sharing platforms play a significant role in facilitating seamless communication within and across organizations. These platforms could provide a centralized and accessible space where relevant stakeholders can share information, collaborate, and coordinate their activities. Duong et al. (Citation2021) believed that by utilizing such platforms, companies can eliminate the need for time-consuming manual communication methods and ensure that accurate and up-to-date information is readily available to all involved parties.
Theoretically, implementing the fuzzy DEA credibility constrained and relative closeness index approach for supplier selection can decrease the uncertainty of supplier selection outcomes caused by inaccurate data. Nevertheless, traditional methods employed in supplier selection reveal that the outcomes become unclear when multiple suppliers receive the same evaluation score (Bai & Sarkis, Citation2010). Hence, the findings of the research indicating that enhancing the Credibility index will decrease the value of the RC index offer crucial insights for minimizing the ambiguity observed in previous theories related to supplier selection.
The integration of the Fuzzy DEA credibility-constrained approach and the RC index not only reduces uncertainty but also offers a practical solution to the long-standing issue of ambiguity in supplier selection. The theoretical advancements of this study provide a foundation for future research in supplier selection methodologies, enabling a more reliable and informed decision-making process in various industrial contexts.
6. Conclusion
This study aimed to enhance the validity of the supplier selection approach’s outcomes. The conventional approach currently used exhibits uncertainty in the supplier selection results, as they often yield similar assessment scores. The proposed method called the Fuzzy DEA Credibility Constrained and Relative Closeness Index, introduces a valuable aspect as information to alleviate the ambiguity in the supplier selection process results. The study’s findings suggest that an increase in the Credibility index level leads to a decrease in the relative closeness index value.
In light of these research findings, it is important to address several considerations regarding managerial policies. It is crucial to periodically enhance the competence and skills of staff involved in the supplier selection process. Moreover, policymakers responsible for supplier selection should prioritize the level of relationship between buyers and suppliers. This aspect relates to the implementation of information-sharing policies between the two parties. As for future research, it is worth considering the impact of the COVID-19 pandemic on the criteria selection process. Therefore, incorporating health criteria could be a valuable addition to the next study.
Acknowledgments
We would like to thank the reviewers and editor for their appreciated and exceptional contribution by providing critical feedback and comments to improve the manuscript. We would like to thank the Logistics and Supply Chain Research Centre of the University of Muhammadiyah Malang for its support in completing the research.
Disclosure statement
No potential conflict of interest was reported by the author(s).
Additional information
Funding
References
- Abel, E., Ríos, C., C, J., Paton, N. W., Keane, J. A., & Fernandes, A. A. A. (2020). Targeted evidence collection for uncertain supplier selection. Expert Systems with Applications, 159, 159. https://doi.org/10.1016/j.eswa.2020.113583
- Aydin, S., & Kahraman, C. (2010). Multiattribute supplier selection using fuzzy analytic hierarchy process. International Journal of Computational Intelligence Systems, 3(5), 553–24. https://doi.org/10.1080/18756891.2010.9727722
- Azadi, M., Jafarian, M., Saen R, F., & Mirhedayatian, S. M. (2015). A new fuzzy DEA model for evaluation of efficiency and effectiveness of suppliers in sustainable supply chain management context. Computers & Operations Research, 54, 274–285. https://doi.org/10.1016/j.cor.2014.03.002
- Bai, C., & Sarkis, J. (2010). Integrating sustainability into supplier selection with grey system and rough set methodologies. International Journal of Production Economics, 124(1), 252–264. https://doi.org/10.1016/j.ijpe.2009.11.023
- Baskaran, V., Nachiappan, S., & Rahman, S. (2012). Indian textile suppliers’ sustainability evaluation using the grey approach. International Journal of Production Economics, 135, 647–658. https://doi.org/10.1016/j.ijpe.2011.06.012
- Berghäll, E., & Nisar, T. (2016). Innovation, competition and technical efficiency. Cogent Business & Management, 3(1), 1199522. https://doi.org/10.1080/23311975.2016.1199522
- Bulgurcu, B., & Nakiboglu, G. (2018). An extent analysis of 3PL provider selection criteria: A case on Turkey cement sector. Cogent Business & Management, 5(1), 1469183. https://doi.org/10.1080/23311975.2018.1469183
- Chen, C.-T., Lin, C.-T., & Huang, S.-F. (2006). A fuzzy approach for supplier evaluation and selection in supply chain management. International Journal of Production Economics, 102(2), 289–301. https://doi.org/10.1016/j.ijpe.2005.03.009
- Chen, K.-L., Yeh, C.-C., & Huang, J.-C. (2014). Supplier selection using a hybrid model for 3c industry. Journal of Business Economics and Management, 15(4), 631–645. https://doi.org/10.3846/16111699.2013.807870
- Chin-Nung, L. (2012). Applying fuzzy-MSGP approach for supplier evaluation and selection in food industry. African Journal of Agricultural Research, 7(5). https://doi.org/10.5897/AJARX11.088
- Cook, W. D., Tone, K., & Zhu, J. (2014). Data envelopment analysis: Prior to choosing a model. Omega, 44, 1–4. https://doi.org/10.1016/j.omega.2013.09.004
- Cooper, W. W., Seiford, L. M. & J, Z. H. U., Cooper, W. W., Seiford, L. M., Zhu, J. (2011). Handbook on data envelopment analysis. Springer US. https://doi.org/10.1007/978-1-4419-6151-8
- Dargi, A., Anjomshoae, A., Galankashi, M. R., Memari, A., & Tap, M. B. M. (2014). Supplier selection: A fuzzy-ANP approach. Procedia Computer Science, 31, 691–700. https://doi.org/10.1016/j.procs.2014.05.317
- Dobos, I., & Vörösmarty, G. (2014). Green supplier selection and evaluation using DEA-type composite indicators. International Journal of Production Economics, 157, 273–278. https://doi.org/10.1016/j.ijpe.2014.09.026
- Duong, N. H., Ha, Q.-A., & Tan, A. W. K. (2021). The links between supply chain risk management practices, supply chain integration and supply chain performance in Southern Vietnam: A moderation effect of supply chain social sustainability. Cogent Business & Management, 8(1), 1999556. https://doi.org/10.1080/23311975.2021.1999556
- Eftekhari, N., Yazdani, A., Razmyan, S., & Shamohammadi, A. (2020). Data envelopment analysis based procedure for selection and ranking of ground motion prediction equations. Soil Dynamics and Earthquake Engineering, 137, 106303. https://doi.org/10.1016/j.soildyn.2020.106303
- Fei, L., Deng, Y., & Hu, Y. (2018). DS-VIKOR: A new multi-criteria decision-making method for supplier selection. International Journal of Fuzzy Systems, 21(1), 157–175. https://doi.org/10.1007/s40815-018-0543-y
- Gordon, S. R. (2008). Supplier evaluation and performance excellence: A guide to meaningful metrics and successful results. J. Ross Publishing.
- Hanaysha, J. (2016). Testing the effects of employee empowerment, teamwork, and employee training on employee productivity in higher education sector. International Journal of Learning and Development, 6(1), 164–178. https://doi.org/10.5296/ijld.v6i1.9200
- Hoseini, A. R., Ghannadpour, S. F., & Ghamari, R. (2020). Sustainable supplier selection by a new possibilistic hierarchical model in the context of Z-information. Journal of Ambient Intelligence and Humanized Computing, 11(11), 4827–4853. https://doi.org/10.1007/s12652-020-01751-3
- Jauhar, S. K., & Pant, M. (2017). Integrating DEA with DE and MODE for sustainable supplier selection. Journal of Computational Science, 21, 299–306. https://doi.org/10.1016/j.jocs.2017.02.011
- Kannan, V. R., & Tan, K. C. (2002). Supplier selection and assessment: Their impact on business performance. The Journal of Supply Chain Management, 38(4), 11–21. https://doi.org/10.1111/j.1745-493X.2002.tb00139.x
- Kara, K., & Çetinkaya, A. S. L. I. (2022). Determination of Financial Performance Efficiency with Data Envelopment Analysis: Evidence from Borsa İstanbul (BIST) Transportation and Storage Sector. Journal of Emerging Economies and Policy (Online), 7(2).
- Karsak, E. E., & Dursun, M. (2014). An integrated supplier selection methodology incorporating QFD and DEA with imprecise data. Expert Systems with Applications, 41(16), 6995–7004. https://doi.org/10.1016/j.eswa.2014.06.020
- Kilincci, O., & Onal, S. A. (2011). Fuzzy AHP approach for supplier selection in a washing machine company. Expert Systems with Applications, 38(8), 9656–9664. https://doi.org/10.1016/j.eswa.2011.01.159
- Kim, S., Warinsiriruk, E., & Joy-A-Ka, S. (2019). Estimation of welding machine flexibility by using Data Envelopment Analysis (DEA) with Relative Closeness (RC). Proceedings of the 2019 4th Technology Innovation Management and Engineering Science International Conference (TIMES-iCON), Bangkok, Thailand (pp. 1–5). IEEE.
- Konings, M., Bak, M., Hanssen, M., Van, O. J., & Krabbendam, L. (2006). Validity and reliability of the CAPE: A self-report instrument for the measurement of psychotic experiences in the general population. Acta Psychiatrica Scandinavica, 114, 55–61. https://doi.org/10.1111/j.1600-0447.2005.00741.x
- LI, X., & B, L. I. U. (2006). A sufficient and necessary condition for credibility measures. International Journal of Uncertainty, 14(5), 527–535. https://doi.org/10.1142/S0218488506004175
- LI, X. M., LU, H. W., LI, J., DU, P., XU, M., & HE, L. (2015). A modified fuzzy credibility constrained programming approach for agricultural water resources management—A case study in Urumqi, China. Agricultural Water Management, 156, 79–89. https://doi.org/10.1016/j.agwat.2015.03.005
- LIN, S.-W., & LU, W.-M. (2023). A chance-constrained network DEA approach based on enhanced Russell-based directional distance measure to evaluate public sector performance: A case study of OECD countries. Annals of Operations Research. https://doi.org/10.1007/s10479-023-05337-y
- Masudin, I., Aprilia, G. D., Nugraha, A., & Restuputri, D. P. (2021). Impact of E-procurement adoption on company performance: Evidence from Indonesian manufacturing industry. Logistics, 5(1), 16. https://doi.org/10.3390/logistics5010016
- Masudin, I., LAU, E., Safitri, N. T., Restuputri, D. P., Handayani, D. I., & Tan, A. W. K. (2021). The impact of the traceability of the information systems on humanitarian logistics performance: Case study of Indonesian relief logistics services. Cogent Business & Management, 8(1), 1906052. https://doi.org/10.1080/23311975.2021.1906052
- Masudin, I., Ramadhani, A., & Restuputri, D. P. (2021). Traceability system model of Indonesian food cold-chain industry: A Covid-19 pandemic perspective. Cleaner Engineering and Technology, 4, 100238. https://doi.org/10.1016/j.clet.2021.100238
- Masudin, I., Safitri, N. T., Restuputri, D. P., Wardana, R. W., Amallynda, I., & Tan, A. W. K. (2020). The effect of humanitarian logistics service quality to customer loyalty using Kansei engineering: Evidence from Indonesian logistics service providers. Cogent Business & Management, 7(1), 1826718. https://doi.org/10.1080/23311975.2020.1826718
- Meng, M., & Liu, Y. (2007). Fuzzy data envelopment analysis with credibility constraints. Proceedings of the Fourth International Conference on Fuzzy Systems and Knowledge Discovery (FSKD 2007), Fuzhou, China (Vol. 1, pp. 149–153). IEEE.
- Meng, M., Yuan, G., & Huang, J. (2011). Satisficing data envelopment analysis model with credibility constraints. Proceedings of the 2011 Eighth International Conference on Fuzzy Systems and Knowledge Discovery (FSKD), Shanghai, China (Vol. 2, pp. 703–707). IEEE.
- Mirmousa, S., & Dehnavi, H. D. (2016). Development of criteria of selecting the supplier by using the fuzzy DEMATEL method. Procedia - Social & Behavioral Sciences, 230, 281–289. https://doi.org/10.1016/j.sbspro.2016.09.036
- Mohammadnazari, Z., Mousapour Mamoudan, M., Alipour-Vaezi, M., Aghsami, A., Jolai, F., & Yazdani, M. (2022). Prioritizing post-disaster reconstruction projects using an integrated multi-criteria decision-making approach: A case study. Buildings, 12(2), 136. https://doi.org/10.3390/buildings12020136
- Molamohamadi, Z., Ismail, N., Leman, Z., & Zulkifli, N. (2013). Supplier selection in a sustainable supply chain. Journal of Advanced Management Science, 278–281. https://doi.org/10.12720/joams.1.3.278-281
- Mousavi-Nasab, S. H., & Sotoudeh-Anvari, A. (2017). A comprehensive MCDM-based approach using TOPSIS, COPRAS and DEA as an auxiliary tool for material selection problems. Materials & Design, 121, 237–253. https://doi.org/10.1016/j.matdes.2017.02.041
- Peixoto, M. G. M., Musetti, M. A., & Mendonça, M. C. A. D. (2020). Performance management in hospital organizations from the perspective of principal component analysis and data envelopment analysis: The case of federal university hospitals in Brazil. Computers & Industrial Engineering, 150, 106873. https://doi.org/10.1016/j.cie.2020.106873
- Raith, A., Ehrgott, M., Fauzi, F., Lin, K.-M., Macann, A., Rouse, P., & Simpson, J. J. E. J. O. O. R. (2021). Integrating data envelopment analysis into radiotherapy treatment planning for head and neck cancer patients. European Journal of Operational Research, 296(1), 289–303. https://doi.org/10.1016/j.ejor.2021.04.007
- Rajesh, G., & Malliga, P. (2013). Supplier selection based on AHP QFD methodology. Procedia Engineering, 64, 1283–1292. https://doi.org/10.1016/j.proeng.2013.09.209
- Rashidi, K., & Cullinane, K. (2019). A comparison of fuzzy DEA and fuzzy TOPSIS in sustainable supplier selection: Implications for sourcing strategy. Expert Systems with Applications, 121, 266–281. https://doi.org/10.1016/j.eswa.2018.12.025
- Sevkli, M. (2009). An application of the fuzzy ELECTRE method for supplier selection. International Journal of Production Research, 48(12), 3393–3405. https://doi.org/10.1080/00207540902814355
- Soner Kara, S. (2011). Supplier selection with an integrated methodology in unknown environment. Expert Systems with Applications, 38(3), 2133–2139. https://doi.org/10.1016/j.eswa.2010.07.154
- Souza, D. E., Zice S, R., & Chaoyang, L. J. I. M. S. (2000). Supply chain dynamics and optimization. Integrated Manufacturing Systems, 11(5), 348–364. https://doi.org/10.1108/09576060010335627
- Stainer, A., Ghobadian, A., Liu, J., & Kiss, T. (2016). Vendor assessment: A computerised approach. International Journal of Computer Applications in Technology, 9(2–3), 106–113. https://doi.org/10.1504/IJCAT.1996.062302
- Tavassoli, M., Saen, R. F., & Zanjirani, D. M. (2020). Assessing sustainability of suppliers: A novel stochastic-fuzzy DEA model. Sustainable Production and Consumption, 21, 78–91. https://doi.org/10.1016/j.spc.2019.11.001
- Toloo, M., & Nalchigar, S. (2011). A new DEA method for supplier selection in presence of both cardinal and ordinal data. Expert Systems with Applications, 38(12), 14726–14731. https://doi.org/10.1016/j.eswa.2011.05.008
- Trafialek, J. (2019). The role of suppliers of raw materials in ensuring food safety. Global Journal of Nutrition & Food Science, 1(4). https://doi.org/10.33552/GJNFS.2019.01.000517
- Wang, J., Wang, J.-Q., Zhang, H.-Y., & Chen, X.-H. (2016). Multi-criteria group decision-making approach based on 2-tuple linguistic aggregation operators with multi-hesitant fuzzy linguistic information. International Journal of Fuzzy Systems, 18(1), 81–97. https://doi.org/10.1007/s40815-015-0050-3
- Wang, Y.-M., & Y, L. (2006). DEA efficiency assessment using ideal and anti-ideal decision making units. Applied Mathematics and Computation, 173(2), 902–915. https://doi.org/10.1016/j.amc.2005.04.023
- Wardana, R. W., Masudin, I., Restuputri, D. P., Nugraha, A., & Zhou, Z. (2021). A novel decision-making method using fuzzy DEA credibility constrained and RC index. Cogent Engineering, 8(1), 1917328. https://doi.org/10.1080/23311916.2021.1917328
- Wardana, R. W., Masudin, I., Restuputri, D. P., & Tan, Y. Y. (2020). A novel group decision-making method by P-robust fuzzy DEA credibility constraint for welding process selection. Cogent Engineering, 7(1), 1728057. https://doi.org/10.1080/23311916.2020.1728057
- Wen, T.-C., Chang, K.-H., & Lai, H.-H. (2020). Integrating the 2-tuple linguistic representation and soft set to solve supplier selection problems with incomplete information. Engineering Applications of Artificial Intelligence, 87, 103248. https://doi.org/10.1016/j.engappai.2019.103248
- Wen, M., LI, H. J. J. O. C., & Mathematics, A. (2009). Fuzzy data envelopment analysis (DEA): Model and ranking method. Journal of Computational and Applied Mathematics, 223(2), 872–878. https://doi.org/10.1016/j.cam.2008.03.003
- Wu, D. (2009). Supplier selection: A hybrid model using DEA, decision tree and neural network. Expert Systems with Applications, 36(5), 9105–9112. https://doi.org/10.1016/j.eswa.2008.12.039
- Zaim, S., Sevkli, M., & Tarim, M. (2003). Fuzzy analytic hierarchy based approach for supplier selection. Journal of Euromarketing, 12(3–4), 147–176. https://doi.org/10.1300/J037v12n03_09
- Zhang, C., & P, G. (2017). A generalized fuzzy credibility-constrained linear fractional programming approach for optimal irrigation water allocation under uncertainty. Journal of Hydrology, 553, 735–749. https://doi.org/10.1016/j.jhydrol.2017.08.008
- Zhou, X., Pedrycz, W., Kuang, Y., & Zhang, Z. (2016). Type-2 fuzzy multi-objective DEA model: An application to sustainable supplier evaluation. Applied Soft Computing, 46, 424–440. https://doi.org/10.1016/j.asoc.2016.04.038