
Abstract
The study of business ecosystem is highly popular among researchers and practitioners as a new and vital stream in strategic management. From this context, systematic literature reviews emphasizing the bibliometric analysis and VOSviewer visualization of business ecosystem studies are rarely conducted. These rare studies often involve all peer-reviewed articles, due to the theme being coined until the last decade. Therefore, this study aimed to evaluate the bibliometric and VOSviewer visualization analyses of business ecosystem through the consideration of the following keywords, namely co-occurrence, co-authorship, citation, bibliographic coupling, and co-citation. The evaluation also encompassed the retrieval of the scientific articles published within the last three decades from the Scopus database, where “business ecosystem” was frequently found in the titles, abstracts, or author keywords. In this case, the University of Cambridge and the United States were the most prolific affiliates of publishing documents, with the National Natural Science Foundation of China highly emphasizing sponsored funding. The results obtained enabled easier determination of rarely-analyzed research themes on business ecosystem, such as the sharing and circular economy, artificial intelligence, business ecosystem platforms, and innovation ecosystem. Besides, high-reputation journals and research management decision-making were also easily determined and facilitated.
PUBLIC INTEREST STATEMENT
As a new perspective, business ecosystem is an essential strategic management stream, which has new paradigm in innovation and collaboration. Besides, it also has high popularity among various study experts. This article uses bibliometric analysis and VOSviewer visualization to obtain trends in business ecosystem, through the Scopus database over the last three decades. This study also highlights the following, (1) the terms commonly found in titles, abstracts, or author keywords, (2) the most prolific affiliates in publishing documents, which are also popular funding sponsors, (3) the themes rarely analyzed, (4) highly reputable journals, (5) the collaboration o co-authors with others to produce articles, and (6) the most cited scientific articles.
1. Introduction
The study of business ecosystem was initially established by James F. Moore (Citation1993) in the article, “Predators and Prey: A New Ecology of Competition”, in the May–June Harvard Review. This indicated that a business entity was an industrial member and an organizational part combining various industries (Mäkinen & Dedehayir, Citation2012; Moore, Citation1993). Therefore, business ecosystem is defined as a perspective to understand the operational patterns of the economic community (Anggraeni et al., Citation2007). This is a new experimental perspective, which has advantages over other perceptions, including the fresh concepts in business collaboration (Majava et al., Citation2013; Yang et al., Citation2020) and innovation (Rinkinen & Harmaakorpi, Citation2018; Sun et al., Citation2020).
The study of business ecosystem is a new and vital stream in strategic management (Baghbadorani & Harandi, Citation2012; Sun et al., Citation2018) and has high popularity among experts and practitioners (Nuseibah & Wolff, Citation2015; Peltoniemi & Vuori, Citation2004). From this context, several reports conducted bibliometric analysis in business ecosystem, including Mäkinen and Dedehayir (Citation2012). This led to a systematic literature review to define business ecosystem members and their roles, as well as the evolution and change dynamics of the organizational environment. The evaluation also emphasized the articles contributing to the ecosystem analysis (8 articles) from the ISI Web of Knowledge database. Furthermore, Bonamigo et al. (Citation2016) conducted a systematic bibliometric review of dairy production from a business ecosystem perspective, by using 16 selected articles from various journal databases. The limitations of this report only included some peer-reviewed articles in the business ecosystem, namely only 8 and 16 peer-reviewed articles, respectively.
Jarvi and Kortelainen (Citation2017) also reviewed the organizational environment by involving 72 selected papers for 1993–2014, which were retrieved from the Scopus database. This analysis was responsible for describing the business, innovation, DBE (digital business ecosystem), and platform ecosystem. Faber et al. (Citation2019) further conducted a systematic mapping analysis to describe types of business ecosystem. This analysis involved the 136 selected articles retrieved from various databases, including Scopus, ScienceDirect, and Web of Science, subsequently leading to the evaluation of 12 types of business ecosystem. According to Espina-Romero et al. (Citation2022), a bibliometric and visualization analysis was conducted in the organizational environment, involving 96 Scorpus-database articles for 2018–2022. This prioritized business ecosystem topics and the primary information included in relevant scientific publications. The limitation of this study is that it only involved some of the years of observation in the last three decades.
Based on these descriptions, the systematic literature reviews emphasizing the 1993–2021 bibliometric and VOSviewer visualization analyses still need to be determined. Therefore, this study aims to evaluate the bibliometric and VOSviewer visualization analyses of business ecosystem, through the 29-year-old scientific articles retrieved from the Scopus database (closer to the last three decades). Evaluations involving all peer-reviewed articles in the last three decades can provide more comprehensive bibliometric information to the scientific community. It will also provide insight into the evolution of business ecosystem studies for researchers. According to van Eck and Waltman (Citation2010, Citation2011, Citation2014), VOSviewer software was very suitable for building and viewing bibliometric, co-citation-based author maps, and co-occurrence-oriented keyword maps, as well as open and accessible sources for the experimental community.
2. Theory
2.1. Business ecosystem
The early studies of business ecosystem (Iansiti & Levien, Citation2004; Moore, Citation1993) are responsible for using the analogies and metaphors of ecological biology and approach, to explain the role and interdependence of actors in the success and survival of organizational environment. In this context, several analogies are identified and emphasized (Peltoniemi & Vuori, Citation2004), including the industrial ecosystem, economic as an ecosystem, digital business ecosystem (DBE), and social ecosystems. Various reports have also significantly contributed to the development of business ecosystem, including Kandiah and Gossain (Citation1998), Adner (Citation2006), Adner and Kapoor (Citation2010), and Rong et al. (Citation2013).
A business ecosystem is an economic community supported by interactive organizations and individuals, including customers, suppliers, lead producers, financial institutions, trade associations and unions, standard bodies, government agencies, and other interested parties (Moore, Citation1993, Citation1998). It is also the dynamic structure containing a population of interrelated and dependent organizations (Peltoniemi, Citation2005; Peltoniemi et al., Citation2005). From this context, several organizations often aim to develop and share innovations, serve customer satisfaction, and achieve profits according to their respective capabilities, through competition, cooperation, or coordination (Barnett, Citation2006; Peltoniemi, Citation2006). In business ecosystem, the company is also capable of being developed in four stages, namely birth, expansion, leadership, and self-renewal/death (Moore, Citation1993). Furthermore, business ecosystem is commonly developed based on self-organization, emergence, co-evolution, and adaptation (Peltoniemi & Vuori, Citation2004). To understand the longevity and growth tendency of this ecosystem, subsequent health measurements also used three factors, including robustness, productivity, and niche creation (den Hartigh et al., Citation2006; Iansiti & Levien, Citation2002).
Business ecosystem also has a new paradigm in innovation (Rinkinen & Harmaakorpi, Citation2018; Sun et al., Citation2020) and collaboration (Majava et al., Citation2013; Yang et al., Citation2020), a fresh and vital stream of strategic management (Baghbadorani & Harandi, Citation2012; Sun et al., Citation2020), as well as high popularity among experts and practitioners (Nuseibah & Wolff, Citation2015; Peltoniemi & Vuori, Citation2004). However, several weaknesses are observed, including the use of many scholars with different definitions (Peltoniemi, Citation2005, Citation2006; Peltoniemi & Vuori, Citation2004). The weakness also involves the implementation of different data analysis techniques (Anggraeni et al., Citation2007; Kwon et al., Citation2017; Perfetto & Vargas-Sánchez, Citation2018), such as value network approach (Kwon et al., Citation2017; Prabowo et al., Citation2017; Tricahyono & Purnamasari, Citation2018; Wieringa et al., Citation2019), as well as narrative method and helix innovation model (Majava et al., Citation2013; Monika & Lantu, Citation2015).
As members of business ecosystem, the advantages for companies emphasizes the following, (1) opportunities to collaborate and develop in business networks, (2) protection from enemy threats (Peltoniemi, Citation2006), (3) shared fate among members (Iansiti & Levien, Citation2004), and (4) availability of innovative platforms (Baghbadorani & Harandi, Citation2012; Majava et al., Citation2013). Furthermore, the progress of specific companies are capable of impacting the progress of other organizations, which are members of business ecosystem. For the organizational disadvantage, changes often spread through the system and destroy specific high or low performing industries when part of the ecosystem is transformed (Peltoniemi, Citation2006). This shows that the decline of specific organization influences the underperformance of others, which are members of business ecosystem.
2.2. Bibliometric study
Bibliometric is a quantitative document analysis used to analyze scientific publications, obtain an research field overview, and acquire collaborations with other experts (Waltman & Noyons, Citation2018). It is also implemented to evaluate various analyses (Mongeon & Paul-Hus, Citation2016), measure output, as well as observe science and technology developments through the production of scientific literature in specific studies (Okubo, Citation1997). The bibliometric analysis also provides information on measuring the productivity, quality, and impact of articles, as well as identifying their work and contributions. Moreover, bibliometric information is available to support decision-making in research management and allocation of funds. It also helps to determine the highest-impact journals for scientists, as well as the most critical articles and journals on a specific topic for students (Agarwal et al., Citation2016).
The most common types of information and studies carried out in bibliometric analysis include the number of scientific articles (Agarwal et al., Citation2016), patents, literature, or document forms, state affiliations (Okubo, Citation1997), citations, open access status, and funding sponsors (Waltman & Noyons, Citation2018). It also involves authors (Fahimnia et al., Citation2015), co-citation networks, bibliographic coupling, keyword co-occurrence relations, co-authorship channels (Martins et al., Citation2022; Perianes-Rodriguez et al., Citation2016; van Eck & Waltman, Citation2014), organizational affiliation, journal titles (Putera et al., Citation2020), and the publication stages. However, the information does not often provide exact measurements due to only being an estimate. This indicates that decision-making needs adequate expert judgment because of its inability to solely depend on bibliometric information as the only basis (Waltman & Noyons, Citation2018).
2.3. VOS viewer
VOSviewer (visualization of similarities viewer) is a software tool developed by the Center for Science and Technology Studies, Leiden University, the Netherlands. This tool is available for free and valuable to the bibliometric and scientometric community (van Eck & Waltman, Citation2010, Citation2011). It is also an open-access software tool used for bibliometric visualization, including Pajek, Gephi, CiteSpace, Sci2, HistCite, and CitNetExplorer (van Eck & Waltman, Citation2014). In addition, VOSviewer is responsible for downloading data through the API and supporting various reference file managers, namely RIS, EndNote, and RefWorks.
VOSviewer software is found to comprehensively support the visualization of bibliometric maps. It also allows the analysis of all network data, including the development of co-citation and bibliographic coupling (van Eck & Waltman, Citation2014), publication citation networks, expert collaboration channels, and keywords co-occurrence media (van Eck & Waltman, Citation2010, Citation2011). This tool is subsequently used to build and visualize bibliometric networks, regarding the data retrieved from the databases of Scopus, Web of Science (Batmunkh et al., Citation2022; Perianes-Rodriguez et al., Citation2016), Dimensions, Lens, or Pubmed. In addition, VOSviewer is only capable of handling English scientific articles (van Eck & Waltman, Citation2014).
3. Research method and strategy
The evaluation was based on the scientific articles retrieved from the Scopus database on 5 August . This database was selected due to providing a broad scope of scientific literature and the capability for citation analysis (Agarwal et al., Citation2016; Falagas et al., Citation2008). It was also the common information source frequently used in bibliometric analysis (Waltman & Noyons, Citation2018), as the primary medium for citation data (Mongeon & Paul-Hus, Citation2016). In addition, the Scopus database provided comprehensive scientific resources for the study community (Khanra et al., Citation2020).
Based on Figure , the implemented strategy consists of three stages. Firstly, the retrieval of scientific articles in the Scopus database by using “business ecosystem” in the title, abstract, or keywords. In this stage, a total of 1,617 scientific articles were appropriately obtained. Secondly, more in-depth and specific scientific articles were retrieved through four search filters, including the publications from 1993 to 2021. From this context, early 1993 was applied because the study of business ecosystem was initially introduced by James F. Moore during the period. This was accompanied by the acquisition of data through subject area filtration, namely “Business, Management, and Accounting”, “Social Sciences”, and “Economics, Econometrics, and Finance”. Filtering was also carried out through document type, including “article”, “conference paper”, “book chapter”, “review”, “book”, and “conference review”. Moreover, filtering was conducted through language, namely “English”, which was the only recommended lingual form implemented and handled by VOSviewer. In this stage, the search strategy used a Boolean operator to carry out the following operation, (((TITLE-ABS-KEY (“business ecosystem”)) AND (PUBYEAR, < 2022) AND (PUBYEAR >1992)) AND (LIMIT-TO (SUBJAREA “BUSI”) OR LIMIT-TO (SUBJAREA, “SOCI”) OR LIMIT-TO (SUBJAREA “ECON”)) AND (LIMIT-TO (DOCTYPE “ar”) OR LIMIT-TO (DOCTYPE, “cp”) OR LIMIT-TO (DOCTYPE “ch”) OR LIMIT-TO (DOCTYPE, “re”) OR LIMIT-TO (DOCTYPE “bk”) OR LIMIT-TO (DOCTYPE “cr”)) AND (LIMIT-TO (LANGUAGE, “English”))). From this context, a total of 727 scientific articles were retrieved for subsequent analysis.
Figure 1. Research method and strategy.
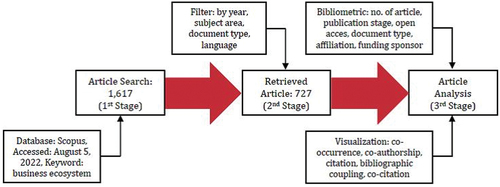
Thirdly, a bibliometric analysis was conducted, including the number of scientific articles, publication stages, open access status, document types, organizational affiliation, and sponsorship. Besides, a visualization analysis was also performed with VOSviewer, namely (1) the co-occurrence keyword measurement to help visualize the main research topics (Khanra et al., Citation2020), (2) the co-authorship analysis to observe the collaboration patterns among authors and determine the co-authors of the most cooperatively produced articles, and (3) the citation measurement to obtain the most cited publications. Bibliographic coupling analysis was also employed to determine the article sources that published the most relevant documents. In addition, co-citation analysis was performed to obtained the journals with high reputations and the most citations (Khanra et al., Citation2021).
4. Results
4.1. Number of scientific articles
Based on business ecosystem studies conducted over the last three decades (1993–2021), the total number of relevant scientific articles was 727. This estimation began to increase in 2013 and reached a total of 120 scientific publications in 2021 (Figure ). From this context, the average growth in the number of articles was 15.6% in 29 years. This result confirmed that more experts became interested in business ecosystem analysis. The number of scientific articles was also an indicator of expert productivity in a field (Okubo, Citation1997). Moreover, no publications were found in 1994–1995, 1997, 1999, and 2001. Based on the results, most of these articles (716 articles, 98.5%) were published and available for download in the Scopus database, with the remaining (11 articles, 1.5%) being press publications.
Figure 2. Number of scientific articles on business ecosystem studies indexed by Scopus.
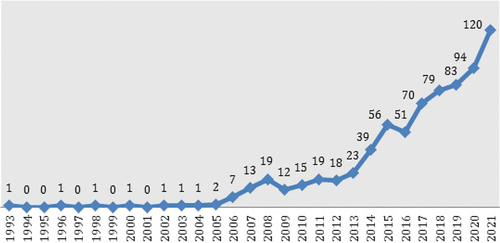
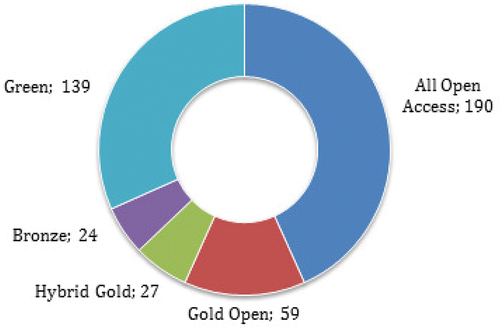
Figure shows that business ecosystem articles in the Scopus database were mainly categorized as “All Open Access” (43.3%), accompanied by the accepted manuscripts available in the repository (“Green”, 31.7%). It also displayed the distribution of documents across various types of journals, regarding their open access policies. This specifically emphasized the percentage of documents published in the following, (1) the publications exclusively providing open access (“Gold Open”, 13.4%), (2) the journals providing authors with the choice of publishing open access (“Hybrid Gold”, 6.2%), and (3) the manuscripts accepted for publication and subsequently granted temporary or permanent free access by the publisher (“Bronze”, 5.5%). Moreover, the study’s findings underscore the importance of open access in the dissemination of research within the business ecosystem analysis. The significant proportion of articles with open access status (43.3%) indicates the potential benefits it offers to various stakeholders. Firstly, open access provides access to research findings for individuals who may not have the means to afford access fees associated with traditional publishing models. By eliminating financial barriers, open access ensures that knowledge and information are accessible to a wider audience, including researchers from resource-constrained institutions, policymakers, practitioners, and the public. This inclusivity promotes equity in knowledge dissemination and enables broader societal impact. Furthermore, open access facilitates expert accessibility and enhances collaboration within the research community. By making research freely available, open access encourages interdisciplinary collaborations, data sharing, and the development of new insights and innovations. It fosters a culture of openness and transparency, enabling researchers to build upon existing work and advance the collective understanding of the business ecosystem.
Figure 3. Status of open access scientific articles in business ecosystem studies indexed by Scopus.
Additionally, open access promotes faster publication of research findings. Traditional publishing models often involve lengthy review processes and access restrictions, leading to delays in disseminating important research. Open access publication allows for immediate access to research outputs, accelerating the dissemination of knowledge and facilitating the rapid exchange of ideas within the academic community. It is worth noting that the proportion of open access articles in the business ecosystem analysis (43.3%) exceeds the average for articles across various fields (15.0%) (Agarwal et al., Citation2016). This indicates the growing recognition and adoption of open access within the business ecosystem research community, highlighting the advantages it offers in terms of accessibility, collaboration, and timely dissemination of findings. In conclusion, the study’s findings highlight the importance of open access in the business ecosystem analysis. Open access enables equitable access to research findings, promotes collaboration, accelerates publication timelines, and surpasses the average proportion of open access articles across various fields. Embracing open access in scholarly publishing contributes to a more inclusive and impactful research landscape.
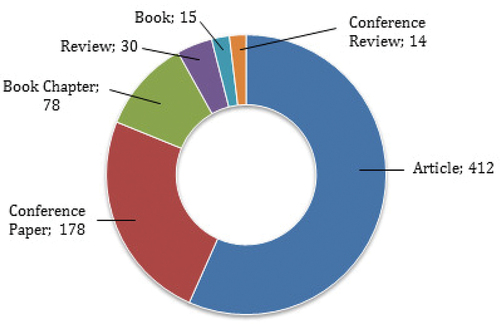
Based on Figure , 56.7%, 24.5%, 10.7%, 4.1%, 2.1%, and 1.9% of the scientific publications emphasized “Articles”, “Conference Paper”, “Book Chapter”, “Review”, “Conference Review”, and “Book”, respectively. This was in line with Okubo (Citation1997), where the basic mode used by the scientific community to convey new knowledge was through “Articles”. In addition, no patent data were found in the Scopus database for the bibliometric analysis of business ecosystem study over the last three decades.
Figure 4. Document type in the study of business ecosystem indexed by Scopus.
4.2. Organization affiliation and funding sponsor
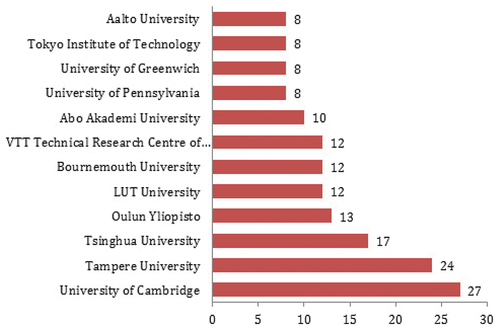
Based on the results, a total of 160 organizational affiliations were observed, including universities, schools, colleges, and research companies. From this context, the TOP 12 (Figure ) had the most organizational affiliations publishing documents in business ecosystem, namely the Universities of Cambridge (3.7%), Tampere (3.3%), Tsinghua (2.3%), Oulu (1.9%), LUT (1.7%), and Bournemouth (1.7%), as well as VTT Technical Research Center of Finland (1.7%). This was accompanied by the Universities of Abo Akademi (1.4%), Pennsylvania (1.4%), Greenwich (1.1%), and Aalto (1.1%), as well as Tokyo Institute of Technology (1.1%). Meanwhile, the remaining 148 affiliated organizations published less than 1% of each document. The study’s findings reveal a significant geographical domination in terms of organizational affiliations within the business ecosystem analysis, with European universities emerging as the dominant region. Specifically, the Universities of Cambridge and Tampere stand out as prominent contributors, underscoring the dominance observed in Europe. These findings emphasize the dominance of European universities, particularly the Universities of Cambridge and Tampere, in terms of organizational affiliations in the study of the business ecosystem. The research output and affiliation of these universities highlight Europe’s strong presence and expertise in advancing knowledge and understanding in this field.
Figure 5. TOP 12 affiliate organizations publishing scientific articles on business ecosystem studies indexed by Scopus.
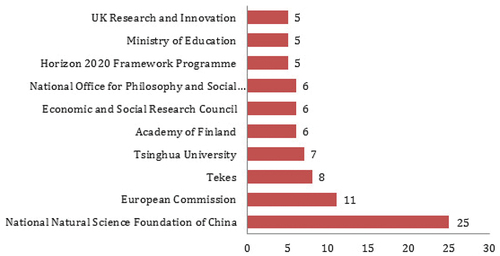
Metadata bibliometric also supported funding sponsor information (Figure ), where 138 sponsors were found in business ecosystem analysis over the last three decades. These sponsors included universities, research institutions, governments, and donor agencies. From the context, the National Natural Science Foundation of China was the largest funding sponsor with 25 documents (34.4%), accompanied by the European Commission, Tekes, and Tsinghua University with (1.5%), (1.1%), and (0.9%) publications, respectively. The Academy of Finland, Economic and Public Research Council, and National Office for Philosophy and Social Sciences also had 0.8% documents each, with the Horizon 2020 Framework Program, Ministry of Education, and Research-Innovation of UK all having 0.6% publications. Meanwhile, the remaining 128 sponsors funded less than 0.5% of the study documents. A total of 587 publications were also not supported by the sponsors (undefined). The study’s findings indicate a significant geographical domination in terms of funding sponsor within the business ecosystem analysis, with Asia emerging as the dominant region. These findings highlight the dominance of Asia, particularly China, in terms of funding support for the study of the business ecosystem. The National Natural Science Foundation of China and Tsinghua University’s contributions underscore the region’s significance and investment in this field of research. Moreover, it is important to note that the second geographical domination in terms of funding sponsors is observed in Europe. European funding sponsors, such as European Commission, the Academy of Finland, and various national research councils, have also made notable contributions to the business ecosystem analysis. These funding sources reflect Europe’s commitment to supporting research in this domain and highlight the region’s influence in advancing knowledge and understanding of the business ecosystem.
Figure 6. TOP 10 research sponsorship funding in business ecosystem indexed by Scopus.
5. Discussion
5.1. Keyword co-occurrence analysis
Keyword co-occurrence is a relationship between several key terms (van Eck & Waltman, Citation2014), whose appearances are observed together (Okubo, Citation1997) in the title, abstract, or author phrases in scientific publications. By using the VOSviewer software version 1.16.18 with the unit of analysis “author keywords”, the visualization of co-occurrence produced 1,993 keywords. From the selection of the minimum number of 5 co-occurrences, 45 related keywords were also produced (Figure ). In this case, the study of business ecosystem was strongly related to several terms, including innovation, value creation, strategic management, organizational model, small & medium enterprises (SMEs), and sustainability. This indicated that the terms closer in visualization were observed together in publications and considered to be highly relevant (Waltman & Noyons, Citation2018).
Figure 7. Network visualization keywords co-occurrence in business ecosystem studies.
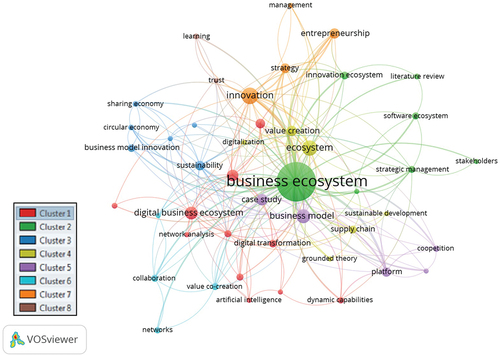
Based on the results, 45 keywords were also grouped into eight clusters. For Cluster 1 (red), 11 research themes were observed, with “Digital Business Ecosystem (DBE)” and “SMEs” being dominantly evaluated and marked by larger nodes. This showed that bigger nodes led to more popular representations, connections (van Eck & Waltman, Citation2014), and frequent discussion than other themes in the same cluster. Cluster 2 (green) also contained seven research themes, with “Business Ecosystem” being dominantly evaluated. Furthermore, Clusters 3 (blue) and 4 (light green) each contained six themes, with “Sustainability” and “Ecosystem” being dominantly emphasized, respectively.
Clusters 5 (purple), 6 (light blue), 7 (orange), and 8 (brown) also consisted of 5, 4, 4, and 2 research themes, with “Business Model”, “Value Co-creation”, “Innovation”, and “Learning” being dominantly discussed, respectively. Form these results, “Business Ecosystem” specifically appeared most frequently in the title, abstract, or author keywords (Table ), accompanied by “Innovation”, “Ecosystem”, and “Business Model”. Similarly, based on Figure , the node size also showed many publications (van Eck & Waltman, Citation2014), with the terms matching the title, abstract, or author keywords.
Table 1. TOP 13 terms in the study of business ecosystem, as indexed by Scopus in the title, abstract, or author keywords
From Table , the most popular keywords dominantly discussed were presented based on total link strength (Khanra et al., Citation2020), which prioritized the number of relationships among the study terms or keywords (van Eck & Waltman, Citation2014). This proved that “Business Ecosystem” was highly popular with a total link strength of 226, accompanied by “Innovation” and “Business Model”. In line with Figure , “Business Ecosystem” (green) and “Innovation” (orange) had the largest nodes, indicating that both themes were the most popular keywords dominantly discussed with many publications.
Based on the data analysis, the density of research themes in the business ecosystem can be represented using a map color scheme, as suggested by van Eck and Waltman (Citation2011). The map color indicates the level of density, with blue representing the lowest density and yellow representing the highest (Pradana et al., Citation2023). Interestingly, the analysis reveals that certain themes are relatively less studied in the business ecosystem literature. These emerging themes include sharing, circular economy, artificial intelligence, business ecosystem platform, and innovation ecosystem. These areas warrant further investigation in future analyses, as they present opportunities for exploring new research frontiers within the business ecosystem field. To delve deeper into these themes, it is recommended to conduct future studies incorporating specific keywords related to sharing, circular economy, artificial intelligence, business ecosystem platform, and innovation ecosystem. By employing relevant keywords, researchers can explore various sub-topics and dimensions within these emerging themes, contributing to a more comprehensive understanding of their implications for the business ecosystem. Furthermore, the data indicates that discussions around these research themes began to gain momentum in 2019. This suggests a recent surge in interest and attention towards these topics within the business ecosystem literature. As these themes continue to evolve, it becomes crucial for researchers to delve into their intricacies and explore their implications for businesses, ecosystems, and society at large.
In summary, the data analysis reveals that certain research themes, such as sharing, circular economy, artificial intelligence, business ecosystem platform, and innovation ecosystem, are relatively underexplored within the business ecosystem literature. It is recommended to conduct future studies using relevant keywords (Setyaningsih et al., Citation2018) to delve into these themes and develop a deeper understanding of their dimensions and implications. The data also highlights that these emerging themes gained prominence in discussions starting from 2019, indicating their growing importance within the business ecosystem field.
5.2. Co-authorship analysis
Co-authorship is the collaboration between researchers in joint programs, to produce scientific publications (Okubo, Citation1997) and show the network of available relationships between researchers (van Eck & Waltman, Citation2014). Based on the results, 1,594 experts of business ecosystem studies were observed over the last three decades, regarding the co-authorship visualization with the “Author” analysis unit. This was accompanied by the minimum selection of 2 documents for each author, with 199 experts subsequently observed to meet the threshold. In this case, only 28 authors were related, with the remaining parties being unrelated (Figure ). From the co-authorship bibliometric analysis, the collaboration of authors was grouped into 8 clusters. This indicated that Cluster 1 (red) contained 6 experts, accompanied by Clusters 2 (green), 3 (blue), 4 (light green), and 5 (purple), which consisted of 5 authors each, respectively. Meanwhile, the remaining three clusters contained two experts each.
Figure 8. Network visualization of authors collaboration to produce articles in business ecosystem indexed by Scopus.
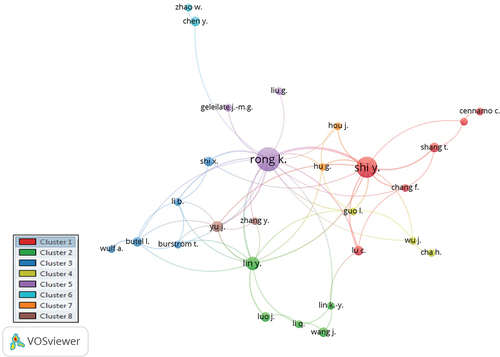
Based on the co-authorship visualization (Figure ), Rong, K. had the most significant node, whose size indicated the number of scientific publications produced (Waltman & Noyons, Citation2018). Almost all authors are also connected to the authors with the largest publications (İ̇yibildiren et al., Citation2023), namely Rong, K and Shi, Y. In this context, Rong, K. from Tsinghua University, Department of Economics, Beijing, China (Table ), produced the highest number of publications of 2.7% of documents. This was accompanied by Shi, Y. and Kapoor, R. from the Universities of Cambridge (the United Kingdom) and Pennsylvania (the United States), which had 2.1% and 1.1% documents, respectively. In addition, Dedehayir, O. and Makinen, S.J. had 0.9% documents each, with Lin, Y., Hellstrom, M., Wikstrom, K., and Hyrynsalmi, S., having 0.8% publications.
Table 2. TOP 9 Authors of business ecosystem studies indexed by Scopus
From the results, the co-authorship bibliometric analysis also supported the measurements of the relationship network between the countries of study experts (Okubo, Citation1997). By using the unit of analysis, “Countries”, and the minimum number of 5 documents in each nation, only 35 states met the threshold and were related, compared to the remaining that were unrelated. These country affiliations were subsequently grouped into 7 clusters. Based on the bibliometric metadata analysis, only 73 country affiliates were found for the authors publishing the theme of business ecosystem, with the TOP 10 related nations presented in Table . In this context, the United States was the most productive country with 15% documents, accompanied by the United Kingdom, Finland, and China with 14.6%, 11.0%, and 10.2% publications, respectively. Meanwhile, the remaining 69 country affiliates published less than 10% of each document.
Table 3. TOP 10 Most productive country affiliates publishing articles in business ecosystem studies indexed by Scopus
5.3. Citation analysis
Citation is the acknowledgment of previous reports by an expert, to track the influence of community science (Okubo, Citation1997), article impact measures, scientific quality (Waltman & Noyons, Citation2018), and alternative influential models. Based on the results, 727 documents were obtained through citation visualization, by using the analysis unit, “Documents”. By implementing a minimum number of 50 citations for each document, a total of 67 publications met the threshold. This contained 56 related and 11 unrelated documents (Figure ), which were grouped into 11 clusters.
Figure 9. Network visualization of article citations in business ecosystem studies indexed by Scopus.
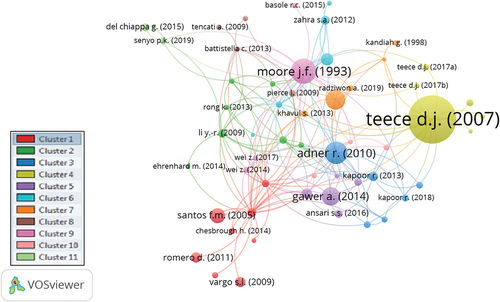
Based on the results, the scientific article from Teece (Citation2007) had the largest node and the most citations (Table ) for the publication entitled, “Explicating dynamic capabilities: the nature and microfoundations of (sustainable) enterprise performance”. In this case, the size of the node (Figure ) indicated the number of article citations from the scientific reports (van Eck & Waltman, Citation2014). This was accompanied by the articles of Moore (Citation1993) and Adner and Kapoor (Citation2010), which were entitled “Predators and prey: a new ecology of competition” and “Value creation in innovation ecosystems: how the structure of technological interdependence affects firm performance in new technology generations”, respectively. For the number of citations and total link strength, these three documents were popular articles (Khanra et al., Citation2022), authors (Khanra et al., Citation2021), or publications (Khanra et al., Citation2020) in the field of business ecosystem. In addition, 17522 documents cited 727 selected articles in the Scopus database.
Table 4. TOP 7 Scientific article citations in business ecosystem indexed by Scopus
5.4. Analysis bibliographic coupling
Bibliographic coupling is observed when similar reference is used by two different papers (Kessler, Citation1963; Palumbo et al., Citation2020). This is subsequently a first and second publication citing a third document (van Eck & Waltman, Citation2014), through the evaluation of five analysis units, namely “Documents”, “Article Source”, “Author”, “Organization”, and “Countries”. From the visualization of bibliographic coupling with “Article Sources” and the minimum number of 5 documents in each source, a total of 410 outputs were obtained, with only 18 meeting the threshold. These articles were grouped into 3 clusters, with 17 of them being related while the remaining were unrelated (Figure ).
Figure 10. Network visualization of article sources bibliographic coupling in the study of business ecosystem indexed by Scopus.
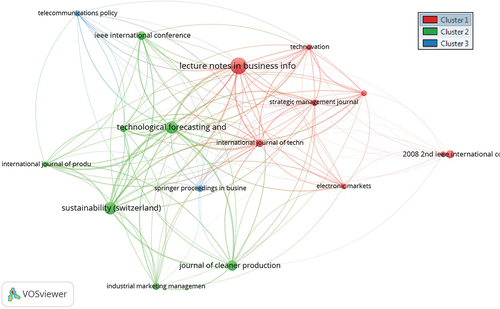
Based on the results, “Lecture Notes In Business Information Processing”, “Sustainability Switzerland”, and “Technological Forecasting & Social Change” published 39 (5.4%), 23 (3.2%), and 22 (3.0%) documents of bibliographic coupling, respectively. Meanwhile, the remaining 407 article sources published less than 3.0% of the documents each. From this context, no significant difference was observed in the percentage of the publications in the TOP 6 article sources. In Figure , almost all 3 clusters had similar node size, proving that “Article Sources” had interconnected links. Besides, no cluster was also dominant (Widianingsih et al., Citation2021) in the number of scientific publications.
5.5. Co-citation analysis
Co-citation is observed when two publications are jointly cited by other articles simultaneously (van Eck & Waltman, Citation2014). This analysis explains the following, (1) The number of times two publications are jointly cited, (2) The response of the study community to the outputs obtained (Okubo, Citation1997), and (3) The influence of the experts. Moreover, co-citation analysis is performed by implementing the VOSviewer or Gephi software. This was because some experts support the use of Gephi (Khanra et al., Citation2022), with others opting for VOSviewer (Fahimnia et al., Citation2015; van Eck & Waltman, Citation2014). The analysis also evaluates three analytical units, namely “References”. “Sources or Journals”, and “Authors”. For instance, Khanra et al. (Citation2021) used Gephi with “Author” as the unit of analysis in evaluating co-citations. Meanwhile, Abdullah and Khan (Citation2021) uses VOSviewer with the full counting method in co-citation analysis at the author level. These tools enable researchers to explore co-citation patterns and relationships within their data.
In this context, co-citation analysis using VOSviewer employs “Journals” as the unit of analysis. In VOSviewer visualization, the size of the nodes emphasizes the number of citations received by each journal. The VOSviewer analysis reveals that numerous journals are closely and jointly located, indicating strong co-citation relationships among them. Four distinct clusters of journals emerge: (1) Business Research and Industrial Marketing Management, (2) Research Policy and Technovation, (3) Management and Organization Studies, (4) Strategic Management and Organization Science. These closely located journals within the clusters exhibit significant co-citation relationships compared to others (van Eck & Waltman, Citation2014). By conducting co-citation analysis, researchers gain insights into the interconnections and relationships among journals in terms of citations. This analysis helps identify influential journals, key research themes, and scholarly communities within the field of study.
From the results, Strategic Management Journal was the most frequently cited journal (1,320) or popular publication (Khanra et al., Citation2020), regarding the co-citation with other articles (Table ). This was accompanied by Harvard Business Review and Research Policy, which had 992 and 642 citations, respectively. In this case, all journals in the TOP 8 business ecosystem co-citation network (Table ) had Q1 quartiles from the Scopus database. This confirmed that the “Business Ecosystem” theme was an interesting topic published in a highly reputable journal (Q1).
Table 5. TOP 8 Co-citation network journals in business ecosystem studies indexed by Scopus
6. Conclusion
The results of the bibliometric analysis conducted in this study shed light on the evolution of the business ecosystem field over the past three decades. Previous studies had primarily focused on short periods and limited peer-reviewed articles, which motivated the researchers to perform a comprehensive bibliometric analysis using VOSviewer visualization. This led to the performance of bibliometric analysis and VOSviewer visualization to examine the evolution of business ecosystem from its inception to the present decade. All peer-reviewed articles retrieved from the Scopus database were included, providing a broader understanding of the research landscape. The findings indicate that the concept of the business ecosystem gained increasing attention from researchers, particularly starting in 2013. This growing interest signifies its relevance and potential benefits for individuals who cannot afford access fees, highlighting the importance of open access in enabling equitable access to research findings. Open access facilitates collaboration, expedites publication timelines, and surpasses the average proportion of open access articles in various fields, contributing to a more inclusive and impactful research environment.
In terms of organizational affiliations, the Universities of Cambridge and institutions in the United States emerged as the most productive contributors to publishing documents in the business ecosystem field. The National Natural Science Foundation of China stood out as the highest funding sponsor, further emphasizing the geographical domination observed in the organizational affiliations and funding support within the business ecosystem analysis. The most frequently observed theme in the title, abstract, or author keywords was “Business Ecosystem,” indicating its popularity, high total link strength, and dominance in the research discourse. Additionally, the study identified several themes that were rarely analyzed but emerged in mid-2019, including the sharing and circular economy, artificial intelligence, business ecosystem platforms, and the innovation ecosystem. These themes present opportunities for future analysis and further exploration within the business ecosystem field. The study also revealed notable collaborations and highly cited scientific publications. Rong, K. from Tsinghua University was identified as the co-author of the most collaborative articles. At the same time, Teece, D.J. had highly cited publications, indicating their significant contributions to the field, a popular article, and a popular author. The Strategic Management Journal emerged with the highest reputation and citation, underscoring its prominence and influence in the business ecosystem literature. All journals in the TOP 8 in business ecosystem studies have a Q1 quartile and are popular publications.
Despite the valuable insights gained from this study, certain limitations should be acknowledged. The data retrieval was limited to the Scopus database and only encompassed three subject areas. Future studies should consider combining data from multiple databases such as Scopus, Web of Science, Ebsco, Dimensions, and PubMed, while also expanding the scope to involve more subject areas. This approach would provide more comprehensive bibliometric information and a more nuanced understanding of the business ecosystem field. In conclusion, future research in the business ecosystem field is encouraged to explore the rarely analyzed themes, such as the sharing economy, circular economy, artificial intelligence, business ecosystem platforms, and innovation business ecosystems. By addressing the identified limitations and further investigating these themes, researchers can advance the understanding and knowledge in the field of business ecosystems.
Acknowledgments
The authors are grateful to the Indonesia Endowment Funds for Education (Lembaga Pengelola Dana Pendidikan – LPDP) of the Ministry of Finance of Indonesia, for providing scholarships to the doctoral program at Padjadjaran University.
Disclosure statement
No potential conflict of interest was reported by the author(s).
Additional information
Funding
Notes on contributors

Ahmad Rifa’i
Ahmad Rifa’i is a Ph.D student in Business Administration, Padjadjaran University. He is a lecturer in Business Administration, Lampung University. He was also the secretary of Indonesia Managing Higher Education for Relevance and Efficiency Project, funded by the WB. His research interest on SME, industrial economic, and business ecosystem.
Sam’un Jaja Raharja
Sam’un Jaja Raharja is a Professor of business administration. His research focus on organisational behaviour, strategic management and collaboration. He serves on various journals as reviewer and consultant for public and private organisations.
Rivani Rivani
Rivani holds Ph.D in Business Administration from Polish Academy of Sciences, Poland. He has competencies in entrepreneurship, strategic management and digital marketing. He is a Director Center of Business Incubator, Padjadjaran University.
Ratih Purbasari
Ratih Purbasari holds Ph.D in entrepreneurial ecosystem from Universitas Indonesia. Her research focus on entrepreneurship, innovation and competitive advantage. She is active in student entrepreneurship development and collaborates with several entrepreneurial communities and government.
References
- Abdullah, A., & Khan, N. M. (2021). Determining mobile payment adoption: A systematic literature search and bibliometric analysis. Cogent Business & Management, 8(1), 1–18. https://doi.org/10.1080/23311975.2021.1893245
- Adner, R. (2006). Match your innovation strategy to your innovation ecosystem. Harvard Business Review, 84(4), 98–107; 148. https://hbr.org/2006/04/match-your-innovation-strategy-to-your-innovation-ecosystem
- Adner, R., & Kapoor, R. (2010). Value creation in innovation ecosystems: How the structure of technological interdependence affects firm performance in new technology generations. Strategic Management Journal, 31(3), 306–333. https://doi.org/10.1002/smj.821
- Agarwal, A., Durairajanayagam, D., Tatagari, S., Esteves, S. C., Harlev, A., Henkel, R., Roychoudhury, S., Homa, S., Puchalt, N. G., Ramasamy, R., Majzoub, A., Dao Ly, K., Tvrda, E., Assidi, M., Kesari, K., Sharma, R., Banihani, S., Ko, E., Abu-Elmagd, M., Gosalvez, J., & Bashiri, A. (2016). Bibliometrics: Tracking research impact by selecting the appropriate metrics. Asian Journal of Andrology, 18(2), 296–309. https://doi.org/10.4103/1008-682X.171582
- Anggraeni, E., Hartigh, E. D., & Zegveld, M. (2007, January 2007). Business ecosystem as a perspective for studying the relations between firms and their business networks. Eccon Annual Meeting 2007, 1–28. https://www.researchgate.net/publication/228931933_Business_ecosystem_as_a_perspective_for_studying_the_relations_between_firms_and_their_business_networks
- Baghbadorani, M. F., & Harandi, A. (2012). A conceptual model for business ecosystem and implications for future research. International Proceedings of Economics Development and Research – IPEDR, 52, 82–86. https://www.researchgate.net/publication/258821740_A_Conceptual_Model_for_Business_Ecosystem_and_Implications_for_Future_Research
- Barnett, M. L. (2006). The keystone advantage: What the new dynamics of business ecosystems mean for strategy, innovation, and sustainability by M. Iansiti & Roy Levien. Academy of Management Perspectives, 20(2), 88–90. https://doi.org/10.5465/amp.2006.20591015
- Batmunkh, A., Fekete-Farkas, M., & Zoltan, L. (2022). Bibliometric analysis of gig economy. Administrative Sciences, 12(2), 1–15. https://doi.org/10.3390/admsci12020051
- Bonamigo, A., Ferenhof, H. A., & Forcellini, F. A. (2016). Dairy production diagnosis in Santa Catarina, Brazil, from the perspective of business ecosystem. British Food Journal, 118(9), 2086–2096. https://doi.org/10.1108/BFJ-04-2016-0153
- den Hartigh, E., Visscher, W., & Tol, M. (2006, October 2021). October 2021). Measuring the health of a business ecosystem. ECCON 2006 Annual Meeting, 1–39. https://www.researchgate.net/publication/288583566_Measuring_the_health_of_a_business_ecosystem
- Espina-Romero, L., Guerrero-Alcedo, J., Noroño Sánchez, J. G., & Ochoa-Díaz, A. (2022). What are the topics that business ecosystems navigate? Updating of scientific activity and future research Agenda. Sustainability, 14(23), 16224. https://doi.org/10.3390/su142316224
- Faber, A., Riemhofer, M., Rehm, S. V., & Bondel, G. (2019). A systematic mapping study on business ecosystem types. 25th Americas Conference on Information Systems, AMCIS 2019 Proceedings, 2, 1–10. https://www.scopus.com/inward/record.uri?partnerID=HzOxMe3b&scp=85084019108&origin=inward
- Fahimnia, B., Sarkis, J., & Davarzani, H. (2015). Green supply chain management: A review and bibliometric analysis. International Journal of Production Economics, 162, 101–114. https://doi.org/10.1016/j.ijpe.2015.01.003
- Falagas, M. E., Pitsouni, E. I., Malietzis, G. A., & Pappas, G. (2008). Comparison of PubMed, scopus, web of science, and Google Scholar: Strengths and weaknesses. FASEB Journal, 22(2), 338–342. https://doi.org/10.1096/fj.07-9492lsf
- Gawer A and Cusumano M A. (2014). Industry Platforms and Ecosystem Innovation. Journal of product innovation management, 31(3), 417–433. https://doi.org/10.1111/jpim.12105
- Gretzel, U., Sigala, M., Xiang, Z., & Koo, C. (2015). Smart tourism: foundations and developments. Electron Markets, 25(3), 179–188. https://doi.org/10.1007/s12525-015-0196-8
- Iansiti, M., & Levien, R. (2002). The new operational dynamics of business ecosystems: Implications for policy, operations and technology strategy. Harvard Business School Working Paper 03-030, 03–030, 1–113. http://citeseerx.ist.psu.edu/viewdoc/download?doi=10.1.1.203.4002&rep=rep1&type=pdf
- Iansiti, M., & Levien, R. (2004). Strategy as Ecology. Harvard Business Review, 82(3), 68–81. https://hbr.org/2004/03/strategy-as-ecology
- İ̇yibildiren, M., Eren, T., & Ceran, M. B. (2023). Bibliometric analysis of publications on web of science database related to accounting information system with mapping technique. Cogent Business & Management, 10(1), 1–25. https://doi.org/10.1080/23311975.2022.2160584
- Jarvi, K., & Kortelainen, S. (2017). Taking stock of empirical research on business ecosystems: A literature review. International Journal of Business and Systems Research, 11(3), 215–228. https://doi.org/10.1504/IJBSR.2017.085469
- Kandiah, G., & Gossain, S. (1998). Reinventing value: The new business ecosystem. Strategy & Leadership, 26(5), 28–33. https://doi.org/10.1108/eb054622
- Kessler, M. M. (1963). Bibliographic coupling between scientific papers. American Documentation, 14(1), 10–25. https://doi.org/10.1002/asi.5090140103
- Khanra, S., Dhir, A., Kaur, P., Joseph, R. P., & Dhir, A. (2022). A resource-based view of green innovation as a strategic firm resource: Present status and future directions. Business Strategy and the Environment, 31(4), 1395–1413. https://doi.org/10.1002/bse.2961
- Khanra, S., Dhir, A., & Mäntymäki, M. (2020). Big data analytics and enterprises: A bibliometric synthesis of the literature. Enterprise Information Systems, 14(6), 737–768. https://doi.org/10.1080/17517575.2020.1734241
- Khanra, S., Dhir, A., Parida, V., & Kohtamäki, M. (2021). Servitization research: A review and bibliometric analysis of past achievements and future promises. Journal of Business Research, 131, 151–166. https://doi.org/10.1016/j.jbusres.2021.03.056
- Kwon, H. I., Kim, S. H., Park, J. S., & Hong, M. G. (2017). A study on business ecosystem of 3D printing contents distribution platform: Using service value network analysis. International Journal of Applied Engineering Research, 12(24), 15580–15591. http://www.ripublication.com/ijaer17/ijaerv12n24_228.pdf
- Majava, J., Isoherranen, V., & Kess, P. (2013). Business collaboration concepts and implications for companies. International Journal of Synergy and Research, 2(1), 23–40. https://journals.umcs.pl/ijsr/article/view/1358
- Mäkinen, S. J., & Dedehayir, O. (2012). Business ecosystem evolution and strategic considerations: A literature review. 18th International Conference on Engineering, Technology and Innovation, ICE 2012 - Conference Proceedings, 207–216. https://doi.org/10.1109/ICE.2012.6297653
- Martins, T., Braga, A., Ferreira, M. R., & Braga, V. (2022). Diving into social innovation: a bibliometric analysis. Administrative Sciences, 12(2), 1–18. https://doi.org/10.3390/admsci12020056
- Mongeon, P., & Paul-Hus, A. (2016). The journal coverage of web of science and scopus: A comparative analysis. Scientometrics, 106(1), 213–228. https://doi.org/10.1007/s11192-015-1765-5
- Monika, G. S., & Lantu, D. C. (2015). An action research to map and describe the business ecosystem of muslim fashion industry in Bandung in form of a short movie. Journal of Business and Management, 4(10), 1107–1118. https://journal.sbm.itb.ac.id/index.php/jbm/article/view/1817
- Moore, J. F. (1993). Predators and prey: A new ecology of competition. Harvard Business Review, 71(3), 75–86. https://hbr.org/1993/05/predators-and-prey-a-new-ecology-of-competition
- Moore, J. F. (1998). The rise of a new corporate form. The Washington Quarterly, 21(1), 167–181. https://doi.org/10.1080/01636609809550301
- Nuseibah, A., & Wolff, C. (2015). Business ecosystem analysis framework. Proceedings of the 2015 IEEE 8th International Conference on Intelligent Data Acquisition and Advanced Computing Systems: Technology and Applications, IDAACS 2015, 2, 501–505. https://doi.org/10.1109/IDAACS.2015.7341356
- Okubo, Y. (1997). Bibliometric indicators and analysis of research systems: Methods and examples. OECD Science, Technology and Industry Working Papers, No. 1997/01, OECD Publishing, Paris, 1–71. https://doi.org/10.1787/208277770603
- Palumbo, R., Manesh, M. F., Pellegrini, M. M., & Flamini, G. (2020). Exploiting inter-organizational relationships in health care: A bibliometric analysis and literature review. Administrative Sciences, 10(3), 1–23. https://doi.org/10.3390/admsci10030057
- Peltoniemi, M. (2005). Business ecosystem: A conceptual model of an organisation population from the perspectives of complexity and evolution. In E-Business Research Center (EBRC). Research Reports 18 (pp. 1–93). Tampere University of Technology (TUT) and University of Tampere (UTA). https://www.researchgate.net/publication/317355297_Business_ecosystem_a_conceptual_model_of_an_organisation_population_from_the_perspectives_of_complexity_and_evolution
- Peltoniemi, M. (2006). Preliminary theoretical framework for the study of business ecosystems. Emergence: Complexity and Organization (E: CO), 8(1), 10–19. https://www.researchgate.net/publication/244998428_Preliminary_theoretical_framework_for_the_study_of_business_ecosystems
- Peltoniemi, M., & Vuori, E. (2004). Business ecosystem as the new approach to complex adaptive business environments. Proceedings of EBusiness Research Forum, 267–281. https://www.researchgate.net/publication/228985086_Business_Ecosystem_as_the_New_Approach_to_Complex_Adaptive_Business_Environments
- Peltoniemi, M., Vuori, E., & Laihonen, H. (2005). Business ecosystem as a tool for the conceptualisation of the external diversity of an organisation. In Proceedings of the Complexity, Science and Society Conference, 11–14. https://www.researchgate.net/publication/245591546_Business_ecosystem_as_a_tool_for_the_conceptualisation_of_the_external_diversity_of_an_organisation
- Perfetto, M. C., & Vargas-Sánchez, A. (2018). Towards a smart tourism business ecosystem based on industrial heritage: Research perspectives from the mining region of Rio Tinto, Spain. Journal of Heritage Tourism, 13(6), 528–549. https://doi.org/10.1080/1743873X.2018.1445258
- Perianes-Rodriguez, A., Waltman, L., & van Eck, N. J. (2016). Constructing bibliometric networks: A comparison between full and fractional counting. Journal of Informetrics, 10(4), 1178–1195. https://doi.org/10.1016/j.joi.2016.10.006
- Prabowo, F. S. A., Rahadi, R. A., & Alamanda, D. T. (2017). Decomposing the problems of traditional markets business ecosystem in Indonesia. International Journal of Public Sector Performance Management, 3(4), 375–397. https://doi.org/10.1504/IJPSPM.2017.087657
- Pradana, M., Elisa, H. P., & Utami, D. G. (2023). Mental health and entrepreneurship: A bibliometric study and literature review. Cogent Business & Management, 10(2), 1–12. https://doi.org/10.1080/23311975.2023.2224911
- Putera, P. B., Suryanto, S., Ningrum, S., & Widianingsih, I. (2020). A bibliometric analysis of articles on innovation systems in scopus journals written by authors from Indonesia, Singapore, and Malaysia. Science Editing, 7(2), 177–183. https://doi.org/10.6087/KCSE.214
- Rinkinen, S., & Harmaakorpi, V. (2018). The business ecosystem concept in innovation policy context: Building a conceptual framework. Innovation: The European Journal of Social Science Research, 31(3), 333–349. https://doi.org/10.1080/13511610.2017.1300089
- Rong, K., Shi, Y., & Yu, J. (2013). Nurturing business ecosystems to deal with industry uncertainties. Industrial Management & Data Systems, 113(3), 385–402. https://doi.org/10.1108/02635571311312677
- Setyaningsih, I., Indarti, N., & Jie, F. (2018). Bibliometric analysis of the term “green manufacturing. International Journal of Management Concepts and Philosophy, 11(3), 315. https://doi.org/10.1504/ijmcp.2018.093500
- Sun, Q., Wang, C., Zhou, Y., Zuo, L., & Tang, J. (2020). Dominant platform capability, symbiotic strategy and the construction of “Internet + WEEE collection” business ecosystem: A comparative study of two typical cases in China. Journal of Cleaner Production, 254, 1–13. https://doi.org/10.1016/j.jclepro.2020.120074
- Sun, Q., Wang, C., Zuo, L. S., & Lu, F. H. (2018). Digital empowerment in a WEEE collection business ecosystem: A comparative study of two typical cases in China. Journal of Cleaner Production, 184, 414–422. https://doi.org/10.1016/j.jclepro.2018.02.114
- Teece, D. J. (2007). Explicating dynamic capabilities: The nature and microfoundations of (sustainable) enterprise performance. Strategic Management Journal, 28(13), 1319–1350. https://doi.org/10.1002/smj.640
- Tricahyono, D., & Purnamasari, S. R. (2018). Business ecosystem of SMEs with value network analysis approach: A case study at Binong Jati Knitting industrial centre (BJKIC) Bandung. Pertanika Journal of Social Sciences and Humanities, 26(T), 113–118. http://search.ebscohost.com/login.aspx?direct=true&profile=ehost&scope=site&authtype=crawler&jrnl=01287702&AN=134101544&h=fn81BKH9v9X6H6BXe34ZY%2FKs5EgFtpEtlniyyBxTLBjHzEPcBKPr3ltt%2Bt%2BvG5kXc98LeEe6%2BpWKt5nHCh4JeQ%3D%3D&crl=c
- van Eck, N. J., & Waltman, L. (2010). Software survey: VOSviewer, a computer program for bibliometric mapping. Scientometrics, 84(2), 523–538. https://doi.org/10.1007/s11192-009-0146-3
- van Eck, N. J., & Waltman, L. (2011). Text mining and visualization using VOSviewer. ISSI Newsletter, 7(3), 50–54. https://doi.org/10.48550/arXiv.1109.2058
- van Eck, N. J., & Waltman, L. (2014). Visualizing bibliometric networks. In Y. Ding, R. Rousseau, & D. Wolfram, eds., Measuring Scholarly Impact (pp. 285–320). Springer, Cham.
- Waltman, L., & Noyons, E. (2018). Bibliometrics for research management and research evaluation: A brief introduction. The Center for Science and Technology Studies (CWTS), Leiden University, 1–24. https://www.cwts.nl/bibliometrics-for-research-management-and-research-evaluation
- Widianingsih, I., Paskarina, C., Riswanda, R., & Putera, P. B. (2021). Evolutionary Study of watershed governance research: A bibliometric analysis. Science and Technology Libraries, 40(4), 416–434. https://doi.org/10.1080/0194262X.2021.1926401
- Wieringa, R., Engelsman, W., Gordijn, J., & Ionita, D. (2019). A business ecosystem architecture modeling framework. Proceedings - 21st IEEE Conference on Business Informatics, CBI 2019, 1, 147–156. https://doi.org/10.1109/CBI.2019.00024
- Yang, X., Cao, D., Chen, J., Xiao, Z., & Daowd, A. (2020). AI and IoT-based collaborative business ecosystem: A case in Chinese fish farming industry. International Journal of Technology Management, 82(2), 151–171. https://doi.org/10.1504/IJTM.2020.107856