
 ?Mathematical formulae have been encoded as MathML and are displayed in this HTML version using MathJax in order to improve their display. Uncheck the box to turn MathJax off. This feature requires Javascript. Click on a formula to zoom.
Abstract
The study of the influence of service sector expansion on tax revenue is critical, but it has received little attention. The majority of the studies focused on how the service sector affects economic growth. This study aims to investigate how Tanzania’s expanding service sector affects tax revenue. This study used autoregressive distributed lag (ARDL) bounds testing to examine the influence of service sector growth on tax revenue in Tanzania for the period 1970–2018. Results show that service sector growth has a positive influence on tax revenue. Specifically, the government service sector and the trade service sector are confirmed to have a positive and significant influence on tax revenue in Tanzania. The business service sector, the transport service sector, and the personal service sector show insignificant results. This study contributes to the service sector and tax revenue literature by providing evidence showing that service sector growth can influence tax revenue. This paper presents a straightforward tax revenue collection model within the service sector, which holds significant implications for tax authorities, government entities, and policymakers. These findings suggest that improving tax policy can be achieved by targeting specific service subsectors.
1. Introduction
The expansion of the service sector, according to many economists, has a significant impact on countries’ economic growth. Among others, Shingal (Citation2014), Singh and Kaur (Citation2014), Thomas (Citation2015) and Wu (Citation2007) have stated that the dramatic expansion of the service sector has significantly aided India’s and China’s economic growth. The rate of globalisation in services is accelerating. Mann (Citation2004), thus the service sector is viewed as a means of economic change, as not all nations have a competitive advantage in manufacturing (UNECA, Citation2015). Furthermore, the effectiveness and efficiency of the tax revenue collection systems are critical because tax revenues are required to fund the government’s development as well as the country’s economic growth. Despite the importance of tax revenue, most Sub-Saharan African (SSA) governments collect insufficient tax revenue, which is insufficient for supporting citizens’ welfare (Abdu & Adem, Citation2023; Jemiluyi & Jeke, Citation2023; World bank, Citation2020). Statistical data reveal that the tax revenue to GDP ratio in SSA is 16.5%, which is less than the United Nations standard of 20% for supporting citizens’ welfare (World Bank, Citation2020). Furthermore, while taxation contributes significantly to the government’s total revenue, Tanzania’s tax contribution is viewed as low in comparison to the United Nations (UN) standard, as it collects on average 11.46%, which is less than the UN standard of 20%.
The sectoral composition of an economy is important in determining tax revenues (Rahim & Asma, Citation2019). According to Arodoye and Izevbigie (Citation2019), value added in sectors of the economy influences tax revenue collection. The effectiveness of the tax collection system is attributed to sector growth (Mawejje & Munyambonera, Citation2016). Tax revenue influences economic growth in a variety of ways, with the service sector being a key transmission channel. Furthermore, the service sector is one of the sectors that is easiest to tax with certainty compared agriculture sector (Rahim & Asma, Citation2019). Tax revenue is higher in countries where services have developed (Karagöz, Citation2013). According to Cevik et al. (Citation2019), between 1970 and 2014, the share of GDP value contributed by services moved up by 10% in both developed and developing countries, while the share of agriculture fell.
Statistical data in Tanzania showed that the share of the service sector in GDP increased from 33.3% in 1990 to 36.25 in 2020, while the agriculture sector decreased from 42.04% in 1990 to 26.73% in 2020 (Bank of Tanzania (BoT), Citation2019; World bank, Citation2020). Furthermore, the yearly economic growth rate has improved from 0.6% to 6.9% in 1992 and 2017, respectively; the average growth rate was 5.2% from 1990 to 2018 (Epaphra & Kaaya, Citation2020). This data suggests that Tanzania’s economic growth has grown more broad-based and driven by the services sector (Bank of Tanzania (BoT), (Citation2019) (2019); World bank (Citation2020). The Modern Economic Growth Theory has firmly established that government services demonstrate income elasticity. Accordingly, there is a positive relationship between a nation’s degree of development and the expansion of government goods and services, resulting in a subsequent increase in economic growth. This, in turn, has the potential to generate higher tax revenue (Kuznets, Citation1966). Furthermore, it has been posited by Tax Level Determinant Theory that the service sector is a significant predictor of tax revenue in emerging nations, impacting the collection of tax revenue (Lotz & Morss, Citation1967). Therefore, the growth of the service sector is a significant factor that impacts tax revenue.
The majority of existing studies have focused on the impact of the service sector on economic growth (Shingal, Citation2014; Singh & Kaur, Citation2014; Thomas, Citation2015; Uwitonze & Heshmati, Citation2016; Wu, Citation2007). It is important to investigate the impact of service sector growth on tax revenue since tax revenue is one of the components of economic growth. Regrettably, there exists a scarcity of research pertaining to the impact of the service sector on tax revenue, particularly with regards to the disaggregated value added of the service sector (Cevik et al., Citation2019). The majority of the studies have focused on examining the overall value added of the service sector and its impact on tax revenue (Arodoye & Izevbigie, Citation2019; Epaphra & Kaaya, Citation2020, Mebratu et al., Citation2020; Permadi & Wijaya, Citation2022; Rahim & Asma, Citation2019; Sarmento, Citation2016).
Moreover, it should be noted that the study of overall value added of the service sector and its impact on tax revenue is mostly done in other countries, as there is a scarcity of studies conducted within the setting of emerging economies such as Tanzania (Epaphra & Kaaya, Citation2020). In addition, the study conducted by Epaphra and Kaaya (Citation2020) did not consider the disaggregation of the value added within the service sector, instead focusing on the overall aggregate value added. Tracing the impact of individual subsectors on the enhancement of effective tax revenue is of utmost importance, as the expansion of the service sector serves as a significant conduit for the improvement of tax revenue. The central question that has motivated the initiation of this research is: what is the degree of influence exerted by the growth of the service sector on the generation of tax revenue? Furthermore, this study aims to examine the extent to which service subsectors impact tax revenue, as there is a dearth of empirical research on the specific value of service subsectors on tax revenue. In a similar vein, the majority of scholarly investigations have endeavoured to examine the influence of the service sector on tax revenue by employing cross-sectional and, more recently, panel data approaches. Nevertheless, there is a dearth of research that particularly investigates individual countries within this particular environment. Cross-sectional analysis, a commonly used method, fails to account for temporal changes, whereas panel data analysis incorporates both cross-sectional and temporal information. In the setting of panel data analysis, it becomes challenging to distinguish the behaviour of independent variables within a particular country due to the presence of unique characteristics that may vary among a group of countries. As a result, a time series analysis for a single country has unique value. Epaphra and Kaaya (Citation2020) used shorter time series data to investigate the effect of sectoral composition on tax revenue in Tanzania. One limitation associated with shorter time series data is its inability to comprehensively capture and differentiate between short-term and long-term fluctuations. It is a long-term objective to improve tax revenue, and service sector growth is a long-term process that takes more time to experience (Coulibaly & Gandhi, Citation2018). To close the gap, this study will use longer time series data so as to be able to identify the short run and long run influence of service sector on tax revenue. The disadvantage of longer time series data is that sometimes it provides meaningless results. However, this study effectively tackles this issue by utilising the Autoregressive Distributed Lag (ARDL) model. This model is advantageous as it allows for the inclusion of an adequate number of lags, enabling a comprehensive representation of the data-generating process within a general-to-specific modelling framework (Shrestha & Bhatta, Citation2018). Therefore, the main objective of this study is to investigate the influence of the expansion of the service sector on tax revenue, with a focus on analysing disaggregated value added. Consequently, the present study aims to provide the following contributions to the existing body of literature: First, this study will expand our understanding of the level of tax revenue generated by service sector growth. This, in turn, will aid the government to know the proper channel under service sector for tax revenue collection. Second, this study will assist policymakers in enhancing tax policy by focusing on specific subsector contributions to tax revenue collection. Thirdly, this study provides new insights on the service subsectors and their influence on tax revenue collection in Tanzania. Fourth, this study makes a theoretical contribution by demonstrating that Modern Economic Growth Theory may be integrated with Tax Level Determinant Theory to provide a comprehensive understanding of tax revenue performance. Furthermore, theoretically, this study contributes by providing the specific service subsectors that can influence tax revenue, which the theories did not mention. It is different from other studies in that it uses longer time series regression analysis to evaluate each subsector under the service sector and establish its influence on tax revenue. Although Cevik et al. (Citation2019) evaluated some of the subsectors under the services sector and tax revenue in developing countries, their study used panel data as well as a single type of tax, which is VAT. In Tanzania, studies have been selective about the share of aggregate value added by the service sector, ignoring the influence of each subsector. Therefore, it is important to measure the influence of the service sector on tax revenue based on each subsector in Tanzania. Given all scenarios, this paper intends to study the influence of the service sector on tax revenue in Tanzania. The present study is structured as follows: Section 2 of the paper explains tax revenue and the service sector in Tanzania. Section 3 of the paper delves into the examination of the theoretical literature review, while Section 4 proceeds to provide the empirical literature review and the subsequent development of hypotheses. The discussion of the research design is included in Section 5. The findings are presented and analysed in Section 6. Section 7 provides an analysis of the key findings and presents the concluding remarks of the study.
2. Tax revenue and service sector in Tanzania
In Tanzania, Tanzania Revenue Authority (TRA) is the one which is responsible to collect tax since 1996. Ministries, Departments, and Agencies (MDAs) on the other hand are responsible for the collection of non- taxation revenue (The United Republic of Tanzania, Citation2004). Prior to the commencement of operation by TRA in 1996, the responsibility of collecting taxation was vested to the Ministry of Finance. The Ministry had three revenue Departments which were the Income Tax Department, Customs and Excise Department and the Sales Tax and Internal Revenue Department. TRA was formed in 1995 by the Act of Parliament No. II of 1995. One among of several objectives of establishing TRA was to enhance revenue collection by strengthening tax administration (Rwechungura, Citation2016; The United Republic of Tanzania, Citation2004). Despite the introduction of TRA, tax revenue collection was not satisfactory. Furthermore, most of the developing countries including Tanzania depend on narrow tax base for revenue generation. At the country level, a narrow tax base can create underperformance of tax revenue (tax gap) due to differences between expected tax revenue and actual tax revenue collected (Wahab et al., Citation2022).
Continuous serious efforts have been taken by the government of Tanzania to improve tax revenue. Tanzania’s tax systems have undergone significant tax administration and policy reforms with the objective of expanding the tax base and enhancing tax collection more efficient in response to fiscal crisis and the demand for economic and social development. To begin with, the implementation of reforms has been primarily directed towards the modernization of the tax system and the enhancement of managerial and technical capabilities within the Tanzania Revenue Authority (TRA). These measures aim to improve the efficiency and effectiveness of tax administration. Consequently, the Tax Revenue Authority (TRA) successfully implemented several key initiatives, including the introduction of a taxpayer identity number (TIN), the construction of the Large Taxpayers Department (LTD), and the integration of the tax appeals system. Furthermore, in 1990, there was a reduction in both the personal income tax and the maximum marginal corporation tax rate, bringing them down to 30% (Kim & Kim, Citation2018). Additionally, in 1992, efforts were made to streamline the customs tariff structure, and in 1998, the Value Added Tax (VAT) system was introduced (Kim & Kim, Citation2018). Notwithstanding the aforementioned endeavours, Tanzania’s tax contribution is seen as somewhat inadequate, as it typically accumulates an average of 11.46%, falling short of the benchmarks established by the United Nations (UN) at 20%. The data presented suggests that the level of tax collection in Tanzania is insufficient to adequately fund social services.
In the context of service sector it has been documented by the past studies that the service sector has an impact on the collection of tax revenue (Arodoye & Izevbigie, Citation2019; Rahim & Asma, Citation2019). According to the Bank of Tanzania (Citation2019), the service sector in Tanzania has experienced a significantly higher rate of growth in comparison to the industry and agriculture sectors. The rapid pace at which services are being globalised has led to the perception of this sector as a potential catalyst for economic transformation, with potential implications for tax revenue. In Tanzania, the service sector is subdivided into various subsectors, but trade services, transport and storage services, business services, government services, and personal services are noted to have seen dramatic increases. The quick growth of Tanzania’s service sector is notable for the rapid growth of these subsectors (Bank of Tanzania, Citation2019). If this is a track of the service sector, what is its influence on tax revenue collection? The process of structural transformation that results in an increase in the service sector and a decrease in the agriculture sector is a multifaceted phenomenon that may have an impact on tax revenue collection (Cevik et al., Citation2019).
Understanding the impact of service subsectors, including trade services, transport services, government services, personal services, and business services, on tax revenue is of significant importance. This is due to the notable trend of rapid growth observed within these subsectors, as documented by the Bank of Tanzania in 2019. Unfortunately, policymakers lack knowledge regarding the specific contributions of each service subsectors, as existing research have primarily focused on examining the impact of the service sector’s aggregate value added share on tax revenue. Enhanced comprehension of the impact exerted by individual subsectors might yield more effective policy alternatives aimed at enhancing tax revenue performance. However, there is a scarcity of empirical research about the impact of service sector expansion, particularly within specific subsectors, on tax revenue in Tanzania. This study aims to examine the impact of the growth of the service sector on tax revenue. Specifically, it will analyse the disaggregated value added for each subsector within the service industry. Therefore, given the substantial expansion of the service sector and the low tax revenue collection in Tanzania, it may be argued that Tanzania presents an appropriate context for this empirical examination.
3. Theoretical literature review
The Tax Level Determinants Theory has been utilised to provide a framework for understanding the main tax revenue determinants. Lotz and Morss developed the idea in 1967, identifying sectoral composition, which comprises the service, industrial, and agricultural sectors, as the key tax revenue determinants in developing countries. A theory has also been discovered that the tax base in developing countries is a critical driver of tax revenue. According to the Tax Level Determinant Theory, when deciding on tax revenue collection, the share of aggregate values added in various sectors of the economy should be considered.
The influential research conducted by Lotz and Morss (Citation1967) on the factors influencing tax levels has served as a catalyst for several studies exploring the composition of different sectors. Bird et al. (Citation2008), Ghura (Citation1998) and Gupta (Citation2007) employed the Lotz and Morss (Citation1967) model as a framework to elucidate the factors influencing tax revenue. The researchers previously provided an explanation for the independent variable, specifically the tax base in various sectors of the economy (including service, industrial, and agriculture sectors), as well as the dependent variable, which is tax revenue. In recent times, scholars have also employed this theoretical framework to elucidate the phenomenon of sectoral composition and the process of tax revenue collecting. Arodoye and Izevbigie (Citation2019) as well as Mawejje and Munyambonera (Citation2016) employed the aforementioned theory in order to elucidate the relationship between sectoral composition and the collection of tax revenue. Empirical research undertaken by Karagöz (Citation2013) has demonstrated that various sectors of the economy exert a significant influence on tax revenue. Previous studies have employed a theoretical framework that emphasises the significance of the tax base as a crucial predictor of tax revenue. This theory effectively complements the study since it emphasises the significance of the tax base on the value added of various sectors of the economy. This theory also supports this study in the sense that if the government focuses on expanding the tax base in sectors that have a positive effect on tax revenue, the tax revenue generated will be substantial.
However, Tax Level Determinant Theory cannot be totally relied on to understand the drivers of tax revenue because it only addresses the value added of sectors of the economy without taking into account the impact of structural transformation in these sectors of the economy. The structure of the economy has altered recently, and some sectors are easy to tax while others are tough to tax (Karagöz, Citation2013). The theory uses only the tax bases of the sectors of the economy to make a point regarding their significance in determining tax revenue. This theory failed to capture the influence of the sector’s growth on tax revenue collection. On this basis, the theory of Modern Economic Growth explains structural changes in sectors of the economy that affect economic growth and tax revenue collection (as supported by Kuznets, Citation1966).
According to the Modern Economic Growth Theory, the service sector is rapidly expanding, which promotes economic growth as well as tax revenue (Kuznets, Citation1966). The seminal work of this theory was originated by Lewis (Citation1954) and Kuznets (Citation1966), who contributed to the discussion of structural transformations that occur during economic development. According to this theory, structural changes in the main sectors of the economy boosted the share of value added in the service and industrial sectors while decreasing it in the agriculture sector. Furthermore, this theory explains the independent variables, which are the growth of service sectors and economic growth. Theoretically, structural transformation encourages economic growth, which in turn boosts tax revenue collection. Recently, Duarte and Restuccia (Citation2010) and Sen (Citation2019) used this theory to create a model that describes the relationship between economic growth and structural transformation in various sectors of the economy. Because the service sector is the fastest-growing sector that leads to economic growth, and the function of economic growth is tax revenue, it is acceptable to suggest that there could be a link between the growth of the service sector and tax revenue. In this regard, the theory supports the study because it demonstrates the impact of changes in the service sector on economic growth, which may also affect tax revenue collection.
Moreover, the existing empirical research in the field of taxation suggests that the overall value added generated by the main sectors of the economy has a substantial impact on the country’s tax revenue collection. Nevertheless, the quantification of economic sectors is conducted by assessing the aggregate value added of each sector in relation to the gross domestic product. Consequently, the present study endeavours to address the existing research gap by conducting a detailed analysis of the service sector, specifically by disaggregating the value contributed by each subsector. Hence, through an analysis of the subsectors within the service industry, this research can offer additional empirical support for modern economic growth theory, tax level determinants theory, and the taxation context. Given Tanzania’s relatively low tax revenue collection compared to the United Nations benchmark, along with its advanced governance norms and regulations, this study is well-suited to examine the current situation.
4. Empirical literature review and hypothesis development
Economic development in the service sector is the only approach to stimulating economic structural change and speeding economic growth (Zhou, Citation2015). It is claimed that a falling share of the agriculture sector in GDP is a critical characteristic of economic progress (Alvarez-Cuadrado & Poschke, Citation2011). Structural transformation frequently correlates with an increase in the service sector of the economy (UNECA, Citation2015). Moreover, economic growth is linked to tax revenue collection (Arvin et al., Citation2021; Gurdal et al., Citation2021; Maganya, Citation2020; McNabb, Citation2018). In contrast, the expanding size of the service sector promotes efficiency in service supply, consequently strengthening the economy (Uwitonze & Heshmati, Citation2016).
According to Park and Shin (Citation2013), industrialization in a country results in an increase in the share of industry and service sectors in GDP as well as a rise in employment, while the agriculture sector declines. On the other hand, when a country reduces its industry activities and enters more into the service phase, the share of services in the country increases while the shares of industry and agriculture sectors decline. According to their findings, when calculating the contributions of agriculture, industry, and service sectors, the contribution of the service sector to economic growth is large overall. As a result, the contribution of the service sector is significant to economic growth, which may have a favourable influence on tax revenue.
Moreover, a dearth of research exists about the impact of service subsectors on tax revenue. The majority of the research investigates the relationship between the total value added of the service sector and tax revenue. According to Bagchi (Citation2004), structural and administrative issues relating to service taxation. The conclusion was that taxation in the service sector must be charged on a broad base of goods and services through the value-added tax (VAT) system of a country. Rath and Rajesh (Citation2006) conducted a study on the tax contribution of service sector growth to the economic growth of India by analysing the economic growth trend and share of service tax in the total tax revenue for the period of 1994/1995 to 2005/2006. They discovered that imposing a service tax in India increased tax revenue.
An investigation by Aim and Lompo (Citation2021) which analysed the effect of financial service sectors on tax revenue collection for developing countries demonstrated that, the expansion of financial service sectors has a considerable and favourable impact on the tax revenue of the country. Similarly, Akram (Citation2016) examined the relationship between market capitalization service and tax revenue. The result was in the long run the market capitalization service has a favourable influence on tax revenue. However, Arodoye and Izevbigie (Citation2019) examined sectoral composition and tax revenue performance in ECOWAS countries for a period of 2000 to 2015. The study found out that, except for indirect taxes, which show a positive but non-significant link, the service sector positively and substantially affect both total taxes and direct taxes. Similarly, Karagöz (Citation2013) found that, when a country have large share of service sector the tax revenue also is high.
Furthermore, a previous study conducted by Aamir (Citation2011) reported that service sectors in most of the developing countries are informal, and as a result, tax revenue collection is low. Findings from the study of Cevik et al. (Citation2019) found VAT efficiency in developed economies is affected by the increased share of the service sector, but VAT efficiency is low in developing economies because of the large number of non-tradable services, which include accommodation and food services, healthcare and social services, public administration, and activities related to security. The unfavourable effect of non-tradable services in most of the developing countries is a result of the tremendous exemption in VAT and in hospitality services, which naturally benefit from low rates of VAT. Therefore, the growth in the share of the service sector creates the VAT gap. Furthermore, high levels of development in the service sector have a positive effect on tax revenue in a country (Rahim & Asma, Citation2019). Hence, in light of the absence of research investigating the relationship between service subsectors and tax revenue, the subsequent hypothesis is posited:
H1a:
Trade service sector positively influence tax revenue in Tanzania
H1b:
Transport service sector positively influence tax revenue in Tanzania
H1c:
Business service sector positively influence tax revenue in Tanzania
H1d:
Government service sector positively influence tax revenue in Tanzania
H1e:
Personal service sector positively influence tax revenue in Tanzania
5. Research design
5.1. Sample of data
The study utilised annual time series data spanning 49 years, specifically from 1970 to 2018, which were obtained from secondary sources. The selection of the time period was based on the accessibility of data pertaining to the variables under investigation. Moreover, the selected timeframe was based on the observation that starting from 1970, numerous developing countries, Tanzania included, experienced sectoral structural changes characterised by a rise in the contribution of the service sector to the gross domestic product (GDP), accompanied by a decline in the agricultural sector’s share (Cevik et al., Citation2019). The time-series research approach was utilised to describe the influence of the service sector on Tanzanian tax revenue. This strategy is appropriate for capturing the variable’s effect in the short and long term. The design can implement changes in the behaviour of series data over time in response to the implementation of several policies (Ary et al., Citation2010). In this regard, the study’s design is crucial since it enables the use of lags (previous information) from a series of data to explain the current condition.
5.2. Measurements of variables and sources of data
Tax revenue, as a dependent variable, is of interest. The Bank of Tanzania (BoT) and World Bank (WB) databases were used to gather tax revenue data. The measurement of tax revenue is tax to GDP, which was adopted from World bank (Citation2020). This study’s explanatory variables included the service sector; specifically, the trade service, transport service, government service, business service, and personal service sectors were evaluated to determine their influence on tax revenue. Explanatory variables were measured by taking the share of value added for each subsector in GDP. Data for explanatory variables was obtained from the Groningen Growth and Development Centre (GGDC) database. The measurement of each subsector was adopted from World bank (Citation2020). Table below shows the variable measurements.
Table 1. Variable measurements
5.3. Model specification
The auto-regressive distributed lag (ARDL) model was used for cointegration analysis in this study to examine the reaction of tax revenue from the service sector. The ARDL model was proposed by Perasan and Shin (Citation1999) and further expounded by Pesaran etal. (Citation2001). It is used to investigate the existence of cointegration relationships among variables (Matlasedi, Citation2017). The ARDL cointegration technique or bound test of cointegration technique has become the solution to determining the long-run relationship between series that are non-stationary, as well as reparameterizing them to the Error Correction Model (ECM). However, when compared to other cointegration procedures like the maximum likelihood-based Johanssen (1988) procedure and the residual-based Engle-Granger (Citation1987) two-step estimation procedures, ARDL is preferred based on the fact that both the long- and short-run parameters of the model specified can be estimated simultaneously (Matlasedi, Citation2017).
Cointegration is a technique that has become more important in econometric analysis of time series data ((Nkoro & Uko, Citation2016; Wegari et al., Citation2023). This is because non-stationarity and previous restrictions on the lag structure of a model are problems that need to be solved. The reason being that cointegration is a powerful way of detecting the presence of steady-state equilibrium between variables. One of the reasons for preferring the ARDL is its applicability, irrespective of whether the underlying regressors are purely or mutually cointegrated. The ARDL approach is applicable irrespective of the order of integration, whether the variables under consideration are purely I(0) (i.e., the variables are stationary at level form), purely I(1) (i.e., the variables become stationary at first difference), or a combination of both. Furthermore, the ARDL model has many advantages over the Johansen (1988) co-integration approach in that it is suitable for both large and small samples (Pesaran etal., Citation2001). Based on the comprehensive examination of theoretical and empirical literature conducted in this study, a set of five variables has been identified as explanatory variables that exert an influence on tax revenue. In the process of identifying the variables, this study utilised the framework established by Cevik et al. (Citation2019) and made modifications to align with the specific objective of the study. In the context of this work, an economic model was constructed and analysed using econometric techniques.
Where:
The study utilised the autoregressive distributed lag (ARDL) model estimate technique, where the dependent variable is represented by both lagged and current values of independent variables, as well as its own lagged value. Therefore, the econometric model in the autoregressive distributed lag (ARDL) form can be represented as
Means first difference, n is the lag order length and
is the error term
Where;
is null hypothesis (no long run relationships)
is alternative hypothesis (long run relationship exist)
are the short run coefficients in ARDL model.
6. Empirical results and discussion
6.1. Descriptive statistics
A descriptive analysis and correlation matrix were used to determine the statistical characteristics of the variables. Table shows the descriptive statistics of the variables used in this study. The mean of 24.533 for the trade and service sector is found to be higher than all other variables. It is also reported that the standard deviation for the business service sector is 15.002, which is high compared to other variables. Table shows a positive association between tax revenue and all explanatory variables, which are trade, transport, government, business, and personal service sectors. Furthermore, if the correlation matrix shows a strong and significant correlation among the independent variables, it justifies the level of a multicollinearity problem (Jaafar & Thornton, Citation2015; Othman et al., Citation2023). Nevertheless, the study deemed a positive value over 0.90 as undesirable due to its implication of substantial collinearity among the variables. The findings shown in Table provide confirmation that no pair of variables exhibits a correlation value equal to or exceeding 0.90. However, the ARDL model offers several advantages over other regression models when it comes to dealing with multicollinearity. Lagged variables are commonly used in ARDL models, which can help mitigate the effects of multicollinearity. Results of descriptive and Pairwise correlation matrix analyses are shown in Tables , respectively.
Table 2. Descriptive statistics
Table 3. Pairwise correlations matrix analysis
6.2. Tests for stationary
It is critical to test for data stationarity in all variables employed to reduce the possibility of spurious results. The stationarity of the data for all variables in this study was tested using the Augmented Dickey-Fuller (ADF) test to see if all variables in both levels and first differences had a unit root. Table results show that, at all levels, all variables were not stationary since their test statistics were greater than their respective critical values at 1% levels of significance. Table further shows that after taking their first differences, all variables are stationary because their test statistics are less than their corresponding critical values at 1% levels of significance. Table indicates that after taking the first differences, further estimations could be performed to eliminate misleading correlations. Thus, Table provides results for the unit root tests for all variables. Furthermore, Figure below shows the trend of each subsector after the first difference.
Figure 1. Trends of service sectors at level after first difference.
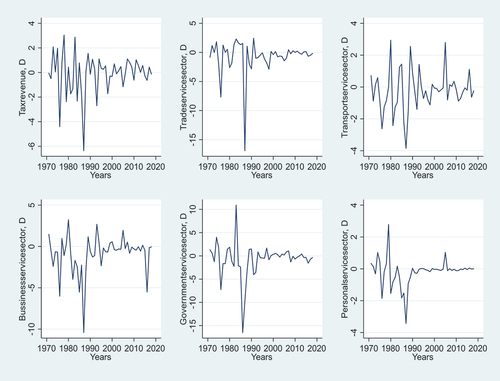
Table 4. Results of augmented Dickey–fuller unit root test
6.3. Autoregressive distributed lag cointegration test
The findings of the ARDL test for cointegration, which is based on the F-statistic, are shown in Table . The null hypothesis (H0), which claims that no co-integration occurs among the variables, directed the co-integration test. The alternative hypothesis (H1) claims that variables are co-integrated. To analyse the long-run relationship of the service sector’s subsectors, the tax revenue variable in the first difference was regressed against its determinants (trade, business, government, transport, and personal service sectors) using the bound test of the ARDL regression model. This enables the F-statistics findings to be produced, allowing a conclusion of co-integration on these variables to be reached. Findings from Table show that the variables under the service sector are not co-integrated based on F statistic values. The short-run relationship is confirmed by the regression result of F-statistic value 1.972, which is less than the critical values at 1%, 5%, and 10%. Results from Table confirm the short-run association only. The bounds test suggests that there is no evidence of cointegration between the variables; hence, there is a short-run relationship.
Table 5. Bounds test for cointegration analysis
6.4. Diagnostic and stability tests on the error correction model
The validity of the findings was tested to check the fitness and stability of the model. In the context of ARDL analysis, a diagnostic test is performed to assess the robustness of the obtained data. The results from several diagnostic and stability tests on the ARDL-ECM model are shown in Table , Figures . According to Table , the results show that the residuals in the model have a normal distribution, as proved by the Jarque-Bera test, indicating that the null hypothesis is accepted. Table results also show that in the model there is no serial correlation, as demonstrated by the Breusch-Godfrey Lagrange Multiplier test. Breusch-Pagan shows that the model is free from heteroskedasticity. The cumulative sum of squares of recursive residuals (CUSUMSQ) and the cumulative sum of recursive residuals (CUSUM) were used to check the model’s stability, as suggested by Brown (Citation1975). The results are indicated in Figures , respectively. The results of the parameter stability/structural break test in Figures demonstrate that the models are stable. Thus, the null hypothesis of no structural break was accepted.
Figure 2. Structural breaks test result.
Figure 3. Structural breaks test result.
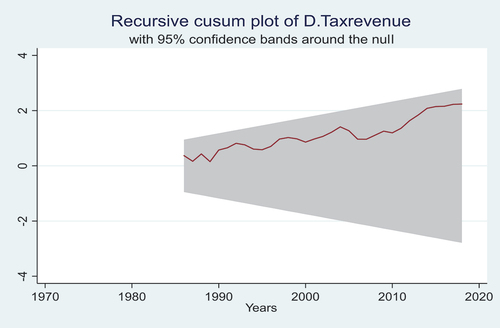
Table 6. Diagnostic testing
6.5. Autoregressive distributed lag regression results
Table summarises the equation estimates from this study, which employed the ARDL to quantify the influence of the service sector on tax revenue collection. The ECM implemented the estimating process in the ARDL model using Stata. In this regard, the model for this study was regressed on its covariates, which comprised explanatory variables from the trade, business, government, transport, and personal service sectors. All these explanatory variables were involved in a differenced form (Δ) under ARDL (2, 3, 1, 0, 1, and 0) with an optimal lag length of 4 based on VAR, which follows the majority to select the maximum number of lags. Thus, the short-run estimates are tabulated in Table .
Table 7. Long run and short run results of service sector and tax revenue
7. Discussions of the findings
According to the ECM estimation results in Table , the regressors have a short-run effect on the dependent variable. The model is stable since it produces a negative value of the ECT of 0.1599, which is statistically significant at the 1% level (p < 0.000) and suggests a quick adjustment process. Table results revealed that ECM has a high degree of fit in terms of R2, or adjusted coefficient R2, and F-statistic. The coefficient of determination (R2 = 0.7785) notifies the variations in the dependent variable (tax revenue) by the combined effect of changes in regressors, which include trade, business, government, transport, and personal service sectors. This denotes the proportion of Tanzanian tax revenue trends explained by these explanatory variables. The model also shows an F-statistic of 53.86, which is statistically significant at the 1% level (p < 0.000). This demonstrates that the variables’ influence on the dependent variable is statistically significant. Generally, these findings conclude that the estimated result as per the tax revenue equation of this study is valid and suitable for discussion.
The null hypothesis stated that there is no positive and significant influence of service sector growth on tax revenue in Tanzania. Based on the results in Table , the null hypothesis is rejected since the results in Table reveal that service sector growth has a substantial positive influence on tax revenue collection in Tanzania throughout the study period, as evidenced by p < 0.000. This could imply that the expansion of the service sector, which increases the aggregate value added to GDP, has a statistically favourable effect on tax revenue collection in Tanzania. This study implies that a positive development in the service sector’s activities will boost Tanzania’s tax revenue performance. This result is consistent with (Cevik et al., Citation2019; Epaphra & Kaaya, Citation2020; Permadi & Wijaya, Citation2022; Sarmento, Citation2016). As a result, the null hypothesis, which claims that service sector expansion has no significant and positive influence on tax revenue, was rejected. From the perspective of theories on modern economic growth and tax level determinants, the findings of this study indicate that the service sector plays a crucial role in enhancing tax revenue in Tanzania. However, upon closer examination of each subsector within the service sector, the following findings were observed.
According to the findings in Table , the government service sector has a positive association with tax revenue. A p-value of 0.017 indicates that the coefficient estimate for the government service sector is 0.167, demonstrating that for every 1% increase in the government service sector, tax revenue increases in the short term. The government service sector involves public administration and defence; compulsory social security; education; human health; and social work activities. Because of their specific location and registration, these activities may have a favourable influence on tax revenue collection. Furthermore, the findings in Table suggest that the expansion of the service sector, which leads to an increase in activity, has a positive impact on Tanzania’s tax collection. As a result of the development of the tax base in the government service sector, tax revenue collection will improve because this sector is easy to tax. The findings of this study are consistent with prior research, which has demonstrated a strong positive correlation between the aggregate value added of the service sector and tax revenue (Aim & Lompo, Citation2021; Rahim & Asma, Citation2019). This finding contradicts the findings of Cevik et al. (Citation2019), who discovered a negative influence of the government service sector on tax revenue collection.
The p < 0.000 in Table results demonstrates that, over the short term, the trade service sector has a positive and significant impact on tax revenue collection in Tanzania at the 1% level. Furthermore, the results show that for every 1% increase in the trade and service industry, tax revenue rises. The trade services sector involves wholesale and retail trade; repair of motor vehicles and motorcycles; accommodation; and food service activities. These services may have a positive influence because they have a fixed location that is straightforward to tax. Because of the rapid growth of the service sector, which leads to an increase in the trade service sector, tax revenue collection would benefit from the trade service sector. This outcome is consistent with the theories underlying this study, which state that as the service sector grows, tax revenue also increases. Furthermore, this finding is consistent with the findings of Cevik et al. (Citation2019), who discovered a positive association between the trade service sector and VAT efficiency, resulting in an increase in tax revenue collection.
Surprisingly, the results revealed that the personal service sector, business service sector, and transport service sector all had insignificant results in the short run. From a theoretical standpoint, these results do not have the predicted sign. According to the modern economic growth theory, an increase in all service sectors due to structural transformation results in an increase in economic growth, which leads to an increase in tax revenue collection. Moreover, in the long run, all service subsectors do not show significant results. Based on the theories of modern economic growth and tax level determinants, the findings of this study indicate that the personal service sector, business service sector, and transport service sector do not yield significant results in terms of enhancing tax revenue over the long term. This suggests that these subsectors may not serve as effective mechanisms for improving tax revenue. This result contradicts the theory underpinning this study because the theory expects positive and significant influence from the service sector as a whole.
8. Summary and conclusion
Tanzania’s tax revenue collection is poor, trailing that of other Sub-Saharan African countries. Despite the fact that mobilising domestic revenue is a top priority as a result of a significant decline in donor support, this article explores the influence of service sector growth on tax revenue collection using the auto-regressive distributed lag (ARDL) model. According to the findings of the study, expansion in the service sector has a positive and considerable influence on tax revenue collection in Tanzania.
The government service sector shows a positive and significant effect on tax revenue collection in the short run only. It means that when the government service sector increases, tax revenue collection in Tanzania also increases. The policy conclusion here is that improving and formalising the government service sector, as well as broadening the tax base in this sector, will result in increased tax revenue collection in the short run. Furthermore, the government must develop tax policies, notably in the government service sector.
In the short run, results for the trade and service sectors show a positive and significant effect on tax revenue collection in Tanzania. Results show that in the short run, an increase in the trade and service sectors will increase tax revenue collection in Tanzania. This implies that if the government formalises the service sector in the short run, it will generate more tax revenue. Therefore, the government should improve its policy for taxing the trade and service sectors so as to increase tax revenue collection. However, policies in the personal service sector, business service sector, and transport service sector should be carefully formulated and implemented because their impact on tax revenue collection is negligible.
The study makes significant contributions to the existing body of literature by offering novel evidence that supports both the tax level determinants theory and the modern economic growth theory. This paper presents empirical evidence indicating a relationship between the expansion of the service industry and its impact on tax collection in the context of Tanzania. Furthermore, this research makes a valuable contribution to the field of professional practise by offering valuable insights into the significance of service subsector growth in the evaluation of tax revenue performance. The available research suggests that the service sector has a substantial role in shaping tax revenue. Consequently, tax authorities and governments may enhance tax collections by focusing their efforts on the service sector. Furthermore, this study contributes to the improvement of tax policy by directing policymakers’ attention towards the individual contributions of service subsectors to the overall tax revenue collection.
While the significance of the evidence presented in this study is noteworthy, it is crucial to recognise and address its inherent limitations. The generalizability of the conclusions from this study to other contexts should be approached with caution, given its specific focus on service subsectors and total tax revenue. In future research, there may be a potential for the disaggregation of tax revenue in order to examine different types of taxes as dependent variables. Furthermore, it is important to note that this particular study exclusively utilised quantitative data. In order to gain a more comprehensive understanding of the variables of interest, it is recommended that future research incorporate mixed methodologies, which may yield different results.
Disclosure statement
No potential conflict of interest was reported by the author(s).
References
- Aamir, M. (2011). Determinants of tax revenue: A comparative study of direct taxes and indirect taxes of Pakistan and India. International Journal of Business & Social Science, 2(19), 173–18.
- Abdu, E., & Adem, M. (2023). Tax compliance behavior of taxpayers in Ethiopia: A review paper. Cogent Economics & Finance, 11(1). https://doi.org/10.1080/23322039.2023.2189559
- Aim, A., & Lompo, B. (2021). How financial sector development improve tax revenue mobilization for developing countries? Études et Documents, CERDI, 24. https://hal.uca.fr/hal-03328502/document
- Akram, N. (2016). Do financial sector activities affect tax revenue in Pakistan? Lahore Journal of Economics, 21(2), 153–169. https://doi.org/10.35536/lje.2016.v21.i2.a6
- Alvarez-Cuadrado, F., & Poschke, M. (2011). Structural change out of agriculture: Labor push versus labor pull. American Economic Journal: Macroeconomics, 3(3), 127–158. https://doi.org/10.1257/mac.3.3.127
- Arodoye, N. L., & Izevbigie, J. N. (2019). Sectoral composition and tax revenue performance in ecowas countries. Oradea Journal of Business and Economics, 4(2), 45–55. https://doi.org/10.47535/1991ojbe077
- Arvin, M., Pradha, R., & Nai, M. (2021). Are there links between institutional quality, government expenditure, tax revenue and economic growth? Evidence from low-income and lower middle-income countries. Economic Analysis & Policy, 70, 468–489. https://doi.org/10.1016/j.eap.2021.03.011
- Ary, D., Jacobs, C. L., & Sorensen, C. (2010). Introduction to research in education (8th ed. ;Ed., D. Hays.). Nelson Education, Ltd.
- Bagchi, A. (2004). Taxing services: The way forward. Economic & Political Weekly, 39(19), 1876–1879. https://www.jstor.org/stable/4414986
- Bank of Tanzania. (2019). Tax statistics report Tanzania mainland. Development, 7(5,371,780,231.09). https://www.bot.go.tz/Publications/Filter/16
- Bank of Tanzania (BoT). (2019). Bank of Tanzania Annual report 2018/19. In Bot. http://www.bot-tz
- Bird, R. M., Martinez-Vazquez, J., & Torgler, B. (2008). Tax effort in developing countries and high income countries: The impact of corruption, Voice and accountability. Economic Analysis & Policy, 38(1), 55–71. https://doi.org/10.1016/S0313-5926(08)50006-3
- Brown, R. L., Durbin, J., & Evans, J. M. (1975). Techniques for testing the Consitancu of the Regression Relationships over Time. Society, 37(No 2), 149–192.
- Cevik, S., Gottschalk, J., Hutton, E., Jaramillo, L., Karnane, P., & Sow, M. (2019). Structural transformation and tax efficiency. International Finance, 22(3), 341–379. https://doi.org/10.1111/infi.12346
- Coulibaly, B. S., & Gandhi, D. (2018). Mobilization of tax revenues in Africa. Africa Growth Initiative, 1–15.
- Duarte, M., & Restuccia, D. (2010). The role of structural transformation in aggregate productivity. Quarterly Journal of Economics, 125(1), 129–173. https://doi.org/10.1162/qjec.2010.125.1.129
- Engle, R. F., & Granger, C. W. J. (1987). Co-intergration and error correction :Representation. Estimation and Testing, 55(2), 251–276.
- Epaphra, M., & Kaaya, L. (2020). Tax revenue effect of sectoral growth and public expenditure in Tanzania: An application of autoregressive distributed lag model. Romanian Economic Business Review, 15(3), 81–120.
- Ghura, D. (1998). Tax revenue in Sub-Saharan Africa: Effects of economic policies and corruption. IMF Working Papers, 98(135), 1. https://doi.org/10.5089/9781451855685.001
- Gupta, S. (2007). Determinants of tax revenue efforts in developing countries; IMF Working Paper 07/184; July 1, 2007.
- Gurdal, T., Aydin, M., & Inal, V. (2021). The relationship between tax revenue, government expenditure, and economic growth in G7 countries: New evidence from time and frequency domain approaches. Economic Change and Restructuring, 54(2), 305–337. https://doi.org/10.1007/s10644-020-09280-x
- Jaafar, A., & Thornton, J. (2015). Tax havens and effective tax rates: An analysis of private versus public European firms. The International Journal of Accounting, 50(4), 435–457. https://doi.org/10.1016/j.intacc.2015.10.005
- Jemiluyi, O. O., & Jeke, L. (2023). Tax revenue mobilization effort in southern African development community (SADC) bloc: Does ICT matter? Cogent Economics & Finance, 11(1). https://doi.org/10.1080/23322039.2023.2172810
- Karagöz, K. (2013). Determinants of tax revenue: Does sectorial composition matter? Journal of Finance, Accounting and Management, 4(3), 50–63.
- Kim, S., & Kim, T. (2018). Tax reform, tax compliance and state-building in Tanzania and Uganda. Africa Development, 43(2), 35–64. https://doi.org/10.4314/ad.v43i2
- Kuznets, S. (1966). Modern economic growth: Rate, structure and spread. In New haven and London (p. 529). Yale University Press.
- Lewis, W. (1954). Economic development with unlimited supplies of labour. The Manchester School, XXL(2), 136–191.
- Lotz and Morss. (1967). Understanding countries’ tax effort. IMF Working Papers, 13(244), 1. https://doi.org/10.5089/9781484301272.001
- Maganya, M. H. (2020). Tax revenue and economic growth in developing country: An autoregressive distribution lags approach. Central European Economic Journal, 7(54), 205–217. https://doi.org/10.2478/ceej-2020-0018
- Mann, C. L. (2004). The US current account, new economy services, and implications for sustainability. Review of International Economics, 12(2), 262–276. https://doi.org/10.1111/j.1467-9396.2004.00448.x
- Matlasedi, T. N. (2017). The influence of the real effective exchange rate and relative prices on South Africa’s import demand function: An ARDL approach. Cogent Economics & Finance, 5(1). https://doi.org/10.1080/23322039.2017.1419778
- Mawejje, J., & Munyambonera, E. F. (2016). Effects of sectoral growth and public expenditure in Uganda. Journal Economics and Bussiness, 12(5), 1456–1489.
- McNabb, K. (2018). Tax structures and economic growth: New evidence from the government revenue dataset. Journal of International Development, 30(2), 173–205. https://doi.org/10.1002/jid.3345
- Mebratu, A., Leykun, A., & Lakehal-Ayat, M. (2020). Determinant of tax revenue effort in Sub-Saharan African Countries: A stochastic frontier analysis. International Journal of Sustainable Development & World Policy, 9(1), 47–71. https://doi.org/10.18488/journal.26.2020.91.47.71
- Nkoro, E., & Uko, A. K. (2016). Autoregressive distributed lag (ARDL) cointegration technique: Application and interpretation. Journal of Statistical and Econometric Methods, 5(4), 63–91.
- Othman, H., Hussainey, K., & Moumen, N. (2023). The influence of cultural tightness–looseness, religiosity, and the institutional environment on tax evasion behaviour: A cross-country study. European Financial Management, 1–29. https://doi.org/10.1111/eufm.12420
- Park, D., & Shin, K. (2013). The service sector in Asia: Is it an engine of growth? SSRN Electronic Journal, 322. https://doi.org/10.2139/ssrn.2198154
- Permadi, D. G., & Wijaya, S. (2022). JPPI (Journal of Indonesian Educational research) analysis of determinants of value added tax revenue in Asia-NC-SA license. JPPI (Jurnal Penelitian Pendidikan Indonesia), 8(3), 622–631. https://doi.org/10.29210/020221385
- Pesaran, M. H. (1999). An Autoregressive Distributed-Lag Modelling Approach to cointegration analysis. Proceedings of the Econometrics and Economic Theory in the 20th Century: The Ragnar Frisch Centennial Symposium. https://doi.org/10.1017/ccol0521633230.011
- Rahim, F. U. R., & Asma, M. (2019). Heterogeneous effects of sectoral growth on tax yields in developing economies. Pakistan Economic and Social Review, 57(2), 199. https://search.proquest.com/scholarly-journals/heterogeneous-effects-sectoral-growth-on-tax/docview/2358375003/se-2?accountid=25704
- Rath, D. P., & Rajesh, R. (2006). Analytics and implications of services sector growth. The Journal of Income and Wealth, 28(1).
- Rwechungura, K. A. (2016). Determinant of tax revenue in Tanzania. Rural Planning Journal, 18(2), 85–96.
- Sarmento, J. (2016). The determinants of value added tax revenues in the European Union. European Journal of Management Studies, 21((2), 79–99. www.european-jms.com
- Sen, K. (2019). Structural transformation around the world: Patterns and drivers. Asian Development Review, 36(2), 1–31. https://doi.org/10.1162/adev_a_00130
- Shingal, A. (2014). The services sector in India’s states: A tale of growth, convergence and trade. The World Economy, 37(12), 1773–1793. https://doi.org/10.1111/twec.12163
- Shrestha, M. B., & Bhatta, G. R. (2018). Selecting appropriate methodological framework for time series data analysis. The Journal of Finance and Data Science, 4(2), 71–89. https://doi.org/10.1016/j.jfds.2017.11.001
- Singh, M., & Kaur, K. (2014). India’s services sector and its determinants: An empirical investigation. Journal of Economics & Development Studies, 2(2), 385–406.
- Thomas, P. M. (2015). Tax contribution of service sector: An empirical study of service taxation in India. 344. https://econpapers.repec.org/RePEc:sch:wpaper:344
- UNECA. (2015). Economic report on Africa 2015: Industrializing through trade (Policy Research Working Paper No. 6712).
- The United Republic of Tanzania. (2004) . Medium term strategic plan 2004 – 2009. Ministry of Finance.
- Uwitonze, E., & Heshmati, A. (2016). Service sector development and its determinants in Rwanda. SSRN Electronic Journal, 10117. https://doi.org/10.2139/ssrn.2822656
- Wahab, A. N. S., Ntim, C. G., Tye, W. L., & Shakil, M. H. (2022). Book-tax differences and risk: Does shareholder activism matter? Journal of International Accounting, Auditing & Taxation, 48(1), 100484. https://doi.org/10.1016/j.intaccaudtax.2022.100484
- Wegari, H. L., Whakeshum, S. T., & Mulatu, N. T. (2023). Human capital and its impact on Ethiopian economic growth: ARDL approach to co-integration. Cogent Economics & Finance, 11(1). https://doi.org/10.1080/23322039.2023.2186046
- World bank. (2020). Achieving sustainable development goal 17? An empirical investigation of the effectiveness of aid given to Boost developing countries’ tax revenue and capacity. International Studies Quarterly, 64(4), 991–1004. https://doi.org/10.1093/isq/sqaa069
- Wu, Y. (2007). Service sector growth in China and India: A comparison. China: An International Journal, 05(1), 137–154. https://doi.org/10.1353/chn.2007.a210876
- Zhou, Z. (2015). The development of service economy: A General trend of the changing economy. Development research center of shangha.