
Abstract
This research aimed to examine and explain the effect of brand image, tourist experience, and destination quality on brand love, Word of Mouth (WOM), recommendation, and revisit intention. The research samples included 284 domestic tourists visiting Bali at least twice in the last 5 years. The research data were then analyzed using a path analysis with SEM-PLS. The research analysis results showed that all relationships had positive and significant effects, except tourist experience on WOM which had positive, but insignificant effect. It meant that tourist experience when traveling to Bali could not produce positive WOM. Brand image, experience, and destination quality are maintained to build high brand love for Bali. These also could generate positive WOM, higher recommendation level, and increase revisit intention of domestic tourists.
PUBLIC INTEREST STATEMENT
The COVID-19 pandemic has hit the whole world, including Indonesia. The impact of the COVID-19 pandemic is very significant on various business sectors, including the tourism sector. Before the pandemic, Bali depended on its economic growth from the agricultural sector, the industrial and MSME sectors, and the tourism sector. Among these sectors which have hit the negative impact of the COVID-19 pandemic is the tourism sector. The tourism sector in Bali has experienced a very drastic decline. The name Bali has been firmly embedded in the minds of tourists worldwide (international tourists) and domestic tourists. When people are asked about the name of Bali, they are effortless to remember. It means that Bali’s brand equity is very high. The information also shows tourists who come to Bali because they love Bali. Brand love in Bali is crucial to reviving the Bali tourism sector when the COVID-19 pandemic ends. The research results can be used as a reference for the government and those involved in tourism in determining policy. The research results can be used to determine an effective strategy to promote tourism in Bali. The results of this study can be used to increase the understanding of those involved in tourism on the importance of brand image, quality, and others in supporting tourism so that visitors can increase and have a welfare effect on society. The destination’s brand image, experience, and quality will be maintained to build high brand love for Bali. It can generate positive WOM and a high recommendation level, and the intention to revisit domestic tourists is also increasing.
1. Introduction
COVID-19 pandemic hit the whole world, including Indonesia. The impact of COVID-19 pandemic is greatly significant on various business sectors, including tourism. Before the pandemic, Bali depended on its economic growth from three sectors: agriculture, industry and MSME, as well as tourism. COVID-19 pandemic negatively impacted tourism sector at the most. Tourism sector in Bali experienced a dramatic decline. All businesses in this sector, such as hotels, travels, and tourist destinations experienced suspended animation (Aristana et al., Citation2022; Rustiarini et al., Citation2023). Previously, tourist destinations in Bali were greatly dependance on its popular brand throughout the world, including in Indonesia.
“Bali” has been firmly attached to both foreign and domestic tourists’ minds. When asked about Bali, people effortlessly remember. It means that Bali’s brand equity is very high. The information also shows that tourists come to Bali because they love Bali. Bali Brand love is crucial to revive Bali tourism sector after COVID-19 pandemic. Several studies on brand love were conducted by previous researchers (Amaro et al., Citation2020; Aro et al., Citation2018; Coelho et al., Citation2019; Ghorbanzadeh & Rahehagh, Citation2021; Moussa, Citation2021; Pontinha & Coelho Do Vale, Citation2020; Wallace et al., Citation2022; Wardana et al., Citation2019). Many variables influenced a destination’s brand love. Some stated that brand love was influenced by a destination’s brand image (Amaro et al., Citation2019; Islam & Rahman, Citation2016; Manyiwa et al., Citation2018). The better a destination’s brand image, the more a destination’s brand love increases. However, some other stated that a destination’s brand image could not make tourists automatically loved a destination’s brand love.
The experience felt by tourists could also affect a destination’s brand love toward a destination’s brand image. Tourists could have unforgettable experiences, different feelings, something new, pleasure, and comfort making tourists fall in love with the destination (Amaro et al., Citation2019; Garg et al., Citation2015; Huang, Citation2017; Junaid et al., Citation2019). A customer’s experience generally affects his or her love for a product or brand (Choi & Burnham, Citation2021; Khan et al., Citation2021; Tran et al., Citation2021). Tourist experiences also encourage tourists to revisit a destination (Zhang et al., Citation2018).
Furthermore, destination quality also determines brand love. Good destination quality makes tourists love a brand (Andriotis et al., Citation2021; Kim & Lee, Citation2020; Swanson, Citation2017; Tosun et al., Citation2015). Brand love is essential because business people in tourism sectors will obtain benefits from the established brand love. Brand love impacts: WOM, recommendation, and revisit intention. High brand love encourages tourists to tell positive stories of a destination (Amaro et al., Citation2020; Aro et al., Citation2018; Bairrada et al., Citation2019; Coelho et al., Citation2019). Coelho et al. (Citation2019) also stated that brand love created positive WOM (Karjaluoto et al., Citation2016; Loureiro et al., Citation2017; Wallace et al., Citation2014).
High brand love also makes tourists recommend a destination to other parties, such as friends, relatives, and communities (Antón et al., Citation2017; Bairrada et al., Citation2018; Coelho et al., Citation2019; Eusébio & Vieira, Citation2013; Wu, Citation2016). Amaro et al. (Citation2020) further supported that brand love could make higher recommendation to other parties. Brand love also encourages visitors to revisit to a destination with a positive impacts on WOM and recommendation to others (Amaro et al., Citation2020). Other researchers (Aro et al., Citation2018; Junaid et al., Citation2020; Kang, Citation2018; Strandberg & Styvén, Citation2020; Swanson, Citation2017) mentioned that brand love encouraged tourists to revisit a destination.
Based on the above backgrounds related to the existing problems, this research aimed to develop a comprehensive model of variables determining “Bali” brand love and its impacts on positive WOM and revisit intention, and recommendation to Bali destinations.
2. Literature review
2.1. Conceptual Model
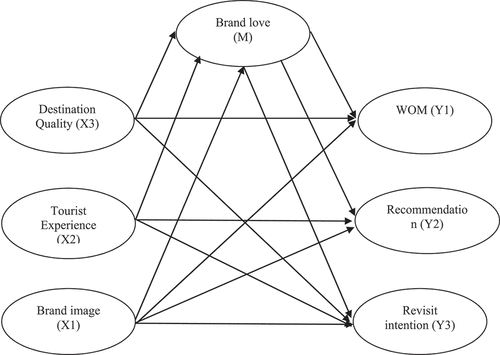
Brand image is a customer’s perception on a brand and a destination’s brand image related to a comprehensive evaluation of a destination possibly giving positive feelings or emotions experienced by tourists (Josiassen et al., Citation2015; Kock et al., Citation2016). A destination brand has an image as a safe, comfortable, attractive destination certainly affecting the tourists’ feelings and hearts causing them satisfied or fall in love with a destination. Besides, tourists can also love a destination due to its perceived good quality and pleasant experiences (Gumparthi & Patra, Citation2020). Brand image, experience, destination quality, and brand love can produce positive impacts, such as telling positive things about a destination (Aro et al., Citation2018; Bilro et al., Citation2019; Junaid et al., Citation2020; Loureiro et al., Citation2017), always recommending to visit the destination for families, friends, and others (Aro et al., Citation2018; Bairrada et al., Citation2018, Citation2019; Foroudi et al., Citation2018; Swanson, Citation2017; Wu, Citation2016), and revisit intention (Aro et al., Citation2018; Swanson, Citation2017). Based on the existing theoretical studies, the conceptual model is shown in Figure .
Figure 1. Conceptual framework.
2.2. Research Hypothesis
H1:
Brand image has a positive and significant effect on brand love.
H2:
Brand image has a positive and significant effect on WOM.
H3:
Brand image has a positive and significant effect on recommendations.
H4:
Brand image has a positive and significant effect on revisit intention.
H5:
Tourist experience has a positive and significant effect on brand love.
H6:
Tourist experience has a positive and significant effect on WOM.
H7:
Tourist experience has a positive and significant effect on recommendations.
H8:
Tourist experience has a positive and significant effect on revisit intention.
H9:
Destination quality has a positive and significant effect on brand love.
H10:
Destination quality has a positive and significant effect on WOM.
H11:
Destination quality has a positive and significant effect on recommendations.
H12:
Destination quality has a positive and significant effect on revisit intention. H13: Brand love has a positive and significant effect on WOM.
H14:
Brand love has a positive and significant effect on recommendations.
H15:
Brand love has a positive and significant effect on revisit intention.
3. Research methods
This research used quantitative primary data. The samples were collected using both purposive and non-probability sampling techniques. Questionnaires were prepared in a Google form format and disrtibuted to many WhatsApp groups; 284 respondents were collected exceeding the targeted sample size of 250 respondents (10 × number of indicators).
This research was classified into a causality study aiming to examine the causal relationship between variables of brand image, tourist experience, destination quality with brand love, WOM, recommendation, and revisit intention. The measurements were conducted using a five-level Likert scale, ranging from strongly disagree (1), disagree (2), somehow agree (3), agree (4), and strongly agree (5). The brand image variable measurement was adopted fromAro et al. (Citation2018) and Amaro et al. (Citation2020); experience variable from (Amaro et al., Citation2019, Citation2020; Junaid et al., Citation2019); destination quality variable from (Swanson, Citation2017; Tosun et al., Citation2015); brand love variable from Amaro et al. (Citation2020); WOM variable from Aro et al. (Citation2018) and Junaid et al. (Citation2019); recommendation variable from Swanson (Citation2017) and Aro et al. (Citation2018); and revisit intention variable from Aro et al. (Citation2018) and Amaro’s et al. (Citation2020) modified to meet Bali destination conditions. This research was conducted on Indonesian people traveling to the island of Bali at least twice in the last 5 years. Questionnaires were distributed to many WhatApp groups using google forms, and some directly met the respondents during their visit to Bali. The collected data of 30 respondents were tested for validity and reliability, and the results are presented in Table showing that all variables were valid with the correlation value of above 0.30 and reliable with the Cronbach’s Alpha value of above 0.6.
Table 1. Instrument validity and Reliability test results
All research hypotheses were tested using SEM-PLS analysis with Smart PLS. PLS is a component- or variant-based Structural Equation Modeling (SEM). This study uses Structural Equation Modeling (SEM) with a variance- or component-based approach with Partial Least Square (PLS) to test the hypothesis and produce a feasible model.
4. Research results and discussion
4.1. Respondents’ characteristics
The profiles of 284 respondents were generally presented in several characteristics, such as gender, age, education level, occupation, and monthly income. The respondents’ characteristics in this research were described as follows. There were more female than male respondents (139 female and 106 male respondents). The 18–28 age group respondents (166 respondents) dominated the questionnaires. Respondents graduated from high/vocational schools or equivalent education level (146 respondents) dominated the questionnaires. The average respondents had other professions (160 respondents), such as retirees, students, and employees of State-Owned Enterprises (SOEs). Based on the monthly income, 173 respondents earned 2–5 million rupiahs. The respondents’ characteristics are presented in Table .
Table 2. Respondents’ characteristics
4.2. PLS-SEM analysis results
This research used a two-stage approach to measure the model before hypothesis testing to verify the validity and reliability of a research model, first by analyzing convergent validity, and then by analyzing discriminant validity.
4.3. Outer model test
4.3.1. Convergent validity
Outer model test was conducted to ensure that research indicators were appropriately used to measure the research variables whether or not a model is valid as the research basis in meeting three criteria: (1) all loading indicators must be more than 0.65 (2) Composite Reliability (CR) must be more than 0.8, and (3) Average Variance Extracted (AVE) for each construct must be more than 0.5.
Table shows that all outer loading indicators had the values of above 0.65 ranging from 0.695 to 0.949 (within recommendation limit). The Composite Reliability (CR) values ranged from 0.877 to 0.955 (above 0.8), meaning that all formed constructs have a good consistency as a research model. The Average Variance Extracted (AVE) values, valued ranged from 0.643 to 0.877 (above 0.5). Thus, it was concluded that this research model had good validity.
Table 3. Model size results
4.4. Discriminant validity
To evaluate discriminant validity, a research model was suggested to ensure that the root value of a latent variable’s Average Variance Extracted (√AVE) must be more significant.
Discriminant validity is considered good if AVE root value (√AVE) in Table is more significant than 0.5. The research model proposed in this study was considered good with the smallest AVE value of 0.802. Table also shows the correlation between variables in this study.
Table 5. Square root of Average Variance Extracted (AVE)
Table 4. Correlation between latent Variables
4.5. Inner model test
Structural models focused on the hypothesized relationships or paths between latent variables. The results of inner model test can be seen in Figure . The structural model was evaluated using R-square for the dependent construct and t-test as well as the significance of coefficients of structural path parameters.
Figure 2. Structural model.
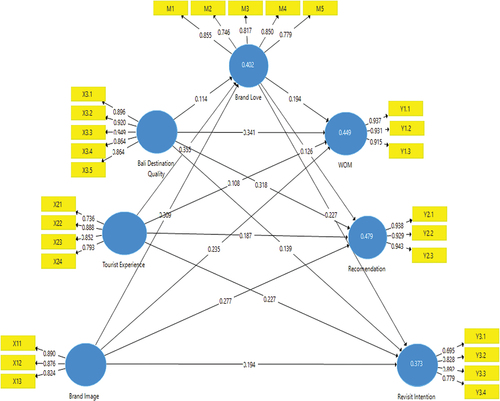
4.6. Coefficient of Determination (R2)
In this study, bootstrap was conducted to produce two measurements of structural model: t (t-test) and R2 values generally interpreted the same as multiple regression analysis. The predictive power of a research model can be seen by looking at the R2 values generated through bootstrapping processes as shown in Table . The R2 value for each exogenous variable contained in the model were presented.
Table 6. Coefficient of determination
Based on Table , the highest R2 value (0.479) was found in recommendation variable, meaning that 47.90% of recommendation variable was explained by constructs contained in the model: brand image, tourist experience, destination quality, and brand love. In contrast, revisit intention variable had 0.373, meaning that 37.30 % of revisit intention variable was explained by the constructs influencing those variables (brand image, tourist experience, destination quality, and brand love). From the examination of R2 value, the predictive ability of this research model was considered sufficient or moderate.
4.7. Hypothesis testing
The significance of the estimated parameters provided beneficial information related to the relationship between research variables. The values contained in the output path coefficients were presented in Table .
Table 7. Path coefficient
Hypothesis testing was conducted by using t-statistics and p-value. If the p-value is < 0.05, the hypothesis is accepted. Table showed that brand image of brand love had the t-statistic value of 5.941 with the p-value of 0.000 < 0.05, so that the hypothesis was accepted. It means that the better the brand image, the higher the brand love in Bali. The brand image of WOM had the t-statistic value of 3.744 with the p-value of 0.000 < 0.05, so that the hypothesis was accepted. The better the brand image, the higher the positive WOM. The brand image test results had the t-statistic value of 4.714 with the p-value of 0.000 < 0.05. Thus, the hypothesis was accepted. The better the brand image, the higher the recommendation. Furthermore, the brand image also affected revisit intention with the t-statistic value of 2.714 with the p-value of 0.007 < 0.05. Therefore, the hypothesis was accepted. Thus, the brand image increased revisit intention. Furthermore, experience affected brand love with the t-statistic value of 5780 with the p-value of 0.000 < 0.05. Thus, the hypothesis was accepted. The better the tourist experience, the higher the brand love for Bali. Experience with WOM had the t-statistic value of 1.741 and the p-value of 0.082 > 0.05. Thus, the hypothesis was rejected. It means that experience cannot positively increase WOM. The results of experience with recommendation had the t-statistic value of 3.386 and p-value of 0.001 < 0.05. Thus, the hypothesis was accepted, meaning that experience could increase tourist recommendation. Experience affected revisit intention with the t-statistic value of 3.009 and p-value of 0.003 < 0.05, meaning that experience had a positive and significant effect on revisit intention. Destination quality affected brand love with the t-statistic value of 1.972 and p-value of 0.049 < 0.05, meaning that destination quality positively and significantly affected brand love. Destination quality affected WOM with the t-statistic value of 5.756 and p-value of 0.000 < 0.05. Thus, destination quality had a positive and significant effect on WOM. Destination quality affected recommendation with the t-statistic value of 5.725 and p-value of 0.000 < 0.05. Thus, destination quality had a positive and significant effect on recommendation. destination quality affected revisit intention with the t-statistic value of 2.154 and p-value of 0.032 < 0.05. Destination quality had a positive and significant effect on revisit intention. Likewise, brand love affected WOM with the t-statistic value of 3.091 and p-value of 0.002 < 0.05. Thus, brand love had a positive and significant effect on WOM. Brand love affected recommendation with the t-statistic value of 2.011 and p-value of 0.045. Thus, brand love had a positive and significant effect on recommendation. Brand love affected revisit intention with the t-statistic value of 3.108 and p-value of 0.002 < 0.05. Thus, brand love had a positive and significant effect on revisit intention.
5. Discussion
5.1. The effect of brand image on brand love
Based on the analysis on the effect of brand image on brand love, the beta coefficient value was 0.309 with the significance level of 0.000 < 0.05, meaning that H1 was accepted. These results showed that brand image positively and significantly affected brand love. Thus, the better the brand image, such as beautiful, safe, and comfortable destination, the better the brand love for Bali. The research results also strengthened the previous research conducted by (Islam & Rahman, Citation2016; Widyani et al., Citation2022), stating that brand image had an important role to increase brand love. Similar results were also previously shown by (Manyiwa et al., Citation2018), explaining that a good brand image could build brand love. The research results also strengthened those of research conducted by Amaro et al. (Citation2020), finding that brand image positively and significantly affected brand love. Thus, It was concluded that brand image positively and significantly affected brand love. The better the brand image, the better the brand love for Bali.
5.2. The effect of brand image on WOM
Based on the analysis on the effect of brand image on WOM, the beta coefficient value was 0.235 with the significance level of 0.000 < 0.05, meaning that H2 was accepted. These results showed that brand image positively and significantly affected WOM. The better the Bali brand image, such as beautiful, safe, and comfortable destination, could positively increase WOM. The results strengthened the previous studies conducted by (Amaro et al., Citation2020; Aro et al., Citation2018; Bairrada et al., Citation2018, Citation2019) mentioning that brand image had an essential role to positively increase Bali’s WOM. Similar results were also previously obtained by Junaid et al. (Citation2019) stating that a good brand image encouraged people to tell positive things about a product. The results also strengthened that brand image positively and significantly affected WOM. Brand image had a positive and significant effect on WOM. Therefore, the better the Bali brand image, the more positive Bali’s WOM.
5.3. The effect of brand image on recommendation
Based on the analysis on the effect of brand image on recommendation, the beta coefficient value was 0.277 with a significance level of 0.000 < 0.05, meaning that H3 was accepted. These results showed that brand image positively and significantly affected recommendation. The better the brand image, such as beautiful, safe, and comfortable destination, the better the tourists give recommendation to others to visit Bali. The research results also supported those of previous research conducted by (Wu, Citation2016), stating that brand image dramatically determined recommendation level on a product. Similar results were also previously obtained by (Antón et al., Citation2017), mentioning that a good brand image encouraged people to give recommendation to others to buy a product. This research also strengthened the results of research conducted by Aro et al. (Citation2018) stating that brand image positively and significantly affected recommendation. brand image had a positive and significant effect on recommendation. The better the brand image, the higher the recommendation level to revisit Bali.
5.4. The effect of brand image on revisit intention
Based on the analysis on the effect of brand image on revisit intention, the beta coefficient value was 0.194 with the significance level of 0.007 < 0.05, meaning that H4 was accepted. These results showed that brand image positively and significantly affected revisit intention. The better the brand image, such as beautiful, safe, and comfortable destination, the better the intention to revisit Bali. The research results strengthened the previous results mentioning that brand image had an essential role to increase revisit intention. Brand image positively and significantly influenced revisit intention (Aro et al., Citation2018; Hasan et al., Citation2018, Citation2020; Ragab et al., Citation2020). Thus, it was concluded that brand image positively and significantly affected revisit intention. The better the brand image, the better the intention to revisit Bali.
5.5. The effect of tourist experience on brand love
Based on the analysis on the effect of tourist experience on brand love, the beta coefficient value was 0.355 with the significance level of 0.000 < 0.05, meaning that H5 was accepted. These results showed the tourist experience positively and significantly affected brand love. The more positive tourist experience, indicated by gaining new, meaningful, and fun experiences as well as valuable knowledge, the better the brand love for Bali (Aristana et al., Citation2022). The research results strengthened those of previous research conducted by Huang (Citation2017) stating that tourist experience affected brand love. the other previous researchers examined that experience increased brand love (Ali et al., Citation2014) and experience had a positive and significant effect on brand love (Zhang et al., Citation2018). These results also proved that experience positively and significantly affected brand love (Amaro et al., Citation2020).
5.6. The effect of tourist experience on WOM
Based on the analysis on the effect of experience on WOM, the beta coefficient value was 0.108 with the significance level of 0.082 > 0.05, meaning that H6 was rejected. These results showed that experience had a positive and insignificant effect on WOM. The more positive the tourist experience, indicated by new, enjoyable, meaningful, and pleasant experiences, as well as increasing knowledge (Arsawan et al., Citation2022), the more the WOM cannot positively increase. This result contradicted that of research conducted by (Amaro et al., Citation2019), mentioning that experience had a positive and significant effect on WOM. experience could not positively increase WOM because tourists with a good vacation experience in Bali were those did not openly communicate to the market. Thus, positive WOM could not be widely and only heard by the surroundings.
5.7. The effect of tourist experience on recommendation
Based on the analysis on the effect of experience on recommendation, the beta coefficient value was 0.187 with the significance level of 0.001 < 0.05, meaning that H7 was accepted. These results showed that experience positively and significantly affected recommendation. The more positive the tourist experience, shown by obtaining new, meaningful, and fun experiences, as well as valuable knowledge. Thus, tourist recommendation to others increased Bali as a place to travel. The research results proved that customer experience could increase recommendation (Foroudi et al., Citation2018). Previously, Swanson (Citation2017) examined that positive or good experience could increase recommendation to a product and positively affect recommendation (Barrainkua & Espinosa-Pike, Citation2018). These results also strengthened the results of research conducted by (Amaro et al., Citation2020), finding that experience had a positive and significant effect on recommendation.
5.8. The effect of tourist experience on revisit intention
Based on the analysis on the effect of tourist experience on revisit intention, the beta coefficient value was 0.227 with a significance level of 0.003 < 0.05, meaning that H8 was accepted. These results showed that tourist experience positively and significantly affected revisit intention. The more positive the tourist experience, such as obtaining new, meaningful, and fun experience as well as valuable knowledge to increase tourists’ revisit intention. The results strengthen the previous research conducted by Swanson (Citation2017) related to the effect of experience which increased revisit intention. The other researchers previously examined experience which could increase revisit intention and found that experience had a positive effect on repurchase (Aro et al., Citation2018) and revisit intention (Amaro et al., Citation2020).
5.9. The effect of destination quality on brand love
Based on the analysis on the effect of destination quality on brand love, the beta coefficient value was 0.114 with the significance level of 0.049 < 0.05, meaning that H9 was accepted. These results showed that destination quality had a positive and significant effect on brand love. The better the destination quality in Bali, such as clean hotels, various tourist attractions, people friendliness, complete facilities, and clean restaurants, the better the brand love for Bali. The research results strengthened previous research conducted by (Çelik & Dedeoğlu, Citation2019) regarding the effect of destination quality to increase brand love. Other studies stated that the perception of destination quality could increase brand love on a product (Corte et al., Citation2015). Destination quality, such as good infrastructure, had a positive and significant effect on brand love (Huang et al., Citation2015). These results were also strengthened by those of research conducted by (Anjos et al., Citation2017), finding that product quality had a positive and significant effect on brand love.
5.10. The effect of destination quality on WOM
Based on the analysis on the effect of destination quality on WOM, the beta coefficient value was 0.341 with the significance level of 0.000 < 0.05, meaning that H10 was accepted. These results showed that destination quality had a positive and significant effect on WOM. The better the destination quality in Bali, such as clean hotels, various tourist attractions, people friendliness, complete facilities, and clean restaurants, the better Bali’s positive WOM. The research results strengthened those of previous research conducted by (Wang et al., Citation2017) regarding the effect of product quality to increase positive WOM. Previously, the other researchers examined product quality which made WOM more positive (Brady et al., Citation2005) and found that product quality had a positive effect on WOM (Sun et al., Citation2013). These results were also reinforced by the research mentioning that product quality had a positive and significant effect on WOM (Battour et al., Citation2020).
5.11. The effect of destination quality on recommendation
Based on the analysis on the effect of destination quality on recommendation, the beta coefficient value was 0.318 with the significance level of 0.000 < 0.05, meaning that H11 was accepted. These results showed that destination quality had a positive and significant effect on recommendation. The better the destination quality in Bali, such as clean hotels, various tourist attractions, people friendliness, complete facilities, and clean restaurants, the higher people’s recommendation to visit Bali. The research results strengthened those of research regarding the effect of product quality to improve recommendation (Hakimian et al., Citation2016). Other researchers examined the quality of destinations which could increase the level of recommendation (Bairrada et al., Citation2018, Citation2019; Coelho et al., Citation2019). Other studies found that destination quality positively and significantly affected recommendation (Amaro et al., Citation2020; Antón et al., Citation2017).
5.12. The effect of destination quality on revisit intention
Based on the analysis on the effect of destination quality on revisit intention, the beta coefficient value was 0.139 with the significance level of 0.032 < 0.05, meaning that H12 was accepted. These results showed that destination quality had a positive and significant effect on revisit intention. The better the destination quality in Bali, such as clean hotels, various tourist attractions, people friendliness, complete facilities, and clean restaurants, the greater the revisit intention to Bali. The research results strengthened those of previous research conducted by (Allameh et al., Citation2015; Le Chi, Citation2016; Tosun et al., Citation2015) regarding the effect of destination quality to increase revisit intention. Other researchers (Bonn et al., Citation2016; Mohaidin et al., Citation2017; Sangpikul, Citation2017) examined product attributes which could increase repurchase intention, including product quality (Bonn et al., Citation2016; Mohaidin et al., Citation2017; Sangpikul, Citation2017). Shahijan et al. (Citation2018) found that product quality positively and significantly affected behavioral intention. These results also strengthened the previous research mentioning that product quality positively and significantly affected behavioral intentions (Amaro et al., Citation2020).
5.13. The effect of brand love on WOM
Based on the analysis on the effect of brand love on WOM, the beta coefficient value was 0.194 with the significance level of 0.002 < 0.05, meaning that H13 was accepted. These results showed that brand love had a positive and significant effect on WOM. The higher the brand love for Bali, such as feeling very close to Bali, always remembering Bali, always missing Bali, and falling in love with Bali, the better the positive WOM. The results supported the previous research conducted by (Aro et al., Citation2018; Strandberg & Styvén, Citation2020) that brand love positively and significantly affected WOM. Thus, brand love had a positive and significant influence on WOM, meaning that the higher the brand love, the higher the brand love increased positive WOM.
5.14. The effect of brand love on recommendation
Based on the analysis on the effect of brand love on recommendation, the beta coefficient value was 0.126 with the significance level of 0.045 < 0.05, meaning that H14 was accepted. These results showed that Bali brand love positively and significantly affected recommendation. Thus, tourists recommended people to revisit Bali. The higher Bali brand love, indicated by feeling very close to Bali, always remembering Bali, always missing Bali, and falling in love with Bali, could increase the recommendation to revisit Bali. The research results at the same time strengthened the previous results (Amaro et al., Citation2019, Citation2020; Bairrada et al., Citation2018, Citation2019; Coelho et al., Citation2019) regarding the role of brand love to increase recommendation.
5.15. The effect of brand love on revisit intention
Based on the analysis on the effect of brand love on revisit intention, the beta coefficient value was 0.227 with the significance level of 0.002 < 0.05, meaning that H15 was accepted. These results showed that brand love positively and significantly affected revisit intention. The higher the brand love, indicated by feeling very close to Bali, always remembering Bali, always missing Bali, and falling in love with Bali, could increase intention to revisit Bali. The research results were in accordance with the previous research conducted by (Swanson, Citation2017) on brand love to increase behavioral intention. Furthermore, the research conducted by Aro et al. (Citation2018), on the effect of brand love on behavioral intention, also found the same results in which brand love had a positive and significant effect on behavioral intentions. In addition, several researchers still showed consistent results (Batra et al., Citation2012; Junaid et al., Citation2020; Wardana et al., Citation2020). Therefore, brand love had a positive and significant influence on behavioral intention, meaning that the higher the brand love, the better the revisit intention.
6. Conclusions, implications, and limitations
The research results concluded that brand love in Bali increased destination brand by building a good brand image and positive tourist experience as well as improving destination quality in Bali. Likewise, better brand image, experience, and destination quality positively increased WOM, higher recommendation level, and revisit intention to Bali. In addition, Bali brand love had an important role in building outcomes, such as WOM, recommendations, and increased revisit intention. This research possibly integrated more variables in building a a destination’s brand love model. Likewise, government and business managers in tourism sectors in Bali should pay more attention to brand image, experience, and destination quality in building brand love, WOM, recommendation, and high revisit intention, so that Bali tourism sector can grow and develop well after this COVID-19 pandemic.
This research was only conducted on domestic tourists, which turned out dominated by millennial generations. Therefore, the research results could not be generalized to other generations. In addition, the data were cross-sectionally taken, so that environmental changes occurred and required future longitudinal research. Likewise, the exogenous variable only considered three variables. Thus, other variables, such as tourist satisfaction, tourist involvement, tourist knowledge, and relevant perceived value as antecedents of brand love can be further added in the future.
This research could integrate more variables in building a destination’s brand love model. In facts, this research was only conducted on domestic tourists, which turned out dominated by millennial generations, so that the results of this research could not be generalized to other generations. In addition, the data were taken as using a cross-sectional sampling technique, so that environmental changes occurred all the time. Thus, longitudinal research is required in future research.
The implication of these research results can be used as a reference for government and those involved in tourism to determine policies. The research results also can be used to determine effective strategies to promote tourism in Bali. The research results can further be used to increase understanding on the importance of brand image, quality, and others to support tourism, so that visitors can increase in number and improve the welfare of the society. The research limitations were related to the use of only some variables and in specific periods. Further research can more relevantly add other variables and lengthen the periods.
Disclosure statement
No potential conflict of interest was reported by the authors.
Additional information
Notes on contributors

I Putu Gde Sukaatmadja
I Putu Gde Sukaatmadja, SE, MP is the Head Lector of Management at the Faculty of Economics and Business, University of Udayana, Teaching also at the Masters and Doctoral Study Program of the Faculty of Tourism, Udayana University - Denpasar (2001 - present), Master of Management Study Program in Hospitality Concentration at Trisakati University - Jakarta (2004 - present), Master of Management Study Program at Warmadewa University - Denpasar (2010 - now), and the Master of Management Study Program (Programa do Mestrado) Institute of Business - Timor Leste (2008-present) and as the Team of the Learning and Quality Assurance Development Unit (UP3M) at the Faculty of Economics and Business, Udayana University (2020 until now). He is consistently conducting research on spiritual tourism as sustainable tourism which is now being added on a virtual basis in the recent new normal era.
References
- Ali, F., Hussain, K., & Ragavan, N. A. (2014). Memorable customer experience: Examining the effects of customers experience on memories and loyalty in Malaysian resort hotels. Procedia - Social & Behavioral Sciences, 144, 273–18. https://doi.org/10.1016/j.sbspro.2014.07.296
- Allameh, S. M., Khazaei Pool, J., Jaberi, A., Salehzadeh, R., & Asadi, H. (2015). Factors influencing sport tourists’ revisit intentions. Asia Pacific Journal of Marketing & Logistics, 27(2), 191–207. https://doi.org/10.1108/APJML-12-2013-0159
- Amaro, S., Barroco, C., & Antunes, J. (2020). Exploring the antecedents and outcomes of destination brand love. Journal of Product & Brand Management, 30(3), 433–448. https://doi.org/10.1108/JPBM-08-2019-2487
- Amaro, S., Barroco, C., Martins, C., & Antunes, J. (2019). Erasmus students in Portugal: From students to tourists and advocates. European Journal of Tourism Research, 22, 94–106. https://doi.org/10.54055/ejtr.v22i.377
- Andriotis, K., Foroudi, P., & Marvi, R. (2021). Heritage destination love. Qualitative Market Research: An International Journal, 24(2), 240–259. https://doi.org/10.1108/QMR-03-2020-0038
- Anjos, S. J. G. D., Meira, J. V. D. S., Pereira, M. D. L., & Limberger, P. F. (2017). Quality attributes of Jericoacoara, Brazil. International Journal of Tourism Cities, 3(2), 196–204. https://doi.org/10.1108/IJTC-09-2016-0027
- Antón, C., Camarero, C., & Laguna-García, M. (2017). Towards a new approach of destination loyalty drivers: Satisfaction, visit intensity and tourist motivations. Current Issues in Tourism, 20(3), 238–260. https://doi.org/10.1080/13683500.2014.936834
- Aristana, I. N., Arsawan, I. W. E., & Rustiarini, N. W. (2022). Employee loyalty during slowdown of covid-19: Do satisfaction and trust matter? International Journal of Tourism Cities, 8(1), 223–243. https://doi.org/10.1108/IJTC-03-2021-0036
- Aro, K., Suomi, K., & Saraniemi, S. (2018). Antecedents and consequences of destination brand love — a case study from Finnish lapland. Tourism Management, 67(8), 71–81. https://doi.org/10.1016/j.tourman.2018.01.003
- Arsawan, I. W. E., Kariati, N. M., Shchokina, Y., Prayustika, P. A., Rustiarini, N. W., & Koval, V. (2022). Invigorating employee’s innovative work behavior: Exploring the sequential mediating role of organizational commitment and knowledge sharing. Business: Theory and Practice, 23(1), 117–130. https://doi.org/10.3846/btp.2022.15684
- Bairrada, C. M., Coelho, F., & Coelho, A. (2018). Antecedents and outcomes of brand love: Utilitarian and symbolic brand qualities. European Journal of Marketing, 52(3/4), 656–682. https://doi.org/10.1108/EJM-02-2016-0081
- Bairrada, C. M., Coelho, A., & Lizanets, V. (2019). The impact of brand personality on consumer behavior: The role of brand love. Journal of Fashion Marketing and Management: An International Journal, 23(1), 30–47. https://doi.org/10.1108/JFMM-07-2018-0091
- Barrainkua, I., & Espinosa-Pike, M. (2018). The influence of auditors’ professionalism on ethical judgement: Differences among practitioners and postgraduate students. Revista de contabilidad, 21(2), 176–187. https://doi.org/10.1016/j.rcsar.2017.07.001
- Batra, R., Ahuvia, A., & Bagozzi, R. P. (2012). Brand love. Journal of Marketing, 76(2), 1–16. https://doi.org/10.1509/jm.09.0339
- Battour, M., Rahman, M. K., & Rana, M. S. (2020). The impact of PHTPS on trip quality, trip value, satisfaction and word of mouth. Journal of Islamic Marketing, 11(6), 1517–1538. https://doi.org/10.1108/JIMA-03-2019-0058
- Bilro, R. G., Loureiro, S. M. C., & Guerreiro, J. (2019). Exploring online customer engagement with hospitality products and its relationship with involvement, emotional states, experience and brand advocacy. Journal of Hospitality Marketing & Management, 28(2), 147–171. https://doi.org/10.1080/19368623.2018.1506375
- Bonn, M. A., Cho, M., Lee, J. J., & Kim, J. H. (2016). A multilevel analysis of the effects of wine destination attributes on travel constraints and revisit intention. International Journal of Contemporary Hospitality Management, 28(11), 2399–2421. https://doi.org/10.1108/IJCHM-01-2015-0010
- Brady, M. K., Knight, G. A., Cronin, J. J., Tomas, G., Hult, M., & Keillor, B. D. (2005). Removing the contextual lens: A multinational, multi-setting comparison of service evaluation models. Journal of Retailing, 81(3), 215–230. https://doi.org/10.1016/j.jretai.2005.07.005
- Çelik, S., & Dedeoğlu, B. B. (2019). Psychological factors affecting the behavioral intention of the tourist visiting Southeastern Anatolia. Journal of Hospitality and Tourism Insights, 2(4), 425–450. https://doi.org/10.1108/JHTI-01-2019-0005
- Choi, L., & Burnham, T. (2021). Brand reputation and customer voluntary sharing behavior: The intervening roles of self-expressive brand perceptions and status seeking. Journal of Product & Brand Management, 30(4), 565–578. https://doi.org/10.1108/JPBM-12-2019-2670
- Coelho, A., Bairrada, C., & Peres, F. (2019). Brand communities’ relational outcomes, through brand love. Journal of Product & Brand Management, 28(2), 154–165. https://doi.org/10.1108/JPBM-09-2017-1593
- Corte, V. D., Sciarelli, M., Cascella, C., & Gaudio, G. D. (2015). Customer satisfaction in tourist destination: The case of tourism offer in the city of Naples. Journal of Investment and Management, 4(1–1), 39–50. https://doi.org/10.11648/j.jim.s.2015040101.16
- Eusébio, C., & Vieira, A. L. (2013). Destination attributes’ evaluation, satisfaction, and behavioural intentions: A structural modelling approach. International Journal of Tourism Research, 15(1), 66–80. https://doi.org/10.1002/jtr.877
- Foroudi, P., Akarsu, T. N., Ageeva, E., Foroudi, M. M., Dennis, C., & Melewar, T. C. (2018). Promising the dream: Changing destination image of London through the effect of website place. Journal of Business Research, 83(2), 97–110. https://doi.org/10.1016/j.jbusres.2017.10.003
- Garg, R., Mukherjee, J., Biswas, S., Kataria, A., Melewar, T. C., Nguyen, B., & Bill Merrilees, P. (2015). An investigation of antecedents and consequences of brand love in India. Asia-Pacific Journal of Business Administration, 7(3), 174–196. https://doi.org/10.1108/APJBA-09-2014-0112
- Ghorbanzadeh, D., & Rahehagh, A. (2021). Emotional brand attachment and brand love: The emotional bridges in the process of transition from satisfaction to loyalty. Rajagiri Management Journal, 15(1), 16–38. https://doi.org/10.1108/RAMJ-05-2020-0024
- Gumparthi, V. P., & Patra, S. (2020). The phenomenon of brand love: A systematic literature review. Journal of Relationship Marketing, 19(2), 93–132. https://doi.org/10.1080/15332667.2019.1664871
- Hakimian, F., Farid, H., Ismail, M. N., & Nair, P. K. (2016). Importance of commitment in encouraging employees’ innovative behaviour. Asia-Pacific Journal of Business Administration, 8(1), 70–83. https://doi.org/10.1108/APJBA-06-2015-0054
- Hasan, M. K., Abdullah, S. K., Lew, T. Y., & Islam, M. D. F. (2020). Determining factors of tourists’ loyalty to beach tourism destinations: A structural model. Asia Pacific Journal of Marketing & Logistics, 32(1), 169–187. https://doi.org/10.1108/APJML-08-2018-0334
- Hasan, M. K., Abdullah, S. K., Lew, T. Y., & Islam, M. F. (2018). The antecedents of tourist attitudes to revisit and revisit intentions for coastal tourism. International Journal of Culture, Tourism and Hospitality Research, 13(2), 218–234. https://doi.org/10.1108/IJCTHR-11-2018-0151
- Huang, C.-C. (2017). The impacts of brand experiences on brand loyalty: Mediators of brand love and trust. Management Decision, 55(5), 915–934. https://doi.org/10.1108/MD-10-2015-0465
- Huang, H., Lunhua Mao, L., Wang, J., & Zhang, J. J. (2015). Assessing the relationships between image congruence, tourist satisfaction and intention to revisit in marathon tourism: The Shanghai International Marathon. International Journal of Sports Marketing and Sponsorship, 16(4), 46–66. https://doi.org/10.1108/IJSMS-16-04-2015-B005
- Islam, J. U., & Rahman, Z. (2016). Examining the effects of brand love and brand image on customer engagement: An empirical study of fashion apparel brands. Journal of Global Fashion Marketing, 7(1), 45–59. https://doi.org/10.1080/20932685.2015.1110041
- Josiassen, A., Assaf, A. G., Woo, L., & Kock, F. (2015). The imagery-image duality model: An integrative review and advocating for improved delimitation of concepts. Journal of Travel Research, 55(6), 789–803. https://doi.org/10.1177/0047287515583358
- Junaid, M., Hou, F., Hussain, K., & Kirmani, A. A. (2019). Brand love: The emotional bridge between experience and engagement, generation-M perspective. Journal of Product & Brand Management, 28(2), 200–215. https://doi.org/10.1108/JPBM-04-2018-1852
- Junaid, M., Hussain, K., Basit, A., & Hou, F. (2020). Nature of brand love: Examining its variable effect on engagement and well-being. Journal of Brand Management, 27(3), 284–299. https://doi.org/10.1057/s41262-019-00179-1
- Kang, J. (2018). Finding desirable post-consumption behaviors. International Journal of Contemporary Hospitality Management, 30(9), 2984–3003. https://doi.org/10.1108/IJCHM-07-2017-0410
- Karjaluoto, H., Munnukka, J., & Kiuru, K. (2016). Brand love and positive word of mouth: The moderating effects of experience and price. Journal of Product & Brand Management, 25(6), 527–537. https://doi.org/10.1108/JPBM-03-2015-0834
- Khan, I. S., Ahmad, M. O., & Majava, J. (2021). Industry 4.0 and sustainable development: A systematic mapping of triple bottom line, circular economy and sustainable business models perspectives. Journal of Cleaner Production, 297, 126655. https://doi.org/10.1016/j.jclepro.2021.126655
- Kim, S.-H., & Lee, S. A. (2020). The role of marketing communication mix on Korean customers’ coffee shop brand evaluations. Journal of Hospitality and Tourism Insights, 3(3), 291–309. https://doi.org/10.1108/JHTI-07-2019-0097
- Kock, F., Josiassen, A., & Assaf, A. G. (2016). Advancing destination image: The destination content model. Annals of Tourism Research, 61(11), 28–44. https://doi.org/10.1016/j.annals.2016.07.003
- Le Chi, C. (2016). A formative model of the relationship between destination quality, tourist satisfaction and intentional loyalty: An empirical test in Vietnam. Journal of Hospitality & Tourism Management, 26(1), 50–62. https://doi.org/10.1016/j.jhtm.2015.12.002
- Loureiro, S. M. C., Gorgus, T., & Kaufmann, H. R. (2017). Antecedents and outcomes of online brand engagement. Online Information Review, 41(7), 985–1005. https://doi.org/10.1108/OIR-08-2016-0236
- Manyiwa, S., Priporas, C. V., & Wang, X. L. (2018). Influence of perceived city brand image on emotional attachment to the city. Journal of Place Management and Development, 11(1), 60–77. https://doi.org/10.1108/JPMD-01-2017-0011
- Mohaidin, Z., Wei, K. T., & Ali Murshid, M. (2017). Factors influencing the tourists’ intention to select sustainable tourism destination: A case study of Penang, Malaysia. International Journal of Tourism Cities, 3(4), 442–465. https://doi.org/10.1108/IJTC-11-2016-0049
- Moussa, S. (2021). Is one good enough? Gauging brand love using a visual single-item measure. Journal of Contemporary Marketing Science, 4(1), 112–131. https://doi.org/10.1108/JCMARS-11-2019-0040
- Pontinha, V. M., & Coelho Do Vale, R. (2020). Brand love measurement scale development: An inter-cultural analysis. Journal of Product & Brand Management, 29(4), 471–489. https://doi.org/10.1108/JPBM-10-2018-2094
- Ragab, H., Mahrous, A. A., & Ghoneim, A. (2020). Egypt’s perceived destination image and its impact on tourist’s future behavioural intentions. International Journal of Tourism Cities, 6(2), 449–466. https://doi.org/10.1108/IJTC-12-2018-0105
- Rustiarini, N. W., Anggraini, N. P. N., & Dewi, N. P. S. (2023). Does risk management and intellectual capital improving SME’s performance during covid-19 outbreak? Montenegrin Journal of Economics, 19(3), 149–159. https://doi.org/10.14254/1800-5845/2023.19-3.12
- Sangpikul, A. (2017). The influences of destination quality on tourists’ destination loyalty: An investigation of an island destination. Tourism: An International Interdisciplinary Journal, 65(4), 422–436. https://hrcak.srce.hr/191473
- Shahijan, M. K., Rezaei, S., & Amin, M. (2018). Qualities of effective cruise marketing strategy. International Journal of Quality & Reliability Management, 35(10), 2304–2327. https://doi.org/10.1108/IJQRM-07-2017-0135
- Strandberg, C., & Styvén, M. E. (2020). What’s love got to do with it? Place brand love and viral videos. Internet Research, 30(1), 23–43. https://doi.org/10.1108/INTR-07-2018-0311
- Sun, X., Geng-Qing Chi, C., & Xu, H. (2013). Developing destination loyalty: The case of hainan island. Annals of Tourism Research, 43(10), 547–577. https://doi.org/10.1016/j.annals.2013.04.006
- Swanson, K. (2017). Destination brand love: Managerial implications and applications to tourism businesses. Journal of Place Management and Development, 10(1), 88–97. https://doi.org/10.1108/JPMD-11-2016-0073
- Tosun, C., Dedeoğlu, B. B., & Fyall, A. (2015). Destination service quality, affective image and revisit intention: The moderating role of past experience. Journal of Destination Marketing & Management, 4(4), 222–234. https://doi.org/10.1016/j.jdmm.2015.08.002
- Tran, T. P., Muldrow, A., & Ho, K. N. B. (2021). Understanding drivers of brand love - the role of personalized ads on social media. Journal of Consumer Marketing, 38(1), 1–14. https://doi.org/10.1108/JCM-07-2019-3304
- Wallace, E., Buil, I., de Chernatony, L. C., & Leventhal, R. (2014). Consumer engagement with self-expressive brands: Brand love and WOM outcomes. Journal of Product & Brand Management, 23(1), 33–42. https://doi.org/10.1108/JPBM-06-2013-0326
- Wallace, E., Torres, P., Augusto, M., & Stefuryn, M. (2022). Do brand relationships on social media motivate young consumers’ value co-creation and willingness to pay? The role of brand love. Journal of Product & Brand Management, 31(2), 189–205. https://doi.org/10.1108/JPBM-06-2020-2937
- Wang, T.-L., Tran, P. T. K., & Tran, V. T. (2017). Destination perceived quality, tourist satisfaction, and word-of-mouth. Tourism Review, 72(4), 392–410. https://doi.org/10.1108/TR-06-2017-0103
- Wardana, I. M., Sukaatmadja, I. P. G., Yasa, N. N. K., & Astawa, I. P. (2019). Cultural tourism and ecotourism empowerment in the sustainable tourism development and destination competitiveness enhancement. Journal of Environmental Management & Tourism, 10(36), 753–762. https://doi.org/10.14505//jemt.v10.4(36).06
- Wardana, I. M., Sukaatmadja, I. P. G., Yasa, N. N. K., & Setini, M. (2020). Comparative and competitives advantages: Perspective of rural tourism (study on tourism in the province of Bali Indonesia). Geo Journal of Tourism and Geosites, 33(4), 1493–1500. https://doi.org/10.30892/gtg.334spl07-598
- Widyani, A. A. D., Suardhika, I. N., Astiti, N. P. Y., & Rustiarini, N. W. (2022). Triple helix: The concept of synergy for SMEs to increase business performance. Review of Applied Socio-Economic Research, 24(2), 174–191. https://doi.org/10.54609/reaser.v24i2.183
- Wu, C.-W. (2016). Destination loyalty modeling of the global tourism. Journal of Business Research, 69(6), 2213–2219. https://doi.org/10.1016/j.jbusres.2015.12.032
- Zhang, H., Wu, Y., & Buhalis, D. (2018). A model of perceived image, memorable tourism experiences, and revisit intention. Journal of Destination Marketing & Management, 8(6), 326–336. https://doi.org/10.1016/j.jdmm.2017.06.004