
 ?Mathematical formulae have been encoded as MathML and are displayed in this HTML version using MathJax in order to improve their display. Uncheck the box to turn MathJax off. This feature requires Javascript. Click on a formula to zoom.
Abstract
E-commerce is a comparatively classical concept that emerged into the business language in the 1970s. However, the theoretical and empirical conceptualization of the concept in marketing or consumer behaviour and economics is scanty. Therefore, we seek to statistically examine the impact of marketing strategies measured by the E-commerce index on household consumption in the United States (U.S.). Thus, the study used annual time series for data from 1990 to 2021. The study employed the autoregressive distributed lag approach, bounds cointegration, and the error correction model to establish the long-run relationship among the variables. Empirical findings revealed a positive relationship between e-commerce marketing and real household consumption in the U.S. For example, a one-unit improvement in e-commerce marketing results in a 0.72 per cent point increase in real household consumption in the long run. Unemployment also depicted a rare positive relationship, and we attributed the phenomenon to consumer confidence in the economy. Furthermore, the results showed that inflation negatively influences real household consumption in the U.S. in the long run. The study validates Engel, Kollat, and Blackwell’s model in the United States, through which we argue that the better the information firms feed consumers, the higher the household consumption and the more the sales revenue and profitability a firm earns.
1. Background
1.1. Introduction
Shahriari et al. (Citation2015), in Isoraite and Miniotiene (Citation2018), defined E-commerce as the buying and selling goods or services on computer networks. E-commerce, thus, draws on technologies such as mobile commerce, electronic funds transfer, supply chain management, internet marketing, online transaction processing, electronic data interchange (EDI), inventory management systems, and automated data collection systems. The term is a comparatively classical concept that emerged in the business language in the 1970s (Wigand, Citation1996). Jeff Bezos could be considered the founding father of e-commerce because online sales hit the limelight in 1994 when he founded Amazon.com. At its onset, Amazon only sold books, but Jeff achieved his dream of selling a wide variety of products in 2016 and realized $136 billion from sales that year. Similarly, Jack Ma launched Alibaba.com in 1999 and hit a milestone of $30.8 billion in single-day sales in 2018, beating Black Friday and Cyber Monday as the biggest single-day sales in the U.S (Luo et al., Citation2019).
Electronic commerce has greatly aided marketing with many firms, small or big, adopting online stores through websites, blogs, Facebook, Twitter, and LinkedIn. These marketing techniques are responsible for enticing consumers with what they “need” and making them think that they will not be happy and look inferior if they cannot buy certain products’ necessities’ (Solomon et al., Citation2019). Consequently, consumers hail online shopping as an arrangement of convenience for consumption due to its significant differences from seeking a brick-and-mortar store. For example, e-commerce increases the accessibility of products to consumers irrespective of distance. It also helps consumers to have one-stop shops since online stores can offer a wide range of products, from soup to nuts, as they are rarely limited to physical space. Unsurprisingly, e-commerce spending in the U.S. spiraled to nearly double within a decade from 2007 to 2017, when it hit a 10% increase as a fraction of all retail sales (Dolfen et al., Citation2019). Similarly, internet sales in China rose from scratch in 2000 to more than 400 million in 2015, surpassing the U.S. as the leading online market (Counture et al., Citation2018).
An increase in household consumption is a significant determinant of aggregate demand in a country. Various fiscal and monetary policy instruments can influence an increase in aggregate demand, such as cutting interest rates and taxes, increasing the money supply, and government spending (Lipsey & Chrystal, Citation2015). For this reason, most researchers have explored the determinants of household consumption expenditure to lobby for policy implications in favour of the aforementioned macroeconomic policy instruments. For example, in Eurasia: Cantarero & Lago-Penas, (Citation2012), Varlamova and Larionova (Citation2015), Zhou et al. (Citation2020), Zeynalova and Mammadli (Citation2020), Gogas et al. (Citation2014), Mishra (Citation2011); in Africa: Iheonu and Nwachukwu (Citation2020), Sekantisi (Citation2016), Bata et al. (Citation2018), Enbeyle et al. (Citation2020), Thomas (Citation2021), Bonsu and Muzindutsi (Citation2017); in America: Dolfen et al. (Citation2019), Goldmanis et al. (Citation2010), Guisan (Citation2004), and DiMatteo (Citation2005).
These studies focused on macroeconomic, demographic and social determinants of real household or health services consumption. They barely included e-commerce marketing as a potential determinant of household consumption. Almost all the studies directly or indirectly supported or approved the four common theories of household consumption expenditure: Keynes’s absolute income hypothesis, Modigliani’s life cycle theory of consumption expenditure, Friedman’s permanent income hypothesis and the relative income hypothesis. We have noted that studies that specified the type of consumption expenditure, such as health, adopted different theories in line with their variable of interest. Other scholars, such as Gogas et al. (Citation2014), tested the Ricardian hypothesis, which opposes Keynes’s hypothesis of government spending.
The few studies that focused on e-commerce as a determinant of household consumption also focused on its relevance in boosting aggregate demand. For example, they contend that e-commerce plays an essential role in increasing household consumption, which has both, a theoretical relevance and practical value in enhancing an economy’s economic performance (Chunfang et al., Citation2022; Martin & Schouten, Citation2014; Yu et al., Citation2019). Furthermore, some of these studies are microeconomic in nature as their focus was limited to online purchases from a particular firm such as Amazon.com or Alibaba.com, constrained to a specific number of districts in a country or limited to a specific type of online purchases like debit and credit cards (Luo et al., Citation2019, Chunfang et al., Citation2022; Dolfen et al., Citation2019; Counture et al., Citation2018).
Thus, the current study seeks to empirically examine the hyped e-commerce marketing as a determinant of household consumption. The study is unique in that most studies dwell on the consumer aspect of e-commerce, ignoring its marketing sting on firms. Previous studies highly researched the macroeconomic determinants of household consumption, including inflation, unemployment rate, savings rate, GDP or income levels, age, demographics, and real effective exchange rates, among others. Indeed, most of these researchers are economists who intended to lobby for their governments’ macroeconomic policies.
Thus, the current study is novel in that it adds to the existing literature on the impact of e-commerce on household consumption from the prism of both firms and consumers. While e-commerce brings spectacular convenience of buying to consumers, there is no doubt that e-commerce is a powerful marketing tool that has led to diversification and increased competition among firms. However, excessive competition from online stores may sweep away brick-and-mortar stores and small firms, displacing offline trading. Goldmanis et al. (Citation2010) noted an increasing closure of physical bookstores due to high online competition because the latter significantly reduces search costs. Most firms have adopted online stores, commonly social media platforms, to thrive in competition. Going digital was further intensified by firms at the peak of COVID-19 in 2020. During this period, most governments quickly supported brick-and-mortar shops in their digital realization to circumvent the spread of the virus (OECD, Citation2020). Thus, e-commerce can spearhead the top-of-funnel stream to turn into sales and customers. Digital content, search engines and social media channels are more likely to magnetize specific customers to purchase products from online shops (Dwivedi et al., Citation2021).
1.2. The Engel, Kollat, and Blackwell’s Model
The study adopts the Engel, Kollat, and Blackwell (EKB) model of consumer behaviour due to its multidimensional analysis of the determinants of consumer behaviour. Also referred to as the EKB model, it is a model that provides an analysis of consumer behaviour from the information input through the various elements of a consumer’s purchase decision-making. Since the model originates from the information fed to consumers about the suppliers or products, it is argued that the better the information a firm feeds its consumers, the more sales revenue and profitability it earns (Sahney, Citation2021). The model consists of five stages, and these are:
1.2.1. Information input
This stage is the initial and critical stage of the EKB model, which encompasses all sorts of impetuses (stimuli) that a consumer encounters and triggers consumption responses. According to Sahney (Citation2021), consumers go through numerous impetuses, including marketing and non-marketing. Examples of marketing impetuses include but are not limited to publications, advertisements, demonstrations, in-shop impetus, and personal selling. On the other hand, non-marketing impetuses such as household motivations, friendship, peers, or societal values are altruistic. All these impetuses feed the consumer with necessary and sufficient information to prompt the decision-making process to purchase a product or not.
1.2.2. Information processing
Upon receiving various information from various impetuses, consumers purify and remain with only meaningful information. This stage consists of all information to which a consumer is exposed. After that, consumers, attention is tilted towards little or one piece of information to have more awareness or comprehension and the ability to preserve the information. That is, while consumers are exposed to various impetuses and information, their attention governs the impetus upon which they dwell. In the aftermath, consumers go through the interpretation and comprehension state of mind before accepting the stimuli in their short-term memory, recollecting all or a few, and relocating to long-term memory.
1.2.3. Decision process stage
This stage is inevitable because it involves processing the information in the consumer’s long-term memory. The stage is further subdivided into five decision-process stages. That is, the identification of the problem, information searching, evaluation of substitutes, choice-making, and finally, outcomes (Solomon et al., Citation2019), as shown in Figure below:
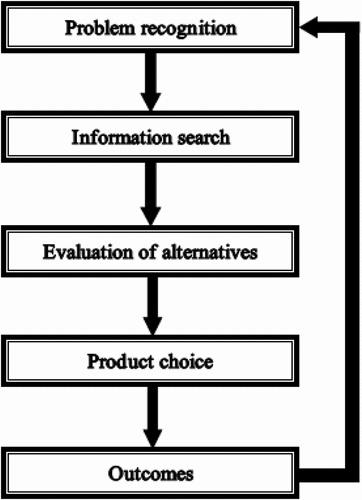
The first stage is identifying the problem (such as a family realising their Sofa set is an old model). This stage is closely associated with searching the information (asking for alternatives from friends or internet search) that is fed to the consumer and processed from short-term to long-term memory. The ability to retain information depends on internal and external factors such as memory capacity and environmental influences. Consequently, consumers assess all the available alternatives (various models and their features), which eventually leads to an attitude that affects the intention to purchase (Choosing an appealing model). Finally, choices and purchases are made following various individual differences such as income levels, tastes, and environment. Lastly, an outcome is assessed regarding consumer satisfaction or dissatisfaction emanating from purchase choice.
Sahney (Citation2021) argues that satisfaction or dissatisfaction is a form of feedback on the inputs which enables the cycle to start again. Nevertheless, the model suggests that it is optional for all consumers to encounter these five substages. This concept largely depends on the complexity of the problem since some consumer behaviours are routine while others are one-off.
1.2.4. Decision process variables
At this stage, the model outlines individual-specific determinants of the decision-making process at various stages. Some of these determinants are ascribed in that they are assigned to people at birth or were assumed involuntarily at a certain age of a person’s life, such as personality, attitude, beliefs, lifestyle, and values. On the other hand, some determinants of consumers’ decision-making process are achieved or are socially constructed.
1.2.5. External influences
This stage is the final stage, which postulates various environmental and situational determinants that strongly affect consumers’ decision-making. Elements like circles of influence such as cultural background—culture, subculture and class, reference groups, household, and subjective influences are incident in a set of environmental determinants. A consumer’s overall financial status or wealth comprises a set of situational determinants.
The EKB model is presented in the schema in Figure below:
Figure 2. Engel-Kollat-Blackwell (Engel-Blackwell-miniard) model of consumer behavior.
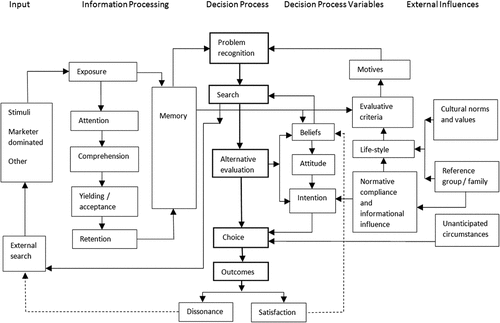
As per this paper’s research objective, we argue that the decision taken by an individual to purchase a product over various alternatives is determined by the impetuses (stimuli). Therefore, critical to facilitating consumers’ stimuli is marketing, such as e-commerce activities. A business organization that has a website and other online platforms through which consumers can access the shops will provide more information to consumers to enable them to make well-informed purchase decisions. From this perspective, this paper purports that an increase in the development of e-commerce will increase household consumption.
This relationship may be positive or negative depending on consumers’ interpretation of the information and comparison with available alternatives. Solomon et al. (Citation2019) argued that purchase decisions are not equally important, and the extent of effort on each decision significantly differs. For example, some decisions arrive automatically as snapshots of verdicts from the limited information available. Sometimes, consumers spend a wholesome number of hours, days, weeks, or even years while agitating over a critical purchase decision such as a house, car, or property.
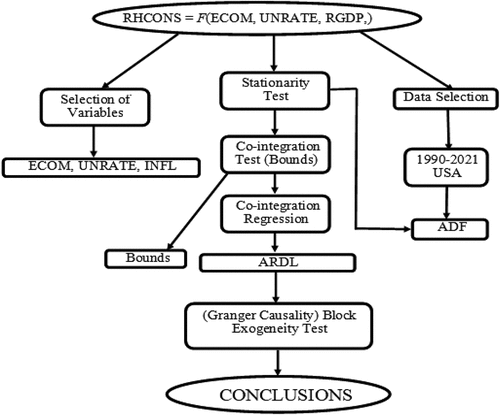
The rest of this study has been organized so that chapter two outlines the methods used to analyze data. Chapter three presents the results and chapter four accounts for discussion. Lastly, chapter five concludes the study. All the activities done in this study are shown in the schema Figure below;
Figure 3. Research organization schema.
2. Methods
2.1. Data
This study employed real household consumption as a dependent variable, while e-commerce was used as a primary variable of interest. On the other hand, the control variables were unemployment and inflation rate. Thus, the study used a time series design from 1990 to 2021. Measurement and data sources are explained below;
2.1.1. Real household final consumption expenditure
Measured in US dollars and adjusted to inflation, Real household final consumption expenditure encompasses all residential household’s expenditure; on necessities such as food, shelter, clothing, education and health: luxurious items like durable goods, holidays and miscellaneous goods and services. People spend money to meet their everyday needs (OECD, Citation2012). Consumption is the dependent variable of interest in this study, and data has been collected from the International monetary fund (Citation2022). Different studies have used different indicators of household expenditure. For example, Iheonu and Nwachukwu (Citation2020) used Nonprofit Institutions and Saving Households (NPISHs), Varlamova and Larionova (Citation2015) used Private Household Expenditure (PHE), and Bata et al. (Citation2018) used Household Food Consumption Expenditure (HFCE). Bonsu and Muzindutsi (Citation2017) argued that the core aim of economic activity is household consumption. Therefore, it is expected that every economic stimulus can alter household consumption.
2.1.2. E-commerce retail sales
This study’s dependent variable of interest is E-commerce, also called internet sales. Chai et al. (Citation2021) defined e-commerce as exchanging goods and services or transmitting funds or data using electronic gadgets with an internet connection. Retail e-commerce sales employed in this study are measured in U.S. dollars as a percentage of total sales in the U.S., and data is obtained from U.S. Census Bureau (Citation2022). E-commerce can occur between business to business (b2b), business to consumers (b2c) and consumers to business. E-commerce can allow businesses to develop online stores, advertise their products and sell. Therefore, online stores and advertisements equip consumers with the necessary information to make well-informed purchase decisions. Therefore, it is expected in this study that an increase in the development of e-commerce will increase household expenditure.
2.1.3. Unemployment rate
According to Fred’s Economic data definition, the unemployment rate is the number of people aged 16 or more enthusiastically looking for a job as a proportion of the total labour force. This rate is also defined as the U-3 measure of labour underutilization. Data for the unemployment rate was obtained from the U.S. Bureau of Labour Statistics (Citation2022). We argue that an increase in unemployment is associated with decreased income levels in an economy. Therefore, the a priori hypothesis is that an increase in unemployment will decrease real household expenditure. We adopt the variable because it has been highly researched as a determinant of household consumption elsewhere. Most studies on determinants of household consumption in the U.S. barely included the e-commerce variable, such as Codjia and Saghaian (Citation2022), Ramdhanie et al. (Citation2016), Gorbachev (Citation2011), and Ketkar and Cho (Citation1982).
2.1.4. Inflation rate
Inflation is defined as a continuous increase in the general price level in an economy over time. An increase in prices indicates a rise in the cost of living. People have to spend more than before on the same basket of goods in an economy. In other words, an increase in price level is associated with a decrease in items in the basket of goods purchased by a fixed amount of money. Oner (Citation2021) Stressed that a rise in the price level indicates the extent to which relevant goods become expensive annually. Therefore, the a priori hypothesis in this study is that a rise in inflation is expected to decrease household consumption patterns. Data for inflation was obtained from the World Bank (Citation2022).
2.2. Econometric specification
The Autoregressive Distributed Lag (ARDL) model is deemed appropriate to examine the impact of e-commerce on household consumption expenditure in the United States. According to Banda (Citation2023), this model is valid for small sample sizes and produces reliable t statistics even in the presence of endogenous regressors with appropriately unbiased long-run model estimates. While this study uses 31 observations, other studies that employed the ARDL model, such as Jeke and Wanju (Citation2021), Chirwa (Citation2003), and Simwaka et al. (Citation2012), used as lower as 17, 25, and 24 observations, respectively. In addition, the ARDL estimation technique deals with the problem of the order of integration that hinges on using the Johansen likelihood technique. The ARDL model can be used even when the variables are integrated into the same or different orders, except for higher orders of I(2) and above (Udoh et al., Citation2015).
Borrowing from Habanabakize (Citation2021), the linear equation among the variables of interest is presented as follows;
The long-run linear specification for the function in equation 1 is presented in a reduced form as follows:
Where;
lnRHCON: is the natural logarithm of real household consumption expenditure
lnECOM: is the natural logarithm of e-commerce
lnUNRATE: is the natural logarithm of unemployment rate
lnINFL: is the natural logarithm of inflation rate
: is the intercept
: are the coefficients of the explanatory variables
e: is the stochastic error term
t: is the time period
The current study employed the ARDL model because it can be applied to variables integrated of order zero, order one, or both, except for the second or high order level. This ARDL model is sufficient for analyzing a single function’s long-run association among the variables. Deriving from Equationequation (1)(1)
(1) , the ARDL model is expressed as follows:
Where to
are long-run coefficients and
are short-run dynamic coefficients.
The bounds cointegration test is applied to Equationequation (3)(3)
(3) to test the existence of the long-run relationship among the study’s variables. The decision of the bounds test dwells on comparing the Pesaran et al. (Citation2001) critical values and the F-statistic results. If the F-statistic is higher than the chosen upper critical bounds, the study will run the vector equilibrium or error correction model since a long-run relationship exists. However, the study will only excavate the short-run dynamic coefficients if the calculated F-statistic falls below the lower critical bound. On the other hand, the study will not proceed if the F-statistic falls between the selected lower and upper critical bounds.
In case there is no long-run relationship among the variables, then we will run the ARDL model depicting the short-run dynamic coefficients expressed as follows:
2.3. Diagnostic tests
The study adopts the Dickey-Fuller technique to test for unit roots among the study series. Otherwise, if the data has a unit root and the researcher proceeds with estimation, it may yield spurious or meaningless regressions (Granger & Newbold, Citation1974). Suppose the series are integrated of either order one or zero or both. In that case, the Bounds cointegration test will be used to inspect the long-run relationship over the Johansen cointegration test. The recursive cusum square, Ramsey RESET, Durbin Watson and the Breusch Pagan tests will be employed to test for model stability, model misspecification, serial correlation, and heteroscedasticity, respectively. On the other hand, the skewness-kurtosis test will be used to test for normality among residual terms.
3. Results
3.1. Summary statistics
Table below presents descriptive statistics showing the properties of the study’s raw variables.
Table 1. Descriptive statistics
3.2. Real household consumption
Summary statistics indicate that real household consumption in the United States averaged 12.0 between 1990 and 2021. The skewness of real household consumption mirrors that of a normal distribution. The standard deviation is too big, suggesting that the series data points are significantly different from the mean value of the series. The variance is relatively smaller, meaning that the series’ data points are not highly dispersed. On the other hand, its kurtosis of 1.94 is less than that of a normally distributed series. Therefore, e-commerce is platykurtic since it has minimal tails on either side and is less peaked than the hypothetical normal distribution.
3.3. E-commerce
The results indicate that E-commerce averaged 3.88% of total sales in the United States between 1990 and 2021. The peak in internet sales was achieved in 2019 when e-commerce accounted for 15.7% of all sales in the U.S. The data trend shows that since 1995, there has been an annual increase without a fall up to 2019. In 2018, internet sales first hit the double-digit at 10.5%, representing a 10.5% increase in internet sales from 2017, when internet sales kissed goodbye to the single-digit figure at 9.5%. The standard deviation reveals that the data points are closer to the mean values, whereas the variance shows that the data points are relatively further from each other. The skewness for e-commerce of 1.1 is higher than that of a normal distribution which is zero. This value means the degree of symmetry deviates from a normal distribution. Finally, the kurtosis for e-commerce is 3.64, while for the data to be normally distributed, the kurtosis value must be 3. Therefore, e-commerce is leptokurtic.
3.4. Unemployment rate
Summary results indicate that the unemployment rate averaged 5.8% between 1990 and 2021. The unemployment rate in the U.S. was highest at 9.8% in 2009, which could be attributed to the 2007 to 2009 great depression and the global financial crisis. On the other hand, the variance for the unemployment rate is as small as 2.68, which indicates that the data points are highly closer to each other. Similarly, the standard deviation is as tiny as 1.65, which implies that the unemployment rate data points are closer to their mean of 5.8. Its skewness is 0.8, which is more comparable to that of a normal distribution which is zero. This value means the degree of symmetry does not deviate from a normal distribution. Indeed, the kurtosis for unemployment is 3.05, significantly closer to 3. Hence, we conclude that the unemployment rate perfectly assimilates a normal distribution.
3.5. Inflation
Summary statistics indicate that the general rate of the price level in America averaged 2.35% between 1990 and 2021. The variance for the inflation rate is as small as 2.68, which shows that the data points are highly closer. Similarly, the standard deviation is only 1.65, which implies that the data points for the inflation rate are closer to their mean of 2.35. Its skewness is 0.03, which means that the distribution mirrors a normal distribution whose kurtosis is zero. This value implies that the degree of symmetry does not deviate from a normal distribution. Indeed, the kurtosis for unemployment is 3.67, significantly above a normal distribution. Like e-commerce, the inflation rate is leptokurtic. That is, it has heavy tails on either side and a peak taller than the hypothetical normal distribution, which illustrates the existence of huge outliers.
3.6. Pearson Correlation Analysis
Correlation analysis is an essential statistical technique in assessing the strength of linear association between a pair of two variables (Hejase & Hejase, Citation2013). Table presents the results of the Pearson correlation matrix analysis.
Table 2. Correlation matrix
The interpretation of correlation analysis is guided by Evans (Citation2002) and Hejase and Hejase (Citation2013). For the variables of this study, the outcomes indicate a robust positive relationship between e-commerce and real gross domestic product. The unemployment rate and real household consumption depict a weak negative relationship with e-commerce. Most importantly, the unemployment rate negatively correlates with the inflation rate. However, these correlation relationships are basic and can only be validated by the p-values of a correctly specified regression analysis.
3.7. Stationarity tests results
Before this test, all variables were transformed into log forms. This process helps to make variables more normally distributed and improve the regression results (Benot, Citation2011). The outcome of the Augmented Dickey-fuller test for unit root is shown in Table below:
Table 3. Augmented Dickey-Fuller (ADF) test results
The outcome of the ADF test shows that all independent variables are integrated of order one, except for the dependent variable, which is integrated in level. The result entails that all independent variables had the unit-root problem in level. Consequently, we took the first difference of these variables to avoid yielding spurious regression from their raw use. After first differencing I(1), the variables were found unit-root free (stationary) and ready for meaningful estimation. Therefore, the autoregressive distributed lag (ARDL) modelling technique is appropriate for the nature of our data. This approach is employed when the combination of integration is either order zero or one or both (Banda, Citation2021). We thus shun away from conducting the Johansen ordinary least square estimation (OLS), which uses the maximum likelihood. This regression estimation technique only applies when all variables are integrated of order zero.
3.8. Bounds cointegration test results
The results of the stationarity test allow us to use the bounds cointegration test over the Johansen test. The test helps to investigate the long-run relationships among the variables. The Akaike Information Criteria (AIC) was used to decide the maximum lag order for each variable since each variable is treated as a dependent variable in the ARDL estimation technique (McNown et al., Citation2016). Table below shows the results of the bounds cointegration tests;
Table 4. Bounds cointegration test results
In each case, the computed F-statistic is greater than the upper critical value at 95% and 99% confidence intervals. Therefore, we reject the null hypothesis of no long-run relationship and conclude that there exists a long-run relationship among the variables in all four specifications. Befitting the objective of this study, we normalize our analysis on Real Household Consumption. The F-statistic of 13.195 for our specified dependent variable is large enough and higher than the upper critical value of 5.61 at the 99% level giving us enough evidence for the existence of the long-run relationship. Thus, we later present the results of a vector error correction model (VECM) to establish the long-run relationship among all variables: e-commerce, unemployment rate, and inflation rate when real household consumption is normalized as the dependent variable.
3.9. Diagnostic tests results
We conducted the required diagnostic tests before presenting the vector error correction results for the real household consumption model. Passing these diagnostic tests helps to render the results of the VECM ARDL valid and reliable for forecasting. Table presents the results of diagnostic tests.
Table 5. Diagnostic tests
The p-values for each test are greater than 0.05. Therefore, we reject the null hypotheses and conclude that the model has no heteroscedasticity, no model misspecification, no autocorrelation and that the residuals are multivariate normal.
Figure below shows the test result for model stability using the recursive CUSUM square stability test. The result shows that the trend falls within the 5% level for most of the period of this study. Therefore, we conclude that all parameters are stable during this study period.
Figure 4. Result of Cusum square stability test.

3.10. Cointegration form and Short-run Dynamics
Table presents the model estimation results. The ARDL VECM of the matrix lag list (3 3 3 2) was guided by the Akaike Information Criteria (AIC) normalized on real household consumption and independent variables: E-commerce, Unemployment, and inflation.
Table 6. ARDL long-run and short-run results
To begin with, the coefficient of the error correction term (ECT) is appropriately negative and strongly statistically significant at conventional levels. E-commerce is positive and shows that a one-unit improvement in e-commerce marketing will improve household consumption by 0.72 per cent points, at ceteris paribus. Contrary to the a priori expectation, a one-unit increase in the unemployment rate results in a 0.35 per cent point increase in household consumption in the United States.
Finally, the coefficient of inflation reveals that a one-unit increase in average prices will reduce real household consumption by 0.14 per cent points, at ceteris paribus. These findings are discussed in section 3.
4. Discussions
The model estimation results indicate that the long-run p-value for e-commerce is significant at a 5% significance level with a positive coefficient. That is, a one-unit transformation of brick-and-mortar stores into online stores will boost its sales by 0.72 per cent points, at ceteris paribus. Similarly, the estimated coefficient of the short-run indicates that the first two lags of e-commerce are significant and positive. The first lag, for example, shows that a one-unit improvement in e-commerce leads to an increase in household consumption by 0.111 per cent points, at ceteris paribus. Thus, we reject the null hypothesis and conclude that E-commerce marketing increases household consumption in the long run.
This conclusion is in line with the a priori hypothesis. That is, an improvement in E-commerce marketing improves consumers’ buildup of trust in online stores. Thus, consumers will be able to order products at any time of their choice and save up money that could be used for travelling and physically searching for products, thereby increasing household consumption which means more sales for firms.
Dolfen et al. (Citation2019) estimated a binary model of purchasing online or offline in the United States and noted that a consumer’s gain from online purchases is tantamount to 0.4% of consumption. Their main estimate revealed a welfare gain of over 1% of consumption in 2017, equivalent to more than $1,000 per household. Similarly, Chunfang et al. (Citation2022) and Luo et al. (Citation2019) observed that e-commerce development is associated with higher real household consumption patterns in China. However, in a rural-focused study on “e-commerce villages” in China, Counture et al. (Citation2018) found little evidence of income gains for rural producers and workers from e-commerce trading. They observed that welfare gains are limited to certain groups of rural households and particular markets, not generalized broad-based gains.
We have also observed that the long-run p-value for the unemployment rate is significant at a 5% level. However, contrary to its hypothesis, the coefficient is surprisingly positive. The long-run coefficient, for example, reveals that a one-unit increase in unemployment increases household consumption by 0.36 per cent points, at ceteris paribus. The consensual viewpoint is that unemployment reduces incomes and people’s ability to purchase goods and services. For example, Penrose and La Cava (Citation2021) observed that unemployment significantly reduces household expenditure on their home. Similarly, Bata et al. (Citation2018) argued that increasing employment levels is critical to boosting household consumption in Nigeria.
However, the household spending variable used in this study includes all items on which the household spends its money, such as food, electronics, cars, and others. Therefore, this study’s finding concurs with Engel’s Law, which states that consumers’ percentage of income on food increases as their income falls while it decreases when income rises. According to Engel’s Law, unemployed people have low incomes, and their expenditure on luxury will decrease as priority will be placed on food and other necessities (Clements & Si, Citation2018). In addition, high consumer confidence could explain the increase in household consumption associated with increasing unemployment in the United States. That is, a rise in unemployment in the U.S. may not cause worry to people when they have the trust of quick economic restoration. These people, therefore, are likely to maintain a monotonic increase in household consumption. Indeed, it is reported that the 2009 economic recession did not significantly reduce household consumption as the demand for durable products increased (European Central Bank, Citation2011). The phenomenon is not surprising, considering that durable products are expensive and may take up a larger proportion of household consumption expenditure.
In line with the a priori hypothesis and the common paradigm, the estimated short-run coefficients indicate that unemployment negatively influences household consumption expenditures in the U.S. The first lag, for example, suggests that a one-unit increase in unemployment decreases household consumption by 0.028 per cent points. Conversely, a one-unit increase in the employment rate will improve household consumption by 0.028 per cent points. Various case studies confirm that low unemployment increases incomes which boosts household expenditure, such as Enbeyle et al. (Citation2020), Isoraite and Miniotiene (Citation2018), and Sekantisi (Citation2016).
As anticipated, the long-run coefficient for inflation is also significant at a 5% level, and the coefficient is negative. The coefficient indicates that a one-unit increase in inflation decreases real household consumption by 0.15 per cent points. This conclusion is more fathomable, considering that an increase in inflation leads to a loss in the real value of money and significantly reduces its purchasing power. This finding is similar to Iheonu and Nwachukwu’s (Citation2020) results, who also observed a negative relationship between inflation and household expenditure in selected West African countries. Observing similar findings in Ghana, Olusola et al. (Citation2022) argued that inflation increases the cost of living, and the price of goods and limits job opportunities, reducing both income levels and household consumption expenditure.
Based on the null block exogeneity (granger causality) test results in Table (see Appendix A), we conclude the existence of a bidirectional granger causality among the following pair of variables: consumption and e-commerce; consumption and unemployment; e-commerce and unemployment; and a unidirectional Granger causality among the following pair of variables: consumption to inflation; and e-commerce to inflation. Indeed, while e-commerce increases household consumption, the result is an increase in aggregate demand, and when aggregate demand exceeds aggregate supply in an economy, demand-pull inflation occurs.
Lastly, the study had some limitations. For example, the study is a country-specific analysis with 31 aggregated observations. This current number of observations makes it impossible to incorporate more variables in the regression analysis because it gives inestimable results. Therefore, this study could not incorporate all the variables of the EKB model in its estimation procedure, especially those sociological and psychological. We only managed to capture marketing and economic variables. To capture as many variables as possible from the EKB model, we advise future researchers to consider panel data analysis to increase the number of observations in their studies.
5. Conclusions
This study investigated the impact of e-commerce on household consumption in the United States of America. In its theoretical framework, the paper adopted Engel, Blackwell, and Kollat’s model of consumer behaviour due to its multifaceted nature to bring together elements of marketing, economics, sociology, and psychology. The EKB model analyses how consumers make purchase decisions after being fed various information from different firms. From this perspective, the a priori expectation of this study was that an improvement in the development of e-commerce marketing would increase sales and household consumption expenditure in the U.S.
The study adopted a time series analysis for data from 1990 to 2021, obtained from Fred’s economic databank and analyzed using STATA 14. The study specified the model such that real household consumption expenditure was the dependent variable, while e-commerce was the primary independent variable of interest. Inflation and unemployment rate were included as control variables. These series were tested for stationarity, and the real household consumption variable was stationary in level, whereas all other variables were stationary after first differencing. A combination of series integrated of order zero and one rules out the Johansen cointegration and OLS estimation, which are only applicable for the I(0) series. Thus, the current study uses the Bounds cointegration and the autoregressive distributed lag (ARDL) estimation procedure.
Furthermore, the f-statistic of the bounds cointegration test was higher than the upper critical bound at 1% and 5% levels. Therefore, we ran the vector error correction (VEC) ARDL model to excavate the long-run and short-run marginal effects of e-commerce, unemployment and inflation on real household consumption. The long-run and short-run coefficients of the first two lags of e-commerce reveal their positive and statistically significant impacts on real household consumption. On the other hand, the coefficient of the third lag is negative and significant. Both these phenomena confirm the EKB model. The negative short-run coefficient result complies with the argument that too much information will delay consumers from making purchase decisions because it takes a long time to synthesize the information and reach a purchase decision.
On the other hand, the positive long-run estimated coefficient complies with the argument of the EKB model that the availability of businesses on the internet will reduce consumers’ search costs and logistics expenses and help them make decisions at any place and anytime. In the long run, consumers will have more readily available information, making purchasing decisions easy. The block exogeneity wald test confirmed that e-commerce, inflation and unemployment granger-causes real household consumption in the United States.
To this end, the study suggests that B2B and B2C may experience an upsurge in transactions if businesses significantly invest in e-commerce. For example, businesses should at least possess a well-developed website that allows consumers to navigate the media platforms and browse their products easily. Therefore, it is more applicable in the modern world for businesses to be available on social media platforms such as LinkedIn, Twitter, and Facebook and provide customized information to consumers.
List of Abbreviations
ADF Augmented Dickey-Fuller
AIC Akaike Information Criterion
ARDL Autoregressive Distributed lag;
AIH Absolute Income Hypothesis
BLUE Best Linear Unbiased Estimation
B2B Business to Business
B2C Business to Consumers
CPI Consumer Price Index
ECT Error Correction term
E.K.B Engel-Kollat Blackwell
HDI Human development Index
HCE Household Consumption Expenditure
U.S United States
GDP Gross Domestic Product
LCH Life Cycle Hypothesis
PIH Permanent Income Hypothesis
PCE Private Consumption Expenditure
RIH Relative Income Hypothesis
RESET Regression Specification Error Test
OLS Ordinary Least Squares
VECM Vector Error Correction Model
Author contributions
ZZK came up with the research idea, gathered the data and drafted the manuscript’s framework. LGB cross-checked and approved the data collection process and was instrumental in model specification, data analysis, and interpretation of results. All authors proofread and certified the final research.
Ethics approval and consent to participate
The current study employed secondary data, and does not require ethical clearance.
Disclosure statement
No potential conflict of interest was reported by the author(s).
Data availability statement
The datasets analysed during the current study are available in Mendeley data repository as follows: Banda, Lloyd George; Kassam, Zahra (2022), “E-commerce data for America”, Mendeley Data, V1, doi: 10.17632/2mjjzxt7×m.1
Additional information
Funding
References
- Banda, L. G. (2021). Determinants of commercial banks’ performance in Malawi: An autoregressive distributed lag (ARDL)ApproachTMEC_A_2275034. National Accounting Review, 3(4), 422–18. https://doi.org/10.3934/NAR.2021022
- Banda, L. G. (2023). Good Governance and human welfare development in Malawi. Malawi Journal of Social Science, 2023(22), 89–119. . https://doi.org/10.2139/ssrn.4235681
- Bata, U. M., Aliero, H. M., Gatawa, N. M., & Elijah, S. (2018). An empirical study of the determinants of household food consumption expenditure in Gombe State. International Journal of Humanities and Social Science Intervention, 7(9), 36–49. http://ijhssi.org/papers/vol7(9)/Version-3/G0709033649.pdf
- Benot, K. (2011). Linear regression models with logarithmic transformations. London School of Economics. https://kenbenoit.net/assets/courses/ME104/logmodels2.pdf
- Bonsu, C. O., & Muzindutsi, P. F. (2017). Macroeconomic determinants of household consumption expenditure in Ghana: A multivariate cointegration approach. International Journal of Economics and Financial Issues, 7(4), 737–745. https://www.econjournals.com/index.php/ijefi/article/view/3846
- Cantarero-Prieto, D., & Lago-Peñas, S. (2012). Decomposing the determinants of health care expenditure: The case of Spain. The European Journal of Health Economics : HEPAC: Health Economics in Prevention and Care, 13, 19–27. https://doi.org/10.1007/s10198-010-0276-9
- Chai, W., Holak, B., & Cole, B. (2021). E-commerce. TechTarget. https://www.techtarget.com/searchcio/definition/e-commerce
- Chirwa, E. W. (2003). Determinants of commercial bank’s profitability in Malawi: A cointegrationapproach. Applied Financial Economics, 13(8), 565–571. https://doi.org/10.1080/0960310022000020933
- Chunfang, Y., Yifeng, Z., & Suyun, W. (2022). The impact of internet on household consumption expenditure: An empirical study based on China family panel studies data. Economic Research-Ekonomska Istraživanja, 36(3). https://doi.org/10.1080/1331677X.2022.2150255
- Clements, K. W., & Si, J. (2018). Engel’s Law, diet diversity, and the quality of food consumption. American Journal of Agricultural Economics, 100(1), 1–22. https://doi.org/10.1093/ajae/aax053
- Codjia, C. O., & Saghaian, S. H. (2022). Determinants of food expenditure patterns: Evidence from U.S. Consumers in the context of the COVID-19 price shocks. Sustainability, 14(13), 8156. https://doi.org/10.3390/su14138156
- Counture, V., Faber, B., Gu, Y., & Liu, L. (2018). Connecting the countryside via e-commerce: Evidence from China. National Bureau of Economic Research, Working paper 24384. https://www.nber.org/papers/w24384
- DiMatteo, L. (2005). The macro determinants of health expenditure in the United States and Canada: Assessing the impact of income, age distribution and time. Health Policy (Amsterdam, Netherlands), 71(1), 23–42. https://doi.org/10.1016/j.healthpol.2004.05.007
- Dolfen, P., Einav, L., Klenow, P. J., Klopack, B., Levin, J. D., Levin, L., & Best, W. (2019). Assessing the gains from E-commerce. National Bureau of Economic Research, Working Paper 25610. https://www.nber.org/papers/w25610
- Dwivedi, Y. K., Ismagilova, E., Hughes, D. L., Carlson, J., Filieri, R., Jacobson, J., Jain, V., Karjaluoto, H., Kefi, H., Krishen, A. S., Kumar, V., Rahman, M. M., Raman, R., Rauschnabel, P. A., Rowley, J., Salo, J., Tran, G. A., & Wang, Y. (2021). Setting the future of digital and social media marketing research: Perspectives and research propositions. International Journal of Information Management, 59, 102168. https://doi.org/10.1016/j.ijinfomgt.2020.102168
- Enbeyle, W., Meslie, Y., & Pandey, D. (2020). Determinants of household consumption expenditure in Tepi Town, SNNPR, Ethiopia. International Journal of Intelligent Computing and Technology, 4(1), 40–56. https://ijict.com/V4I1/V4I1P05.pdf
- Engel, J. F., Blackwell, R. D., & Miniard, P. W. (1986). Consumer behavior, 5th edition, CBS College Publishing. In Navigating uncertainty: Tourists’ perceptions of risk in ocean cruising J. Holland Eds University of Brighton. https://www.researchgate.net/publication/339513025
- European Central Bank. (2011). Household spending, consumer confidence and durable consumption. July Bulletin European Central Bank. https://www.ecb.europa.eu/pub/pdf/other/mb201107_focus04.en.pdf
- Evans, M. K. (2002). Practical Business forecasting. Blackwell Publishers.
- Gogas, P., Plakandaras, B., & Papadimitriou, T. (2014). Public debt and private consumption in OECD countries. Journal of Economic Asymmetries, 11, 1–7. https://doi.org/10.1016/j.jeca.2014.03.001
- Goldmanis, M., Ali, H., Chad, S., & Önsel, E. (2010). E-commerce and the market structure of retail industries. The Economic Journal, 120(545), 651–682. https://doi.org/10.1111/j.1468-0297.2009.02310.x
- Gorbachev, O. (2011). Did household consumption become more volatile? The American Economic Review, 101(5), 2248–2270. https://doi.org/10.1257/aer.101.5.2248
- Granger, C. W., & Newbold, P. (1974). Spurious regressions in econometrics. Journal of Econometrics, 2(2), 111–120. https://doi.org/10.1016/0304-4076(74)90034-7
- Guisan, M. C. (2004). A comparison of causality tests Applied to the Bilateral relationship between consumption and GDP in the USA and Mexico. International Journal of Applied Econometrics and Quantitative Studies, 1, 115–130. https://ideas.repec.org/a/eaa/ijaeqs/v1y2004i1_6.html
- Habanabakize, T. (2021). Determining the household consumption expenditure’s resilience towards petrol price, disposable income and exchange rate volatilities. Economies, 9(2), 87. https://doi.org/10.3390/economies9020087
- Hejase, A. J., & Hejase, H. J. (2013). Research methods: A practical approach for business students (2nd ed.). Masadir Incorporated.
- Holland, J. (2019). Navigating uncertainty: Tourists’ perceptions of risk in ocean cruising. PhD thesis. University Brighton. https://research.brighton.ac.uk/en/studentTheses/navigating-uncertainty
- Iheonu, C. O., & Nwachukwu, T. (2020). Macroeconomic determinants of household consumption in selected West African countries, AGDI Working Paper, No. W.P./20/031, African Governance and Development Institute (AGDI), Yaoundé. https://ideas.repec.org/a/ebl/ecbull/eb-19-01071.html
- International Monetary Fund. (2022). Real households final consumption expenditure for United States [NCPHIRSAXDCUSQ], retrieved from FRED, Federal Reserve Bank of St. Louis; https://fred.stlouisfed.org/series/NCPHIRSAXDCUSQ
- Isoraite, M., & Miniotiene, N. (2018). Electronic commerce; theory and practice. Integrated Journal of Business and Economics, 2(2), 73–79. https://doi.org/10.33019/ijbe.v2i2.78
- Jeke, L., & Wanju, L. Z. (2021). The economic impact of unemployment and inflation on output growth in South Africa. Journal of Economics and International Finance, 13(3), 117–126. https://doi.org/10.5897/JEIF2021.1124
- Ketkar, S. L., & Cho, W. (1982). Demographic factors and the pattern of household expenditures in the United States. Atlantic Economic Journal, 10(3), 16–27. https://doi.org/10.1007/BF02300157
- Lipsey, R. G., & Chrystal, K. A. (2015). Economics: Lipsey & chrystal (13th ed.). Oxford University Press.
- Luo, X., Wang, Y., & Zhang, X. (2019). E-Commerce development and household consumption growth in China. Policy Research Working Paper 8810. World Bank. http://hdl.handle.net/10986/31539
- Martin, D. M., & Schouten, J. W. (2014). Consumption-driven market emergence. Journal of Consumer Research, 40(5), 855–870. https://doi.org/10.1086/673196
- McNown, R., Sam, C. Y., & Goh, S. K. (2016). Bootstrapping the autoregressive distributed lag test for cointegration. University of Colorado, Discussion Papers in Economics. Working Paper No. 16-08. https://www.colorado.edu/economics/sites/default/files/attached-files/wp16-08.pdf
- Mishra, P. K. (2011). Dynamics of the relationship between real consumption expenditure and economic growth in India. Indian Journal of Economics and Business, 10(4), 541–551. http://www.ashwinanokha.com/resources/1328945436–10.pdf
- OECD. (2012). National accounts of OECD countries. OECD Publishing. http://dx.doi.org/10.1787/2221433x.
- OECD. (2020). OECD policy responses to coronavirus (COVID-19): E-commerce in the time of COVID-19. https://www.oecd.org/coronavirus/policy-responses/e-commerce-in-the-time-of-covid-19-3a2b78e8/
- Olusola, B. E., Chimezie, M. E., Shuuya, S. M., & Addeh, G. Y. A. (2022). The impact of inflation rate on Private consumption expenditure and economic growth—evidence from Ghana. Open Journal of Business and Management, 10(4), 1601–1646. https://doi.org/10.4236/ojbm.2022.104084
- Oner, C. (2021). Inflation: Prices on the rise. Finance and development. https://www.imf.org/external/pubs/ft/fandd/basics/30-inflation.htm#:~:text=Inflation%20is%20the%20rate%20of,of%20living%20in%20a%20country.
- Penrose, G., & La Cava, G. (2021) .Job loss, subjective expectations and household spending, RBA Research Discussion Papers rdp2021-08, Reserve Bank of Australia. https://doi.org/10.47688/rdp2021-08.
- Pesaran, M. H., Shin, Y., & Smith, R. J. (2001). Bounds testing approaches to the analysis of level relationships. Journal of Applied Econometrics, 16(3), 289–326. https://doi.org/10.1002/jae.616
- Ramdhanie, V., Pemberton, C., & Granderson, I. (2016). Socio-economic factors affecting household food expenditure in North Trinland. Tropical Agriculture, 94(1), 20–30.
- Sahney, S. (2021). Consumer behavior. NPIEL. Vinod Gupta School of Management. Indian Institute of Technology. https://nptel.ac.in/content/storage2/courses/110105029/pdf%20sahany/Module.5%20-12.pdf
- Sekantisi, L. P. (2016). Determinants of real Private consumption expenditure in Lesotho. Journal of Corporate Governance, Insurance, and Risk Management (JCGIRM), 3(2), 58–75. https://doi.org/10.56578/jcgirm030204
- Shahriari, S., Shahriari, M., & Ggheiji, S. (2015). E-commerce and it impacts on global trend and market. International Journal of Research-GRANTHAALAYAH, 3)4, 49–55. https://doi.org/10.29121/granthaalayah.v3.i4.2015.3022
- Simwaka, K., Munthali, T., Kabango, G., & Chiumia, A. (2012). Financial development and economic growth in Malawi. An empirical analysis. Banks and Bank Systems, 7(3), 85–96.
- Solomon, M. R., Askegaard, S., & Hog, M. K. (2019). Consumer behaviour. Pearson Education Canada. EbookCentral: http://ebookcentral.proquest.com/lib/leicester/detail.action?docID=5835673.
- Thomas, H. (2021). Determining the household consumption expenditure’s resilience towards petrol price, disposable income and exchange rate volatilities. Economies, 9(2), 87. https://doi.org/10.3390/economies9020087
- Udoh, E., Afangideh, U., & Udeaja, E. A. (2015). Financial decentralization, economic growth and human resources development in Nigeria: Autoregressive distributed lag (ARDL) approach. CBN Journal of Applied Statistics, 6(1), 69–93. https://www.econstor.eu/handle/10419/142091
- U.S. Bureau of Labor Statistics. (2022). Unemployment rate [UNRATE], retrieved from FRED, December 21, 2022 Federal Reserve Bank of St. Louis; https://fred.stlouisfed.org/series/UNRATE.
- U.S. Census Bureau. (2022). E-Commerce retail sales as a percent of total sales [ECOMPCTSA], retrieved from FRED, Federal Reserve Bank of St. Louis; December 21, 2022. https://fred.stlouisfed.org/series/ECOMPCTSA.
- Varlamova, J., & Larionova, N. (2015). Macroeconomics and demographic determinants of household expenditures in OECD countries. Procedia Economics and Finance, 24, 727–733. https://doi.org/10.1016/S2212-5671(15)00686-3
- Wigand, R. T. (1996). Electronic commerce: Definition, theory, and context. The Information Society, 13(1), 1–16. https://doi.org/10.1080/019722497129241
- World Bank. (2022). Inflation, consumer prices for the United States [FPCPITOTLZGUSA], retrieved from FRED, Federal Reserve Bank of St. Louis; December 21,2022. https://fred.stlouisfed.org/series/FPCPITOTLZGUSA.
- Yu, L., Zhao, Y., Ling, T., & Yang, Z. (2019). Online big data-driven oil consumption forecasting with Google trends. International Journal of Forecasting, 35(1), 213–223. https://doi.org/10.1016/j.ijforecast.2017.11.005
- Zeynalova, Z., & Mammadli, M. (2020). Analysis of the economic factors affecting household consumption expenditures in Azerbaijan. Journal of Critical Reviews, 7(7), 241–248. https://doi.org/10.31838/jcr.07.07.40
- Zhou, L., Ampon-Wireko, S., Asante, A. H., Xu, X., Salman, M., Antwi, M. O., & Afua, T. (2020). An empirical study on the determinants of health care expenses in emerging economies. BMC Health Services Research, 20(1), 774. https://doi.org/10.1186/s12913-020-05414-z
Appendix A
TableA1: Granger causality/block exogeneity wald test results