?Mathematical formulae have been encoded as MathML and are displayed in this HTML version using MathJax in order to improve their display. Uncheck the box to turn MathJax off. This feature requires Javascript. Click on a formula to zoom.
Abstract
Small and medium enterprises (SMEs) serve as pivotal drivers of global economic growth, a consensus reiterated by influential scholars. Yet, a critical challenge impeding their progress is the limited access to capital financing, hampering the expansion prospects of countless small businesses worldwide. In South Africa, this dilemma is especially pronounced, with many SMEs either struggling or shuttering due to financial constraints. The Johannesburg Stock Exchange (JSE) devised a solution: The Alternative Exchange (AltX), a dedicated platform designed to ease capital financing for SMEs and boost their growth. In this study, we used secondary data obtained from the lower bourse, as well as other relevant databases for the period 2003 to 2019 to ascertain its impact on SME performance. Eviews 12 statistical software package was used to carry out an Ordinary Linear Regression (OLS) empirical analysis. We find that SME listing positively influences small business performance in South Africa. Furthermore, these listed firms’ continued expansion is propelling them to become larger enterprises within a remarkably short span, transcending national borders. Our results robustly affirm a positive correlation between AltX listing, market capitalization, revenue, their Broad-Based Black Economic Empowerment (B-BBEE) score, Earnings Before Interest, Taxes, Depreciation, and Amortization (EBITDA), and improved SME performance. Moreover, this contributes to the existing literature by empirically proving that the boost in SME performance aligns with heightened GDP growth, suggesting a symbiotic relationship between the two. We recommend that policymakers should offer incentive schemes to enhance their performance given its impact on sustainable national growth and development.
1. Introduction
Despite the government’s support for small businesses, many small and medium enterprises (SMEs) in South Africa have been handicapped by the unavailability of capital financing to carry out their expansion projects (Herrington et al., Citation2016). Furthermore, there are some fundamental gaps in South Africa’s macroeconomic structure created by past racial prejudices that deserve readjustment (Egu & Aregbeshola, Citation2017). This has created an invisible kind of barrier for firms that are trying to enter the domestic market. Likewise, the impact of declining revenues is inversely linked with the rising wage bill that is a response to incessant workers’ strikes. Consequently, this limits the anticipated metamorphosis of SMEs into larger firms due to the non-availability of funding to attract the requisite expertise and resources that are necessary to drive their growth. In response to this setback, coupled with the changing global and local macroeconomic dynamics the Johannesburg Stock Exchange (JSE) set up an alternative exchange (AltX) in 2003 to accommodate good quality, small- and medium-sized high-growth companies that can help grow the economy (JSE, Citation2016).
In addition, the apartheid policies in South Africa systematically marginalized black populations, including Africans, Coloureds, and Indians, from active participation in the national economy, resulting in profound skill disparities and widespread poverty, unemployment, and apathy. In response, the African National Congress (ANC) government initiated the Broad-Based Black Economic Empowerment (B-BBEE) program to address these socio-economic challenges, aiming to translate democratic principles into social justice, equality, and economic empowerment by advancing political and economic rights. While B-BBEE compliance isn’t universally mandatory, it’s often required for businesses engaging in government tenders and procurement, offering tax incentives and financial grants (Egu, Citation2022). The B-BBEE Amendment Act Citation2013 (2014) strengthened compliance enforcement, underscoring its moral and strategic significance. This legislation also mandated JSE-listed entities, including AltX firms, to undergo B-BBEE verification and report compliance, with specific audit-related obligations. AltX plays a pivotal role in helping SMEs and larger Main Board-listed companies meet their B-BBEE transaction scorecard objectives. This commitment to B-BBEE compliance has spurred government agencies and private companies to partner with listed SMEs for various business opportunities. According to The Department of Trade, Industry and Competition [the dtic] (Citation2015), B-BBEE compliance encourages private firms and government agencies to engage with listed SMEs in tender processes, license applications, permits, and public sector procurement, not only for legal adherence but also to access tax incentives and financial grants.
Consistent with the findings of the World Economic Forum (Citation2016, p. 2) study stating that new alternative capital sources have significant effects on both the capital supply side and the capital demand side of a firm’s capital financing requirements, the JSE’s AltX is projected to impact positively on the operations of SMEs. Thus, it is expected that firm listing on the lower bourse will create disruptions that will reinvigorate the marketplace and accelerate the growth of small businesses (Global Entrepreneurship Monitor, Citation2018). Hence, this inclination would eventually pave the way for unhindered economic participation in post-apartheid South Africa especially among black disadvantaged communities (Bhorat, Citation2015). Also, this implies that capital resources can therefore both be optimally and efficiently allocated between competing investment opportunities, and all things being equal, will also lead to the growth of SMEs and the level of entrepreneurship in South Africa.
The rest of the paper is structured as follows. Section 2 reviews the relevant background literature of this study—which is divided into theoretical background and conceptual development sections. Later on, the hypotheses section motivates our study and establishes the study hypotheses that are conjectured, to contribute to new knowledge in this area of scholarship. Thereafter, the following Section 4 identifies the econometric data for this study, as well as the empirical methodology that this study employs together with the model estimation framework in this research. Furthermore, Section 5 presents the empirical results, while Section 6 focuses on the discussion and conclusion of the study.
2. Background and justification of the study
It is a widely known fact that South Africa struggles with persistently high levels of unemployment (in particular youth unemployment), low levels of total (early-stage) entrepreneurial activity (TEA) index, as well as low levels of economic growth (Egu et al., Citation2017; Herrington & Kelly, Citation2012; Herrington et al., Citation2016). Previous research on entrepreneurship justifiably points out that there is growing scientific evidence that entrepreneurial activities matter for employment, productivity, and ultimately, economic growth. As such, SME policies have been given greater visibility, because it provides a key source of dynamism, innovation, and flexibility for most net job-creating schemes worldwide. Additionally, although several agencies of government like the Small Enterprise Development Agency (SEDA) have been mandated to operate business incubators to assist emerging companies to survive and grow during the highly volatile start-up period, very few SMEs have benefitted from these initiatives. While the SEDA assists in improving the survival rate of start-up companies via the incubation of SMEs in a synergistic environment, however, this agency has failed in the area of assisting SMEs in placing Initial Public Offerings (IPOs) on the stock exchange (Peters & Naicker, Citation2013).
According to Tsele (Citation2016), the JSE is often seen as the exchange that exclusively serves large companies such as AB InBev, BHP Billiton, and Anglo American, however, listing on the AltX has been used as a growth strategy by small and medium businesses as well. Evidence from the listing of Gold Brands Investments (which owns the popular Chesa Nyama franchise) reveals how effective the AltX can be used to nurture small businesses, because, within 2 months of listing and raising R25 million, the traditional flame-grilled meat franchise has strategically expanded operations, in the process becoming one of the nation’s fastest-growing brands with about 300 franchises across South Africa and employing over 3000 people. This seemingly important good news does not stop there, the Chesa Nyama franchise is planning to expand its tentacles into the United States of America (USA) very soon (Gold Brands Investments, Citation2016).
Recent studies carried out by the United Nations (Citation2016) reveal that there is a growing disconnect between finance and real sector activities. Perhaps not surprisingly, the main aim of creating the JSE’s AltX was to remedy this gap, so that SMEs can make viable acquisitions and improve business processes that distinguish them from their unlisted peers. Thus, it is anticipated that rapid SME growth should accelerate the process of sustainable national growth. Cheyne (Citation2016) observed that the AltX is doing what it was set up to achieve because it has listed over 120 companies and raised a total of R48.5bn since its inception in 2003. As of December 2016, about 60 companies were listed on the AltX with a combined market capitalization of R32.6bn. However, the delisting of 24 percent of the firms that have been registered on the lower bourse and the migration of 26 percent of these listed firms to the main board motivates the researcher to probe the impact that listing on the JSE’s AltX has on firms’ performance.
Apart from this problem being of current interest, it is also an area of future research. Many SMEs have failed in South Africa due to resource impoverishment and management incompetence because these SMEs face significant disadvantages against larger and well-established businesses. The World Economic Forum (Citation2016) posits that alternative investments are the future of capital for entrepreneurs and SMEs. According to Naidoo (Citation2006), this sector has been identified to be performing sub-optimally, given that its contributions towards economic growth and development significantly fall short of expectations.
Recent research has delved into various aspects of SME performance and innovation. Chaithanapat et al. (Citation2022) examined the interplay between knowledge-oriented leadership, customer knowledge management, innovation quality, and firm performance in SMEs. Chen et al. (Citation2023) investigated the determinants of cloud computing adoption by SMEs under the cloud promotion policy. Hilmersson and Hilmersson (Citation2021) explored the role of networking in expediting SME innovations. Karmaker et al. (Citation2023) analyzed supply chain risk factors in SMEs, with a focus on sustainability in emerging economies. Ortigueira-Sánchez et al. (Citation2022) studied the innovation drivers contributing to export performance. Stefanelli et al. (Citation2022) examined crowdfunding in the lending business and its support for SMEs’ financing decisions. Collectively, these studies provide valuable insights into the multifaceted landscape of SMEs’ innovation, performance, and sustainability. However, further investigation is warranted to comprehensively understand the intricate dynamics of Corporate Entrepreneurship, as suggested by Hind (Citation2018), which offers a nonlinear approach to modeling Corporate Entrepreneurship and individual innovation behavior. This body of literature highlights the pressing need for a holistic examination of factors influencing SME performance and the adoption of innovative practices in diverse contexts.
According to Heerden (Citation2015), the JSE Main Board (which is among the top 20 stock exchanges in the world) offers large established companies the opportunity to seek the next level of growth that enables them to facilitate export opportunities, licensing, turnkey projects, franchising, joint ventures or wholly-owned subsidiaries operating in various locations. Nevertheless, Hind and Steyn (Citation2015) rightfully point out that the AltX provides listed firms the opportunities to use the capital raised to drive systemic growth and increase their revenue. Likewise, the AltX regulatory compliance provisions lead to a direct positive influence on SMEs’ organizational performance due to high-level corporate governance requirements. Thus, increased shareholder value aids the creation and sustenance of corporate competitiveness and innovation. However, some notable scholars such as Mlonzi et al. (Citation2010), Harvey (Citation2016), and Mmako (Citation2021) are of the view that the JSE’s AltX is not a robust platform for achieving sustainability and growth for high growth potential SMEs due to its weak-form of market efficiency, poor returns, and long-term underperformance. Although, all over the world stock exchanges have been widely studied because of their impact on economic growth (Bayar et al., Citation2014; Ghosh & Karmakar, Citation2014; Kim & Heshmati, Citation2014), little is known about the contribution of the AltX to SME performance in South Africa. Consequently, this trend has created a gap in the extant body of literature, and as a matter of high significance necessitates a thorough study on the impact of the JSE’s AltX on listed firms’ performance taking into cognizance their market capitalization, revenue, their B-BBEE score, which also impacts their Earnings Before Interest, Taxes, Depreciation, and Amortization (EBITDA), as well as on the number of registered firms on the lower bourse. By so doing, this study attempts to fill the gap in the literature.
South Africa’s SMEs have long been integral to its economic landscape, yet the impediments to their growth have remained a challenge. One such challenge lies in the availability of capital for expansion, a hurdle faced by many SMEs in the country (Herrington et al., Citation2016). These financial constraints are exacerbated by historical racial disparities within the country’s economic structure, a legacy of apartheid policies (Egu & Aregbeshola, Citation2017). These disparities have created formidable barriers for emerging firms attempting to access the domestic market. In addition, SMEs face an additional financial burden, with increasing wage bills resulting from recurrent labor strikes, which further curtails their growth prospects. The dearth of necessary resources and expertise required for substantial expansion has left these SMEs in a precarious position.
Recognizing the vital role that SMEs play in the South African economy, and in response to these challenges, the JSE established the AltX in 2003, aiming to provide a growth platform for high-potential, small- and medium-sized firms (JSE, Citation2016). Simultaneously, the government initiated the B-BBEE program to address socioeconomic inequalities, aligning with democratic principles of social justice, economic empowerment, and political rights (Egu, Citation2022). The B-BBEE program is significant, often required for businesses involved in government tenders and procurement, offering incentives such as tax breaks and financial grants. With AltX’s role in helping SMEs meet B-BBEE requirements and fostering new business opportunities, its potential to drive SME growth in South Africa, particularly in historically disadvantaged communities, has come into focus.
3. Aims and objectives
This study is motivated by the complex economic challenges facing SMEs in South Africa and the role that AltX listing may play in their performance and growth. The primary objective is to examine how AltX listing influences the performance of SMEs. To address this, we proposed hypotheses 1a, 1b, and 1c of the study. Hence, this study also explored the potential effects of the number of companies listed on AltX and the EBITDA of AltX-listed firms on SME performance. This leads to the formulation of hypotheses 2a and 2b. These hypotheses aim to examine whether the size and financial performance of AltX, as indicated by the number of listed companies and EBITDA, are associated with improved SME performance. Through this research, we aim to provide valuable insights into the factors that influence the performance and growth of SMEs in the context of AltX listing, contributing to a deeper understanding of this sector’s role in South Africa’s economic development.
4. Theoretical background
Raising capital to boost firm performance has become a very critical topic for both researchers and practitioners in recent years since the non-availability of capital is the major constraint that inhibits the growth of SMEs in the country. Heerden (Citation2015) reinforces earlier conjectures about this phenomenon, after admitting that the capital raised on the lower bourse by SMEs could be used to finance their expansion, as well as lead to the rapid transformation of these small business ventures into high-growth firms. Although the paucity of evidence to substantiate the underlying theory with empirical authentication is an enormous problem in this area, few scholars have validated earlier claims and have used the findings of their research to reinforce the literature arguments in this field of study.
All over the world, inadequate SME financing is considered a significant constraint to the rate of business birth rate, which leads to business discontinuation (Egu et al., Citation2017). Borrowing from corporate finance literature, the financial growth cycle model for SMEs advances the underlying theory which influences small firm financing. According to Gregory et al. (Citation2005), it has been observed that as firms grow older, larger, and employ more staff they tend to comply with complex financial reporting/governance standards and, as such can meet the requirements of listing on the stock exchange. This ultimately ensures that they meet the documentation requirements for various financing options—a sine qua non (i.e. necessary condition) to obtain funding for expansion.
Similarly, López-Gracia and Sogorb-Mira (Citation2008) posit that SMEs’ financial policy and capital structure are prominently influenced by both the pecking order model and trade-off model. It has been empirically proven in entrepreneurship and SME literature that most businesses’ start-up capital comes from the personal savings of individuals, family, and friends, which oftentimes are not sufficient to cover the operational costs of running these firms. This is because many micro and start-up firms do not have credit records or history, hence, their heavy reliance on costly microfinance loans, seed capital, as well as other angel finance (Adair et al., Citation2015; Casser & Holmes, Citation2003; Matemilola & Bany-Ariffin, Citation2011). Later on, as SMEs grow, they begin to use the retained profits of the firm, overdrafts, and short-term and long-term bank loans, including leases, trade financing/factoring, and venture capital funding/mezzanine to finance their operation; this nevertheless becomes inadequate and costly in the long run. However, with greater exposure, experience, and age, SMEs patronize the stock market for strategic reasons, especially due to the less expensive nature of this source of capital financing—via IPOs, corporate bonds, and equity sales, so that their long-term sustainability can be guaranteed.
Furthermore, borrowing from the trade-off theory (TOT) and pecking order theory (POT) firms leverage their corporate financial portfolio based on a critical path that yields optimum profit from a short to a long-term period. Modigliani and Miller (Citation1958, Citation1963) posit that firms are motivated to use debt rather than equity instruments because debt payments are tax deductible and less risky in the short run. However, in the long run, it becomes more expensive thereby necessitating a mixture of both instruments, based on the weighted average cost of capital—WACC (Tarver, Citation2022). SMEs can therefore leverage on borrowed capital and benefit from the pooling of investors’ funds since company shares are purchased and dividends are paid to shareholders at a fractional cost that is less than firm profits when compared to bank loans. Therefore, listing offers SMEs the opportunity to benefit from the cheap and affordable capital finance instruments that are available on the lower bourse.
Like most phenomena, scholars have differing opinions about SME finance growth theory. Myers and Majluf (Citation1984) thus developed the POT to cater to the information asymmetry that existed between a firm’s ownership/management and other stakeholders. They argued that most firms use internal financing to fund their operation, but as time goes by and their resources are depleted, debt financing becomes the main source of financing. However, as more debt is piled on existing loans the firm approaches bankruptcy, and equity issuance becomes sacrosanct (López-Gracia & Sogorb-Mira, Citation2008). At this point, investors seek part ownership and control of these firms in exchange for funding. This is assumed to be overvalued by investors, consequently causing constant re-adjustment of the company’s share price (towards the equilibrium level) in the stock market. The aforementioned theoretical background provides a clear path and an eye-opener for SMEs indicating why they have to list in marketplaces like the JSE’s AltX, the London Stock Exchange’s (LSE) Alternative Investment Market (AIM), the upper-tier of the US over-the-counter market (OTCQX), Italy’s AIM Italia, Japan’s Tokyo AIM, and the TSX-V in Canada (London Stock Exchange, Citation2018).
5. Conceptual development
Contemporary literature studies have contended that the level of entrepreneurship differs significantly across various regions and countries (Egu et al., Citation2016; Herrington et al., Citation2014, Citation2016). In some localities clusters of dynamic firms gain from marketplace information spillover, while in other places intangible factors may be linked with the success of firms. The establishment of the AltX is expected to precipitate spillovers from this sector to the broader economy. The findings of Lucky and Olusegun (Citation2012) reveal that the iterative process of SME creation leads to an accelerated growth rate and the migration of successful SMEs into large high-growth firms that are listed on the stock exchange.
Despite the pernicious effect of a turbulent macroeconomic environment in South Africa, the lower bourse has continued to play a strategic role in the development of several entrepreneurial ventures. Literature studies carried out by Theunissen (Citation2012), Mashaba (Citation2014), and Heerden (Citation2015) suggest that firm listing on the AltX strengthens the financial position of SMEs. This argument is fortified by the importance of company share offerings, which aid the reinforcement of SMEs’ dynamic capabilities, consequently, resulting in faster firm growth and profitability. Since most SMEs in South Africa are cash-strapped and rely on costly loans to survive, it will be imprudent to use such expensive sources of financing when the AltX offers cheaper funding opportunities. Moneyweb (Citation2015) is of the view that the AltX has proven to be an effective incubator because it allows SMEs to gain the vital publicity of listing on an open market, and simultaneously assist in training the directors of these young firms.
An appraisal of the JSE’s AltX indicates that most of the listed firms have benefited from the 24 hours 7 days a week online trading platform, as well as the capital market access it provides worldwide. Besides, registering on the lower bourse enables firms to consolidate their position in their industry via the strategic acquisition of assets, or companies holding such assets that can accommodate both the expansion and the future growth for the firm, in line with their short, medium, and long-term objectives. According to Heerden (Citation2015), this boosts their liquidity levels and acts as a hedge against the risks that might confront them later on. Also, the utilization of listing funds to diversify SME market segments and increase manufacturing volume is positively linked to firm growth. Convincingly, SMEs that are listed on the AltX have performed better than their unlisted peers due to enhanced transparency levels and financial probity as manifested by business professionalism and profitability.
We, therefore, developed the conceptual model of this research to ascertain if listing on the AltX contributes to SME performance in South Africa (Figure ). We anticipate that as SMEs grow exponentially on the lower bourse, later on, they will seek an upgrade to the Main Board of the JSE, to gain access to a larger flow of capital that can be used to develop long-term strategic positioning for these firms via acquisitions, joint ventures, and global partnerships. However, as earlier stated in the theoretical background of this study, increasing revenue growth for SMEs would lead to further expansion, and could also inspire firms delisting from the JSE’s AltX to address the issue of the dilution of the shareholding of listed companies. We assume that firms could also deregister from the lower bourse due to the increasing costs that can be associated with the AltX listing requirements. Although some firms might get deregistered over time, this causes such companies to learn from their experience, reinforce, and re-list on the exchange later on. This dynamic nature of the stock exchange stimulates an iterative process of entrepreneurialism because when listed firms’ share prices go up and down profit is made by investors and speculators simultaneously, thus keeping the market active at all times.
Figure 1. Conceptual model of the study.
6. Hypotheses development
Given that the stock exchange presents an opportunity for financing the SME sector, the JSE’s AltX brings together those with substantial savings to invest and those who require capital. We predict that this iterative process would enable the acceleration of economic growth due to the engagement of idle resources for productive purposes (World Economic Forum, Citation2017). Following this assumption, we envision that as more firms get listed on the lower bourse their total revenue will grow and lead to increased levels of market capitalization for the junior board (Egu, Citation2014; Egu & Aregbeshola, Citation2017; World Economic Forum, Citation2017). However, as time goes on, some of these firms will transform from small to large firms, and as such would require additional capital funds, which would necessitate their promotion to the JSE’s Main Board. Despite the merits of increased capital growth, some of these firms would voluntarily delist from the AltX due to the resistance of the company board to intense dilution of share ownership and control.
It has been documented in the literature that as SMEs benefit from the accretion of their assets over a medium to long-term period, their business would grow and outpace smaller non-capitalized firms, which are left behind in the Schumpeterian gale of creative destruction (Schumpeter, Citation2013). Consequently, listed firms on the JSE’s AltX would result in the rise of the manufacturing capacity of the nation via the creation of new products and services. Besides, such a rapid rise in SME production would lead to long-term economic growth, as evidenced by increased market capitalization, revenue, and B-BBEE score. Thus, small firms would be able to raise significant capital from the JSE’s AltX to enable them to engage in high-level research and development (R&D). This would lead to the creation of non-imitable firm-specific advantages (FSAs) due to the resultant cost-effective exploitation of technology (Deakins & Freel, Citation2012). According to Murphy et al. (Citation2006) increased entrepreneurialism generates a logical dynamic reality that is Kirznerian in nature and is correlated with economic arbitrage, alertness to profit-making opportunities, and the distinction of ownership from entrepreneurship. We envisage this to happen because firms can muster significant resources that can attract value-adding skilled manpower and capital. Accordingly, we hypothesize that:
Hypothesis 1a:
AltX market capitalization positively influences SME performance.
Hypothesis 1b:
The revenue of JSE’s AltX-listed firms positively affects SME performance.
Hypothesis 1c:
The Broad-Based Black Economic Empowerment (B-BBEE) Score positively impacts the performance of listed firms on the JSE’s AltX.
Not only does the performance of listed firms on the JSE’s AltX benefit small businesses, but the improved performance of firms, the stock exchange, and the economy also translate to superior gross domestic product (GDP) figures (World Economic Forum, Citation2017). As observed by numerous scholars, better-quality SME revenue and profitability would likely lead to company expansion, which would cause multiplier effects on the economy. To take cognizance of other externalities and country-specific advantages (CSAs) that might accrue to the economy, we also, add the effects of poverty levels, interest, exchange, and inflation rates, as well as the unemployment figures levels, so that we can accurately measure the impact of this phenomenon on SMEs (Miller & Kim, Citation2017). Our theorizing is therefore consistent with prior studies since it positively associates firm growth with overall economic growth (Herrington et al., Citation2016). We posit that increased levels of firm listing on the JSE’s AltX are positively linked with both the growth in the number of SMEs in the country and the GDP growth levels.
Although the economic pulse of the nation is slowing down due to increased political uncertainties, the renewed commitment of the new African National Congress (ANC) leadership is weakening the level of intensity of such sentiments on the nation’s economy. This renewed commercial vibrancy that is instigated by a myriad of SME activities would lead to a real GDP growth rate, despite declining rates across the world (Deakins & Freel, Citation2012; Herrington et al., Citation2014, Citation2016). According to Amorós and Bosma (Citation2014), higher levels of GDP yield more and better job opportunities. As the number of the JSE’s AltX-listed companies increases, we anticipate a comparable level of growth in their EBITDA and the number of SMEs in South Africa. Also, we expect the impact of better performance levels of the JSE’s AltX-listed firms to trigger and accelerate a proportionate growth level in the GDP of the country, as evidenced by the attractiveness of their core corporate profitability to investors, bankers, regulatory institutions, as well as other relevant stakeholders. Thus, we formulate our second hypothesis, as follows:
Hypothesis 2a:
The number of AltX companies has a positive effect on SME performance.
Hypothesis 2b:
The Earnings Before Interest, Taxes, Depreciation, and Amortization (EBITDA) of listed firms on the JSE’s AltX have a positive impact on the performance of SMEs.
7. Data
To accurately compute a model that would test this study’s hypotheses, we used relevant macroeconomic variables from the JSE’s AltX, the Heritage Foundation, the Department of Small Business Development (DSBD), the Global Entrepreneurship Monitor (GEM), the South African Reserve Bank (SARB), and the World Bank’s World Development Indicators (WDI) to derive our econometrics estimation. Our period of interest starts from the inception of the AltX to date (i.e. 2003–2019). The main reason for using the WDI data was because it is the most up-to-date and precise primary collection of development indicators from the World Bank that is compiled from officially recognized international sources (World Economic Forum, Citation2017). Likewise, the JSE’s AltX data provides a comprehensive quantitative compendium of the impact of listing on SME performance, since it specifies the business outlook, capitalization levels, and trends in the lower bourse. Also, the Heritage Foundation Index of Economic Freedom score of South Africa was used to measure the impact of a free market economy on SMEs’ performance in the country (Miller & Kim, Citation2017). More importantly, the DSBD data of the number of SMEs was used as a benchmark to assess the impact of firm listing on the performance of small businesses (it uses the term interchangeably to measure SMEs). The GEM Total early-stage Entrepreneurial Activity (TEA) rate, which assesses the percentage of working age population both about to start an entrepreneurial activity, or that has started one for a maximum of 3 years and a half is to measure the effect of a firm listing on the JSE’s AltX on SME performance in South Africa (Global Entrepreneurship Monitor, Citation2018).
Furthermore, we collected 10 variables from the JSE’s AltX, which are as follows; (1) the number of the JSE’s AltX listed SMEs coded as AltX_Companies, (2) the JSE’s AltX total market capitalization coded as AltX_MarketCap, (3) the B-BBEE (composite) score of listed firms on the AltX coded as B_BBEE_Score, (4) the total number of company delisting on the AltX coded as Delisting, (5) the earnings before interest, taxes, depreciation, and amortization of listed companies on the AltX is coded as EBITDA, (6) the total number of new listings on the JSE’s AltX coded as New_Listings, (7) the total annual revenue of companies listed on the AltX is coded as Revenue, (8) the total number of reverse listings from the JSE’s main board to the AltX is coded as Reverse listings from JSE, (9) the total number of company suspensions coded as Suspensions, and (10) the total number of transfers to the main board of the JSE coded as Transfers_to_JSE. In addition, the WDI and SARB data comprises the under-listed variables; a) the GDP of South Africa measured by current US $ value coded as GDP_Current_US_$, b) the level of secondary education attainment coded as Education_Level, c) the official exchange rate measured by the average local currency unit (LCU) per US $ coded as Exchange_Rate, d) the level of inflation measured as a percentage of consumer prices in the country coded as Inflation_Rate, e) the percentage lending interest rate coded as Interest_Rate, f) the World Bank estimate of the GINI index of South Africa annual percentage growth coded as Poverty_Levels and g) the national estimate of the unemployment rate of South Africa as a percentage of the total labor force coded as Unemployment_Rate. Other relevant variables such as i) the TEA rate of South Africa coded as TEA_Rate, ii) the total number of SMEs in South Africa coded as SMEs, and iii) the index of economic freedom of South Africa coded as Economic_Freedom were also employed in our econometric estimation so that we can arrive at a valid and reliable conclusion in this study.
8. Methodology
Due to the complexity of the phenomenon that is being investigated, we used the ordinary least squares (OLS) regression model to analyze the econometric variables in this study, because it is conceptually simple and computationally straightforward. This procedure was adopted to avoid estimation biases and to ensure consistency (Wooldridge, Citation2013). Furthermore, the use of the OLS statistical method in this research relies on the assumption that the stochastic process is stationary. We also assume that y = f (x), where y is the dependent variable and x is the independent variable. Hence, our unbiased estimator is of the form , where
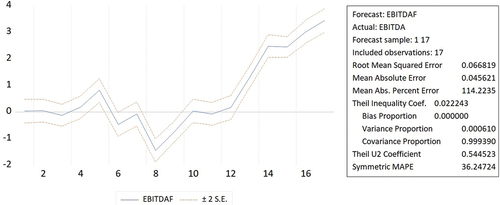
, ��0 = Constant factor or term (known as y—Intercept), 1 = Coefficient of 1, 2 = Coefficient of 2,1 = Independent or Explanatory variable 1, 2 = Independent or Explanatory variable 2, t represents time, and = Random error term/residuals. EViews 12 was used to conduct the OLS analyses of the econometrics data for this study. Likewise, we also reported some of the modular table effects for this study with the aid of graphical simulations and illustrations, for instance, the leverage plots (Figures ), the multiple series stacked in single graphs (Figures ), and the forecasts (Figures ) for this study’s hypotheses indicated that our model was correctly specified (EViews, Citation2022). We consequently interpreted the statistical and economic significance of our econometrics variables based on the proposed effects for hypotheses 1a, 1b, 1c, 2a, and 2b.
9. Model estimation
Having explored our estimation variables, we developed and operationalized our econometric estimation equation to test our study’s hypotheses. We ensured that this equation was robust and that it did not possess any attribute or evidence of collinearity. This ensured that our model did not inhibit the calculation of individual predictors. Consequently, our model estimation equation is as follows:
For the hypothesis 1a estimation equation, we computed our test model as;
Where C(1) … C(8) are the coefficients of the associated independent variables, and C(9) is the constant coefficient of the equation.
Then, we substituted the coefficients of the estimation equation for hypothesis 1a later on, as follows;
For the hypothesis 1b estimation equation, we computed our test model as;
Where C(1) … C(8) are the coefficients of the associated independent variables, and C(9) is the constant coefficient of the equation.
Then, we substituted the coefficients of the estimation equation for hypothesis 1b later on, as follows;
For the hypothesis 1c estimation equation, we computed our test model as;
Where C(1) … C(8) are the coefficients of the associated independent variables, and C(9) is the constant coefficient of the equation.
Then, we substituted the coefficients of the estimation equation for hypothesis 1c later on, as follows;
For the hypothesis 2a estimation equation, we computed our test model as;
Where C(1) … C(12) are the coefficients of the associated independent variables, and C(13) is the constant coefficient of the equation.
Then, we substituted the coefficients of the estimation equation for hypothesis 2a later on, as follows;
For hypothesis 2b estimation equation we computed our test model as;
Where C(1) … C(13) are the coefficients of the associated independent variables, and C(14) is the constant coefficient of the equation.
Then, we substituted the coefficients of the estimation equation for hypothesis 2b later on, as follows;
The above estimation representations revealed that our work file statistics data was unstructured and undated, while this study’s variables have on average thirteen (17) observations. Furthermore, our data object comprising 21 series (including residuals) and 357 data points, as well as 1 coefficient with 750 data points, yielded a total count of 22 variables and 1107 data points in this study (Wooldridge, Citation2013). The Cronbach alpha (α) test for all the econometric variables for this study surpassed the recommended threshold of 0.70 with a combined test scale of 0.93 (Nunnally, Citation1978), while the average interitem correlation among all the constructs was 0.42—which is within the stipulated threshold level of between 0.15 to 0.50 recommended by Dunn et al. (Citation1994). This confirms and ensures the reliability and internal consistency of our dataset.
Furthermore, the unit root tests (although not reported, can be accessed from the authors) affirm that the series did not exhibit any statistical indication of the presence of unit root, because they were stationary and stable at both the first and second difference (Woodward et al., Citation2012). To a great extent, there is also ample evidence that the econometric variables in this study are cointegrated; implying that there is a long-run relationship between them (Hatemi, Citation2008). Also, to show the robustness of our model data, the residual diagnostic tests were carried out with no sign of serial correlation and heteroskedasticity.
10. Results
The ensuing econometrics analyses present the estimations of our dependent variable on the independent variables, as represented in the hypotheses section of this study. From Table we can deduce that the descriptive statistics and correlations among study variables are fairly distributed (Wooldridge, Citation2013). Also, the individual and group correlations indicate that collinearity does not pose a problem, however, instances of high correlation are taken into consideration when applying the OLS analysis, such that it does not invalidate the results generated for this study (EViews, Citation2022). In addition, the dummy variable trap was avoided and identical variable elements were dropped, so that models with significant coefficients can be adapted for this study.
Table 1. Descriptive statistics and correlations
To test the veracity of Hypothesis 1, an OLS test was implemented and its analysis is presented above in Table . We observed that some of the econometrics variables were significant at between 1 percent and 5 percent levels. In Model 1, Table , the number of listed firms on the JSE’s AltX exhibited a strong positive relationship with the market capitalization of registered SMEs in South Africa (coeff. = 0.28, p < 0.01). This is consistent with the findings of similar studies (Deakins & Freel, Citation2012; Global Entrepreneurship Monitor, Citation2018; Herrington et al., Citation2016; World Economic Forum, Citation2017). In contrast, the number of firms that the gain promotion to the JSE’s Main Board was negatively associated with the market capitalization of listed SMEs of the junior bourse in South Africa (coeff. = −2.69, p < 0.05). It could thus be that on listing on the JSE’s AltX many SMEs gain the requisite experience, exposure, and funding to expand their operational base, which facilitates their transition from small to large firms, as exhibited by their transfers to the more stringent but liquid JSE main board. Hence, all things being equal, the opportunity-driven nature of these firms is profit-motivated and distinguishes them from the largely necessity-driven entrepreneurship that is being undertaken by the majority of SMEs in South Africa. Correspondingly, the number of new listings on the AltX (coeff. = 0.35, p < 0.05), as well as the number of firm suspensions from the JSE’s AltX was positively and significantly related to the market capitalization of registered SMEs in South Africa (coeff. = 1.49, p < 0.01).
Table 2. Hypothesis OLS analysis output tabulation
As earlier stated in the theoretical section of this study, borrowing from both TOT and POT, the WACC of SMEs could make long-term listing problematic for these firms due to the onward dilution of share ownership and board composition that it portends (Tarver, Citation2022). This might compel these listed companies to delay their reporting based on the technicality of being suspended for a while, pending when they reap enough profits from their operations to buy back substantial shares from investors, consequently regaining firm control and voting rights. Nevertheless, the R-squared value of 94.07 percent suggests a positive relationship between the dependent variable and the independent variables. This implies that the variation in the market capitalization of the JSE’s AltX can be explained by independent variables. Interestingly, the high R2 value suggests the existence of an efficient model with robust predictive potential. This is evidenced by a reduced log-likelihood value of −40.63, which indicates that the overall model is significant. Hence, the F-statistic of 15.87 shows that there exist statistically significant relationships (p < 0.001), which indicates that the variables in this model also exhibit high predictive ability. We, therefore, conclude that Hypothesis 1a, i.e., the AltX market capitalization positively influences SME performance in South Africa, all things being equal.
Contemporaneously, Hypothesis 1b results displayed in Model 2 of Table show that the GDP of South Africa at current US dollar market prices exhibited a strong positive relationship with the annual revenue of registered SMEs in South Africa (coeff. = 6.60, p < 0.01). However, the number of firm suspensions from the JSE’s AltX was negatively and significantly related to the revenue of registered SMEs in South Africa (coeff. = −0.51, p < 0.01). This suggests that there exists an inverse relationship between the revenue of listed firms on the AltX and the rate of firm suspensions (Mmako, Citation2021). When registered SMEs perform well, few firms would likely get suspended, all things being equal, and vice versa. Nevertheless, the coefficient of the equation had a non-random constant value of −8.45 (p < 0.01), which implies that it has a negative direct relationship with the explained variable. Thus, for every unit increase in the intercept coefficient, there is a predicted decrease of 8.45 in revenue levels of listed firms on the AltX, and vice versa. Equally, the R-squared value of 97.19 percent suggests a positive relationship between the dependent variable and the independent variables. This implies that the variation in the annual revenue of the JSE’s AltX can be jointly explained by independent variables. This is reinforced by a reduced log-likelihood value of −26.96, which indicates that the overall model is significant. Therefore, the F-statistic of 34.53 shows that there exist statistically significant relationships (p < 0.001), which indicates that the variables in the model also exhibit high predictive ability. We, therefore, conclude that Hypothesis 1b, i.e., the revenue of JSE’s AltX listed firms positively affects SME performance in South Africa, ceteris paribus.
Furthermore, in Model 3 of Table , Hypothesis 1c results indicate that the GDP of South Africa at current US dollar market prices exhibited a strong positive relationship with the B-BBEE score of registered SMEs in South Africa (coeff. = 108.73, p < 0.01). According to Egu (Citation2022), higher compliance requirements for listing on the AltX increased the likelihood of improvements in quoted SMEs’ B-BBEE performance scores. Equally, the implementation of good governance systems like the B-BBEE by listed firms made them more attractive to stakeholders like the government via preferential procurement and contracts to compliant firms. This way, erstwhile neglected segments of the population can contribute towards the economic emancipation of the country, as evidenced by higher GDP levels. Conversely, it also has an undesirable effect on their value-added, patents and trademarks about the overall company performance. Consequently, the number of firm suspensions from the JSE’s AltX was positively and significantly related to the B-BBEE score of registered SMEs in South Africa (coeff. = 14.61, p < 0.05). This is probably because the ownership rights, management control, skills development levels, enterprise, supplier, and socio-economic development might be negatively impacted when inexperienced shareholders or employees are made to manage areas where they lack the requisite skill sets to do so. Expectedly, the R-squared value of 94.84 percent suggests a positive relationship between the dependent variable and the independent variables. This implies that the variation in the B-BBEE score of listed firms on the JSE’s AltX can be jointly explained by independent variables, which is strengthened by a reduced log-likelihood value of −88.20 indicating that the overall model is significant. Thus, the F-statistic of 18.38 demonstrates that there exist statistically significant relationships (p < 0.001) since the variables in the model exhibit a high predictability level. We, therefore, conclude that Hypothesis 1c, i.e., the B-BBEE score positively impacts the performance of listed firms on the JSE’s AltX, all things being equal.
In Model 4 of Table , the regression analysis of Hypothesis 2a reveals that a greater number of the JSE’s AltX-listed companies has a positive effect on SME performance in South Africa (Cheyne, Citation2016; Heerden, Citation2015). Congruently, its R-squared value of 98.76 percent suggests a positive relationship between the dependent variable and the independent variables, while the log-likelihood of −39.2762 indicates the robustness of our model. Besides, the EBITDA had a positive and significant relationship with the number of AltX companies in South Africa (coeff. = 20.35, p < 0.01). Similarly, we observed a positive and significant relationship between the number of SMEs in South Africa and the number of AltX companies in the country (coeff. = 9.77, p < 0.01), with a unit rise in listing having a direct relationship with the number of SMEs impacting it up to approximately 10 times. Nevertheless, higher poverty levels (coeff. = −4.80, p < 0.05), and unemployment rate (coeff. = −7.74, p < 0.01) had a negative and significant effect on the number of AltX companies (Sy, Citation2014). We deduced that higher levels of production, share price, and AltX liquidity levels, as well as increased firm visibility, and the number of tradable goods and services would lead to improved revenue for listed firms and would trigger an upward GDP growth rate, all things being equal (The Economist, Citation2010; Egu, Citation2022; Global Entrepreneurship Monitor, Citation2018). Likewise, since bankers and investors are interested in investing in highly profitable transactions, increased interest rates would probably lead to greater exposure to credit opportunities, which would ultimately enable SMEs to have access to more capital for expansion (World Economic Forum, Citation2016). Intriguingly, the F-statistic of 26.47 demonstrates that there exist statistically significant relationships (p < 0.001) since the variables in the model exhibit a high predictability level. We, therefore, conclude that Hypothesis 2a, i.e., the number of AltX companies has a positive effect on SME performance, ceteris paribus.
As stated earlier when a small company lists on the AltX it metamorphoses into a large firm thereby causing a reduction in the number of SMEs in South Africa. Although this phenomenon is greatly responsible for the anticipated growth in this sector of the economy, it does not occur in isolation (Global Entrepreneurship Monitor, Citation2018). Other factors that are exogenous to the firm could also influence the growth trajectory or otherwise of small businesses. The monetary and fiscal policy of the government, for example, could help sway the economy in various directions (Diffen, Citation2018). In this study, we find that small firms react negatively to increased levels of inflation, probably due to a lack of planning and the inability to hedge against unforeseen risks like rising prices of production inputs, foreign exchange, prices, goods, and services. Similarly, the poverty rate in South Africa has a negative correlation with the number of registered SMEs in the country, which reinvigorates the need for B-BBEE compliance (Bhorat, Citation2015). This is because inequality and exclusion reduce the per capita income of the country, and also disenfranchise a considerable chunk of the society from earning income, saving as well as being credit-worthy (Ighobor, Citation2017; Sy, Citation2014). Consequently, without income, the poor inhabitants of the country would not be able to create entrepreneurial ventures that can aid business growth. And if at all they can, poor people can run only necessity-driven businesses. Therefore, the unemployment rate is also negatively related to the number of listed SMEs on the JSE’s AltX in South Africa. Therefore, we can conclude that the higher the number of listed SMEs, the higher the likelihood of lower unemployment in South Africa, and vice versa.
EBITDA serves as a well-recognized metric for evaluating a company’s fundamental profitability, with its significance acknowledged by investors, regulatory bodies, lenders, and other stakeholders. Since it isolates cash profits generated by a company’s operations, excluding non-cash expenses like depreciation and amortization, as well as taxes and financing costs tied to the capital structure, this metric allows a more direct assessment of a company’s profitability, independent of financing choices, tax strategies, and non-essential depreciation schedules. Therefore, EBITDA proves to be a valuable gauge of corporate performance, guiding sellers, lenders, and investors in their evaluation of leveraged growth strategies used for debt management and profit reinvestment to minimize tax burdens. EBITDA’s widespread adoption as a valuation measure is well-founded, as it eliminates extraneous accounting elements, focuses on core business performance, and provides an estimate of a company’s cash flow. This informs its use as an important valuation and performance metric in this study. In Model 5, Table , the results of the OLS regression tests for Hypothesis 2b are tabulated. We find that the EBITDA of listed firms on the JSE’s AltX has a net positive impact (coeff. = 1.29, p < 0.05) on the GDP at current US dollar market prices in South Africa (Global Entrepreneurship Monitor, Citation2018; World Economic Forum, Citation2017). Furthermore, we observe a positive and significant correlation between the unemployment rate and the EBITDA of AltX companies (coeff. = 0.30, p < 0.05). More so, the inflation rate (coeff. = −0.20, p < 0.05), and the number of SMEs (coeff. = −0.38, p < 0.01) were negatively and significantly associated with the EBITDA of AltX companies in South Africa.
Expectedly, the GDP growth level was directly proportional to the EBITDA of AltX companies. This trend requires that more small businesses be supported in their quest to gain significant exposure and capital via a transparent listing process on the lower bourse. Also, the high inflation rate in South Africa is symptomatic and weighs down on the performance of listed firms’ core corporate profitability, especially when foreign investors plan to repatriate profits. Consequently, high prices of goods and services unswervingly translate to higher (artificial) costs and more expensive loan repayments, and also reduce the purchasing power of consumers, as well as cause economic growth to slow down (Sy, Citation2014). Besides, listing SMEs can turn them into larger companies which inadvertently crowds smaller firms out of the marketplace, ceteris paribus. Notably, the model’s R-squared value of 99.76 percent suggests a positive relationship between the dependent variable and the independent variables, while the log-likelihood of 21.88 indicates its robustness. Equally, the F-statistic of 94.52 establishes that there exist statistically significant relationships (p < 0.01) since the variables in the model exhibit high predictability. We, therefore, conclude that Hypothesis 2b, i.e., EBITDA of listed firms on the JSE’s AltX has a positive impact on the performance of SMEs in South Africa, ceteris paribus.
Like many African countries, the poverty level in South Africa is high. However, since this trend is characterized by lower wages (which is evidenced by reoccurring and persistent labor strikes for higher wages), it creates opportunities for capitalist forces to exploit this gap and reap abnormal profits that contribute to GDP growth levels (The Economist, Citation2010). Hence, rising poverty levels amplify the GDP growth levels, but over time result in social upheavals and inspire calls for income redistribution and equality. As we previously mentioned the more the number of listed companies on the JSE’s AltX the higher the GDP of South Africa. In the same vein, more SMEs would accelerate the GDP growth rate of South Africa. Thus, this study contributes to the existing literature by empirically providing that higher compliance levels, as exemplified by higher B-BBEE score ratings of registered firms can assist in turning the rising tide of inequality, as evidenced by an inverse relationship between poverty levels and the number of JSE’s AltX listed companies in South Africa (Table , Model 4). That said, we must add that Africa’s growth rate has been largely regarded as jobless growth since it does not translate to higher employment levels (Bhorat, Citation2015; Ighobor, Citation2017). This is consistent with the findings of similar studies (Bhorat, Citation2015; The Economist, Citation2010; Ighobor, Citation2017; Sy, Citation2014). Despite sub-Saharan Africa having the highest GDP growth rate in the world, many Africans are out of work. For every three persons in South Africa, one person is out of work (The Economist, Citation2010). This contrasts with what is prevalent in developed countries with low GDP growth rates but with high employment rates. Noticeably, the intensive mechanization of the extractive sectors of the economy and that of the agricultural sector are to blame for this anomaly. We predict that the mining sector, agricultural sector, and manufacturing sector would assist in addressing this problem.
To reinforce the veracity of our findings, we also conducted a Granger causality test to check the effect of spurious correlations (see Table ). We observed the presence of bi-directional causality in four (4) variable interactions. Firstly, we uncovered that delisting Granger causes the B-BBEE (composite) score of listed firms on the AltX to change (F-ratio = 8.99, p < 0.01), and vice versa (F-ratio = 9.34, p < 0.01). Secondly, it was clear that the GDP at current US prices Granger caused the B-BBEE (composite) score of listed firms on the AltX to change (F-ratio = 7.99, p < 0.01), and vice versa (F-ratio = 4.70, p < 0.05). Thirdly, the exchange rate Granger causes delisting to occur on the lower bourse (F-ratio = 4.08, p < 0.05), and vice versa (F-ratio = 6.92, p < 0.01). Fourthly, the unemployment rate Granger causes the GDP at current US prices to change on the junior exchange (F-ratio = 7.70, p < 0.01), and vice versa (F-ratio = 6.34, p < 0.05). Whereas, thirty-six (36) variable combinations exhibited a uni-directional causality, out of which the following four (4) variables indicated a significance level of p < 0.001: the number of JSE’s AltX companies Granger cause the inflation rate to change (F-ratio = 24.37); the GDP at current US prices Granger cause delisting to occur on the lower bourse (F-ratio = 14.52); the number of new listings Granger cause the interest rate to change (F-ratio = 21.32), and; the number of new listings Granger cause unemployment rate to change (F-ratio = 17.80). More so, twelve (12) variables indicated a significance level of p < 0.01: the number of JSE’s AltX companies Granger cause unemployment rate to change (F-ratio = 10.62); the AltX market capitalization Granger cause the revenue of listed SMEs to change (F-ratio = 10.80); the AltX market capitalization Granger cause reverse listings from the JSE main board (F-ratio = 7.65); the TEA rate Granger cause the B-BBEE score to change (F-ratio = 12.97); revenue Granger cause delisting (F-ratio = 12.47); reverse listings from the JSE main board Granger cause delisting (F-ratio = 8.20); the GDP at current US dollar prices Granger cause economic freedom levels to change (F-ratio = 7.18); the TEA rate Granger cause the rate of economic freedom to change (F-ratio = 8.23); the number of new listings Granger cause inflation rate to change (F-ratio = 7.39); inflation rate Granger cause poverty levels to change (F-ratio = 8.72); interest rate Granger cause poverty levels to change (F-ratio = 8.95), and; the unemployment rate Granger cause transfers to JSE main board (F-ratio = 8.59).
Table 3. Granger causality tests for the group output tabulation
In addition, twenty variables exhibited a uni-directional causality at the 5 percent level (p < 0.05): We observed that the level of economic freedom Granger cause the AltX market capitalization to change (F-ratio = 4.38); the education level Granger cause the AltX market capitalization (F-ratio = 6.27), as well as the firm delisting level to change (F-ratio = 4.09); the AltX market capitalization Granger cause the inflation rate (F-ratio = 4.87), interest rate (F-ratio = 6.50), and level of poverty to change in South Africa (F-ratio = 5.43); whereas, revenue Granger cause the B-BBEE score (F-ratio = 6.63) and the TEA rate to change (F-ratio = 5.55); also, it was observed that the number of firm suspensions Granger cause the number of delisting to change (F-ratio = 6.16); moreover, we find that the interest rate Granger cause the EBITDA (F-ratio = 4.24) and education level to change (F-ratio = 4.46); however, the TEA rate Granger cause the education level to change (F-ratio = 6.49); the exchange rate Granger cause revenue levels to change (F-ratio = 4.54); just as the number of new listings Granger cause the GDP levels at current US dollar market prices (F-ratio = 6.19), as well as cause the poverty levels to change (F-ratio = 5.48); similarly, the GDP at current US dollar prices Granger cause revenue to change (F-ratio = 4.66); while, the inflation rate Granger cause the interest rate to change (F-ratio = 4.68); and the unemployment rate Granger cause the interest rate (F-ratio = 5.11), poverty levels (F-ratio = 4.53), as well as the number of SMEs to change in South Africa (F-ratio = 4.57).
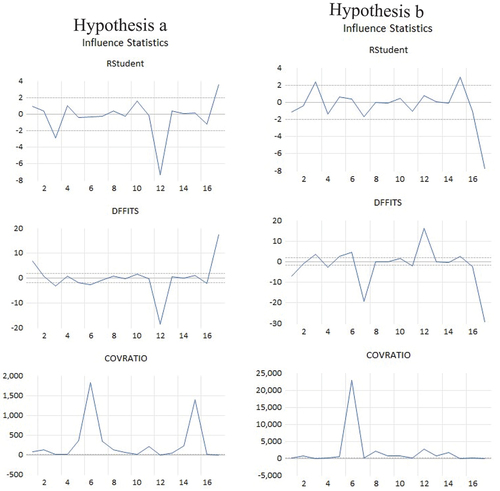
In summary, given that the official exchange rate of South Africa is measured by the average LCU per US $, it is not unexpected that it is negatively associated with the GDP at the current US dollar prices. Noticeably, the South African rand has depreciated from about 7.76 rands per dollar in 2008 to about 14.45 per dollar in 2019—which is approximately a 100 percent decline (Egu, Citation2022). Analogously, the real bank lending rate’s negative correlation with the GDP at the current US prices might be a result of banks not being interested in offering low-interest rates to their customers, inadvertently leading to firm delisting. Contemporaneously, this leads to lower levels of investment, and liquidity, as well as lower levels of entrepreneurial activities in the country (Herrington et al., Citation2016). Although not reported in this study, when we regressed the GDP at current US prices with relevant macroeconomic variables, we find that better performance of the JSE’s AltX listed companies likely yields a proportionate growth in the GDP of South Africa (p < 0.01). Additionally, we carried out stability diagnostics which graphically illustrated the influence statistics of the study. We observed that exogenous variables such as political instability, health risks as evidenced by the Ebola epidemic and the coronavirus (i.e., COVID-19) pandemic, as well as global economic instability and wars like the Ukraine war caused distortions in the trend series. Consequently, as emphasized in Hypothesis 1 (Figure ) and Hypothesis 2 (Figure ) outliers were observed almost every two (2) years due to the extraneous effect of the influence of significant outliers in our observation. This is a practical demonstration of circumstantial evidence of events that occurred during this period, culminating in the successful hosting of the FIFA World Cup, and eight unsuccessful attempts to impeach President Jacob Zuma.
Figure 2. Influence statistics of hypothesis 1.
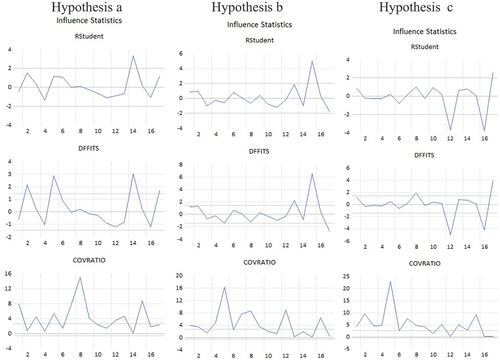
Figure 3. Influence statistics of hypothesis 2.
11. Discussion and conclusions
In this study, we were able to advance entrepreneurship and SME financing literature by integrating both the practical realities impacting the JSE’s AltX listed firm’s performance and the relevant theoretical bases for such occurrence. By demonstrating empirically that the impact of firm listing on the JSE’s AltX is positively associated with improved SME performance, and that the more inspiring these companies’ performances, the more likely there is a proportionate growth of South Africa’s GDP, we adeptly built on existing knowledge in this area of study. In contrast, the greater number of the JSE’s AltX-listed companies will not likely result in a higher level of comparable growth in the number of SMEs in the country, if these firms do not gather sufficient capital financing to expand their revenue base exponentially. Our findings make an important contribution to entrepreneurship research by identifying that apart from endogenous variables, exogenous variables could alter the direction of these firms either positively or negatively. This is because most of these firms utilize both POT and TOT to determine their WACC combination levels. Several noteworthy implications emerge from our findings.
First, and foremost, we established that new alternative capital sources have significant effects on both the capital supply side and the capital demand side of a firm’s capital financing requirements (JSE, Citation2016; World Economic Forum, Citation2016). And that the JSE’s AltX has proven beyond reasonable doubt that it is the future of capital financing for both entrepreneurs and SMEs in South Africa. Importantly, we can demonstrate that like the London Stock Exchange’s AIM that have successfully assisted about 3,600 companies from about 100 countries to raise £100 billion of development capital, the JSE’s AltX could be scaled up analogously to spur national economic growth (London Stock Exchange, Citation2018). The rising growth momentum on the lower bourse therefore validates companies’ and investors’ long-term confidence in the market (Miller & Kim, Citation2017).
Also, the implementation of good governance systems by listed firms makes them attractive to the entire business ecosystem (i.e. investors and shareholders, clients, partners, suppliers, lenders, industry players, employees, the government, and regulators, as well as the community). Improved incentive structures and remuneration that are implemented by registered firms further motivate talented personnel to work for and be attracted to these companies, thereby increasing their productivity levels (Heerden, Citation2015). Besides, we observed that a low staff churn rate assisted in the retention of quality human capital, which is the key to the future sustainability of these firms (Cheyne, Citation2016). We have also discerned that the opportunity offered to employees, business associates, and institutional investors in the equity and future growth of AltX-listed firms, goes a long way to motivating and uplifting the confidence level of all stakeholders, which emphasizes the significance of corporate sustainability programs such as the B-BBEE (JSE, Citation2016).
Secondly, although the positive growth of the GDP at the current US dollar market price in South Africa was critically desirable, it also raises pertinent issues for both entrepreneurship scholars and the SME literature itself. We uncovered that higher levels of economic freedom, educational levels, inflation, poverty levels, TEA rate, and unemployment rate cause the numbers of SMEs to decline. This is because a freer economy would reduce the entry and exit barriers for larger and more globalized companies to trade in the country (Miller & Kim, Citation2017), consequently causing SMEs to either shrink in size or close shop due to intense competition. Similarly, higher educational levels would divert graduates to the formal sectors of the economy where they can secure lucrative jobs. Thus, in the process reducing the number of entrepreneurs willing to kick-start a SME. That said, we also observed that higher levels of inflation, poverty levels, and unemployment rates cause the number of SMEs in South Africa to wither in size due to the lack of income, savings, and the lack of collateralized capital financing to start up a business (Herrington et al., Citation2016). Likewise, higher TEA levels as evidenced in Africa, and South Africa in particular, crowd-outs new and existing businesses in the creative gale of destruction (Global Entrepreneurship Monitor, Citation2018). Consequently, only innovative firms can survive such competition in this scenario, while conservative firms fail in this milieu of business immersion.
Nevertheless, higher levels of GDP at the current US dollar market price in South Africa were positively associated with the levels of economic freedom, educational level, inflation rate, poverty levels, the number of SMEs, TEA rate, and unemployment rates in South Africa. It has been empirically proven that big businesses like multinational enterprises (MNEs) thrive in freer economies where the level of education and prosperity is high (Miller & Kim, Citation2017). This precondition triggers such firms to profitably exploit the available resources, which are mostly in their natural state in both developing and under-developed countries with little control and regulation from the government (World Economic Forum, Citation2017). These firms are so big that they can even sack governments or capture them for the sole purpose of making financial gain. Although not all large firms are bad, the majority of them wield enormous political and financial power, and influence, especially in poor countries (Herrington et al., Citation2016). This eventually results in the phenomenon that is known as “jobless growth”.
Rapid economic growth represented by the proxy of GDP at the current US dollar market price is prevalent but increased mechanization of high employment sectors like mining and agriculture leads to downsizing, rightsizing, and the problem of the “working poor” (Sy, Citation2014). Policymakers should therefore wittingly consider the fact that over-regulation could also cause apathy, xenophobic tendencies, and voluntary exit from the country, thus further worsening the current unemployment rate, which is about 25 percent of the population (The Economist, Citation2010). Skewed endowment patterns in the country might also result in human capital imbalance, financial capital, and ownership limitations for various racial divisions. Skills acquisition and innovation, therefore, are critical in harnessing the potential of SMEs in the quest to reduce the level of inequality in the country where the Gini coefficient is about 63.4 percent (Bhorat, Citation2015). We must add that the government needs to enlighten the populace about the fact that resource control does not emancipate people, but viable businesses do. At the moment, South Africa’s jobless youth cast a shadow over burgeoning economic growth. It is propelling unemployed segments of this population to join rebel movements and radical militant groups, thus adding social and political ramifications to this problem (Ighobor, Citation2017). More so, as identified in the previous section, higher inflation rates and upward-moving TEA rates impact the number of SMEs in the country, consequently leading to higher GDP growth percentages in the long run.
We recommend that based on the underwritten viability of potential listings on the JSE’s AltX the DSBD should categorize such candidate firms, and write off their listing fees, as well as other associated costs in the interim for intending small businesses that are willing to register on the lower bourse (Herrington et al., Citation2016). However, the DSBD should insert a proviso that stipulates that when these firms grow, mature, and become profitable, government taxes should be charged back as a percentage of their profits to cater to the DSBD support. This is because we observed in our findings that when we add tax in our econometric estimation, the GDP at the current US dollar market price becomes positive, while the unemployment rate then becomes positively associated with the number of SMEs—due to the higher costs for tax payment obligations and liabilities that are linked with their meager income (World Economic Forum, Citation2017). To test the robustness of our study variables and econometric models, we reverse-coded our estimation. The market capitalization of the JSE’s AltX listed firms had a lesser amount of significance on the independent variables of our econometric estimation indicating that listing impacts more significantly on firm performance. This high-level performance is tantamount to the level of corporate governance standard that is being implemented exchange-wide.
In this study, we used aggregate datasets from the JSE’s AltX, the WDI, and other relevant databases. Due to the nature of our econometric data, sector-by-sector comparison would have helped to unravel in more detail the impact of firm listing on various sectors of the economy. However, the time frame for completing this study did not permit us to carry out a more advanced and analytical estimation procedure. We, therefore, recommend further studies in this area, since it will clarify the theoretical and empirical ambiguity which are necessary to establish the generalisability and robustness of our findings. Moreover, no comparison was made between the number of SMEs and the number of MNEs in our estimation of their performance and the GDP at the current US dollar market price of South Africa. Overall, this anomaly did not impede our econometric estimation, because the findings of this study were robust and generalizable, and led to valid conclusions.
This study therefore significantly contributes to the body of knowledge by empirically establishing that AltX market capitalization, the revenue of JSE’s AltX-listed firms, and the B-BBEE Score positively influence SME performance within the unique AltX ecosystem in South Africa. It further reveals that the number of AltX companies and EBITDA have a positive impact on SME performance. These findings offer valuable insights for academicians, enabling a more comprehensive understanding of SME performance dynamics within the AltX, and for practitioners, providing guidance on enhancing profitability and strategic decision-making. However, it’s important to acknowledge the limitations of this research, including the specific focus on South Africa’s AltX and the absence of consideration for global market influences. Future research endeavors should explore cross-border comparisons, encompassing a broader spectrum of emerging markets and alternative exchanges, to gain a more nuanced understanding of SME performance determinants in diverse financial ecosystems. This would further enrich our comprehension of the global financial landscape and contribute to the formulation of more effective and context-specific policy measures, enhancing the sustainability and growth of SMEs. Besides, as a potential avenue for future research, it would be intriguing to explore whether the Corporate Social Responsibility (CSR) orientation of Chief Executive Officers (CEOs) in various companies could positively impact the performance of SMEs (González-Moreno et al., Citation2019; Ruiz-Palomino et al., Citation2015). Over and beyond, future research opportunities should investigate the potential benefits of SMEs being included in ethical indexes as indicated in some notable literature sources.
Acknowledgments
The authors thank the three anonymous reviewers for their invaluable insights, as well as Charlie Flores for his research and administrative assistance. Secondly, the authors acknowledge both the moral and financial support of the College of Graduate Studies, University of South Africa, Pretoria, South Africa. In addition, the authors would like to thank the Johannesburg Stock Exchange (JSE) for assisting us with all the relevant data for this study. We however expressly state that the views (i.e. opinions) and findings of this study are those of the authors and, hence do not represent those of any organization or institution. And therefore, cannot be legally binding or have a material effect on either the principal or financiers of this study. All errors are our own.
Disclosure statement
No potential conflict of interest was reported by the author(s).
Additional information
Notes on contributors

Mathew E. Egu
Mathew E. Egu (Ph.D., University of South Africa) is a Professor of Business Administration and Finance at the Global Humanistic University, Anguilla, and he is also a Lecturer and DBL Supervisor at the Federal Polytechnic Idah, Kogi State, Nigeria, and the Graduate School of Business Leadership (SBL), University of South Africa, Midrand, South Africa, respectively. Furthermore, he is the managing editor of the Journal of Management and Technology. He holds the Chartered Institute for Business Accountants’ (formerly SAIBA) Certified Financial Officer - CFO (SA) highest designation and has served meritoriously as an ESG Committee member. He is currently a visiting professor at the Financial University under the Government of the Russian Federation, Moscow, Russia. His research focuses on international business, entrepreneurship, entrepreneurial financing, strategy, and small business development.
References
- Adair, P., Adaskou, M., & McMillan, D. (2015). Trade-off-theory vs. pecking order theory and the determinants of corporate leverage: Evidence from a panel data analysis upon French SMEs (2002–2010). Cogent Economics & Finance, 3(1), 1–35. https://doi.org/10.1080/23322039.2015.1006477
- Amorós, J. E., & Bosma, N. (2014). Global Entrepreneurship Monitor 2013 global report. Fifteen years of assessing entrepreneurship across the globe. Global Entrepreneurship Monitor (GEM). Global Entrepreneurship Research Association. Babson College.
- Bayar, Y., Kaya, A., & Yildirim, M. (2014). Effects of stock market development on economic growth: Evidence from Turkey. International Journal of Financial Research, 5(1), 93–100. https://doi.org/10.5430/ijfr.v5n1p93
- B-BBEE Amendment Act 2013. (2014, January 27). The Broad-based black economic Empowerment (B-BBEE) Amendment Act, no. 46 of 2013. Government Gazette, The Republic of South Africa. https://www.gov.za/sites/default/files/gcis_document/201409/37271act46of2013.pdf
- Bhorat, H. (2015, September 30). Is South Africa the most unequal society in the world? Mail & Guardian Online. https://mg.co.za/article/2015-09-30-is-south-africa-the-most-unequal-society-in-the-world
- Casser, G., & Holmes, S. (2003). Capital structure and financing of SMEs: Australian evidence. Accounting & Finance, 43(2), 123–147. https://doi.org/10.1111/1467-629X.t01-1-00085
- Chaithanapat, P., Punnakitikashem, P., Khin, K. O., Nay, C., & Rakthin, S. (2022). Relationships among knowledge-oriented leadership, customer knowledge management, innovation quality and firm performance in SMEs. Journal of Innovation & Knowledge, 7(1), 100162. https://doi.org/10.1016/j.jik.2022.100162
- Chen, M., Wang, H., Liang, Y., & Zhang, G. (2023). Net and configurational effects of determinants on cloud computing adoption by SMEs under cloud promotion policy using PLS-SEM and fsQCA. Journal of Innovation & Knowledge, 8(3), 100388. https://doi.org/10.1016/j.jik.2023.100388
- Cheyne, N. (2016, May 9). AltX gives business tools to grow. Business Day Live. http://www.bdlive.co.za/opinion/2016/01/08/altx-gives-business-tools-to-grow
- Deakins, D., & Freel, M. (2012). Entrepreneurship and small firms (6th ed.). McGraw-Hill Education.
- The Department of Trade, Industry and Competition [the dtic]. (2015, May 6). Amended Broad-based black economic Empowerment codes of good practice. The Department of Trade, Industry and Competition. http://www.thedtic.gov.za/wp-content/uploads/BEE38766.pdf
- Diffen. (2018, April, 3). Fiscal policy vs. monetary policy. Diffen. https://www.diffen.com/difference/Fiscal_Policy_vs_Monetary_Policy
- Dunn, S. C., Seaker, R. F., & Waller, M. A. (1994). Latent variables in business logistics research: Scale development and validation. Journal of Business Logistics, 15(2), 145–172.
- The Economist. (2010, June 5). Jobless growth: The economy is doing nicely—but at least one person in three is out of work. The Economist. https://www.economist.com/node/16248641
- Egu, M. E. (2014). The strategic importance of regional economic integration to multinational companies (MNCs): A study of South African MNCs’ operations in the SADC [ Master’s dissertation]. University of South Africa Pretoria, Unisa Institutional Repository. https://uir.unisa.ac.za/bitstream/handle/10500/14149/dissertation_egu_me.pdf?sequence=1&isAllowed=y
- Egu, M. E. (2022). The impact of the Johannesburg Stock Exchange’s Alternative Exchange on listed firm’s performance and entrepreneurship [ Doctoral thesis]. University of South Africa Pretoria, Unisa Institutional Repository. https://uir.unisa.ac.za/bitstream/handle/10500/28839/thesis_egu_me.pdf?sequence=1&isAllowed=y
- Egu, E. M., & Aregbeshola, R. A. (2017). The odyssey of South African multinational corporations (MNCs) and their impact on the Southern African development community (SADC). African Journal of Business Management, 11(23), 686–703. https://doi.org/10.5897/AJBM2017.7742
- Egu, M. E., Chiloane-Tsoka, E., & Dhlamini, S. (2016, August 19). South African entrepreneurial chasms and its determinant outcome. A paper presented at the Academy of International Business (AIB) Sub-Saharan chapter conference, hosted by Lagos Business School (LBS), Lagos, Nigeria. Pan-Atlantic University.
- Egu, M. E., Chiloane-Tsoka, E., & Dhlamini, S. (2017, July 3). African entrepreneurial viewpoints versus macroeconomic outcomes. A paper presented at the Academy of International Business (AIB) annual conference, in Dubai, UAE.
- EViews. (2022, September, 9). Stability Diagnostics. EViews. http://www.eviews.com/help/helpintro.html#page/content/testing-Stability_Diagnostics.html
- Ghosh, A. N., & Karmakar, A. (2014). Analytical issues in trade, development and finance: Essays in honor of Biswajit Chatterjee. India studies in business and economics. Springer India.
- Global Entrepreneurship Monitor. (2018). Global report 2017/18. Global Entrepreneurship Monitor (GEM). The Global Entrepreneurship Research Association (GERA).
- Gold Brands Investments. (2016). Integrated annual report. Gold Brands Investments Ltd.
- González-Moreno, A., Ruiz-Palomino, P., & Sáez-Martínez, F. J. (2019). Can CEOs’ Corporate Social Responsibility Orientation Improve Firms’ Cooperation in International Scenarios? Sustainability, 11(24), 6936. https://doi.org/10.3390/su11246936
- Gregory, B. T., Rutherford, M. W., Oswald, S., & Gardiner, L. (2005). An empirical investigation of the growth cycle theory of small firm financing. Journal of Small Business Management, 43(4), 382–392. https://doi.org/10.1111/j.1540-627X.2005.00143.x
- Harvey, F. N. (2016). The long-term performance of failed Initial Public Offerings (IPOs) on the Johannesburg Stock Exchange (JSE) [ Master’s dissertation]. University of the Free State Bloemfontein, UFS.UV KovsieScholar Repository. https://scholar.ufs.ac.za/bitstream/handle/11660/4030/HarveyFN.pdf?sequence=1&isAllowed=y
- Hatemi, J. A. (2008). Tests for cointegration with two unknown regime shifts with an application to financial market integration. Empirical Economics, 35(3), 497–505. https://doi.org/10.1007/s00181-007-0175-9
- Heerden, C. (2015). Is the AltX doing what it is supposed to do? An Analysis of the JSE Alternative Exchange [ Master’s dissertation]. University of Stellenbosch Business School Stellenbosch, SunScholar.
- Herrington, M., & Kelly, D. (2012). African entrepreneurship: Sub-saharan African regional report. Global entrepreneurship monitor South Africa 2012 report. University of Cape Town Graduate School of Business.
- Herrington, M., Kew, J., & Kew, P. (2014). 2014 GEM South Africa report. South Africa: The crossroads – a goldmine or a time bomb? Development Unit for New Enterprise (DUNE). Global Entrepreneurship Monitor (GEM).
- Herrington, M., Kew, J., & Mwanga, A. (2016). South Africa report 2016/2017. Can small businesses survive in South Africa? Global Entrepreneurship Monitor (GEM)
- Hilmersson, F. P., & Hilmersson, M. (2021). Networking to accelerate the pace of SME innovations. Journal of Innovation & Knowledge, 6(1), 43–49. https://doi.org/10.1016/j.jik.2020.10.001
- Hind, C. 2018. Organizational practices and individual innovation behavior: A non-linear approach to modeling the emergence of Corporate Entrepreneurship [ Doctoral thesis]. University of Cape Town Cape Town, OpenUCT. https://open.uct.ac.za/bitstreams/4cca4a1a-23bb-471d-8a6e-b3a120f83d1f/download
- Hind, C., & Steyn, R. (2015). Corporate entrepreneurship - distilling the concept. The Southern African Journal of Entrepreneurship and Small Business Management (SAJESBM), 7(1), 69–87. https://doi.org/10.4102/sajesbm.v7i1.7
- Ighobor, K. (2017, April, 3). Africa’s jobless youth cast a shadow over economic growth: Leaders put job-creation programs on the front burner. Africa renewal online. United Nations Africa Renewal. https://www.un.org/africarenewal/magazine/special-edition-youth-2017/africas-jobless-youth-cast-shadow-over-economic-growth
- JSE. (2016, September, 9). The JSE is driven for the growth of your business. Listing process. Listing on the JSE. Johannesburg Stock Exchange. https://www.jse.co.za/listing-process/listing-on-the-jse
- Karmaker, C. L., Al Aziz, R., Palit, T., & Bari, A. M. (2023). Analyzing supply chain risk factors in the small and medium enterprises under fuzzy environment: Implications towards sustainability for emerging economies. Sustainable Technology and Entrepreneurship, 2(1), 100032. https://doi.org/10.1016/j.stae.2022.100032
- Kim, T., & Heshmati, A. (2014). Economic growth: The new perspectives for theory and policy. Springer-Verlag.
- London Stock Exchange. (2018, March 4). AIM. http://www.londonstockexchange.com/companies-and-advisors/aim/aim/aim.htm
- López-Gracia, J., & Sogorb-Mira, F. (2008). Testing trade-off and pecking order theories financing SMEs. Small Business Economics, 31(2), 117–136. https://doi.org/10.1007/s11187-007-9088-4
- Lucky, E. O., & Olusegun, A. I. (2012). Is small and medium enterprise (SMEs) an entrepreneurship? The International Journal of Academic Research in Business & Social Sciences, 2(1), 341–352.
- Mashaba, T. (2014). The IPO performance of companies listed on the JSE alternative exchange [ Master’s dissertation]. University of Witwatersrand Witwatersrand, Wits WIReDSpace. https://wiredspace.wits.ac.za/bitstreams/545f23f2-1eb8-466a-b330-f7380c733dd0/download
- Matemilola, B. T., & Bany-Ariffin, A. N. (2011). Pecking order theory of capital structure: Empirical evidence from dynamic panel data. International Journal on GSTF Business Review, 1(1), 185–189.
- Miller, T., & Kim, A. B. (2017). 2017 index of economic freedom. Institute of Economic Freedom. The Heritage Foundation.
- Mlonzi, V., Kruger, J. W., & Nthoesane, M. G. (2010, October 7). Share price reaction to earnings announcement on the JSE-ALTX. A paper presented at the International Conference on Leadership and Management for Sustainable Development, hosted by Unisa Graduate School of Business Leadership (SBL), Midrand, South Africa. University of South Africa.
- Mmako, N. M. (2021). The role of the JSE AltX as a platform for sustainability and growth for high growth potential SMEs [ Doctoral thesis]. University of South Africa Pretoria, Unisa Institutional Repository. https://uir.unisa.ac.za/bitstream/handle/10500/28040/thesis_mmako_nm%20%28002%29.pdf?sequence=1&isAllowed=y
- Modigliani, F., & Miller, M. H. (1958). The cost of capital, corporation finance, and the theory of investment. American Economic Review, 48, 433–443.
- Modigliani, F., & Miller, M. H. (1963). Corporate income taxes and the cost of capital: A correction. American Economic Review, 53, 261–297.
- Moneyweb. (2015, September 13). AltX is gaining momentum/Donna Oosthuyse – head of Capital Markets, JSE. Moneyweb. http://www.moneyweb.co.za/uncategorized/altx-is-gaining-momentum-donna-oosthuyse-head-of/
- Murphy, J. P., Liao, J., & Welsch, P. H. (2006). A conceptual history of entrepreneurial thought. Journal of Management History, 12(1), 9–24. https://doi.org/10.1108/13552520610638256
- Myers, S. C., & Majluf, N. S. (1984). Corporate financing and investment decisions when firms have information that investors do not have. Journal of Financial Economics, 13(2), 187–221. https://doi.org/10.1016/0304-405X(84)90023-0
- Naidoo, K. K. (2006). The strategic processes of small businesses operating in a turbulent environment: A retail community pharmacy perspective [ Doctoral thesis]. University of South Africa Pretoria, Unisa Institutional Repository. https://uir.unisa.ac.za/bitstream/handle/10500/2379/thesis.pdf?sequence=1&isAllowed=y
- Nunnally, J. C. (1978). Psychometric theory. McGraw-Hill.
- Ortigueira-Sánchez, L. C., Welsh, D. H., & Stein, W. C. (2022). Innovation drivers for export performance. Sustainable Technology and Entrepreneurship, 1(2), 100013. https://doi.org/10.1016/j.stae.2022.100013
- Peters, R., & Naicker, V. (2013). Small medium micro enterprise business goals and government support: A South African case study. South African Journal of Business Management, 44(4), 13–24. https://doi.org/10.4102/sajbm.v44i4.165
- Ruiz-Palomino, P., Del Pozo-Rubio, R., & Martínez-Cañas, R. (2015). Risk and return characteristics of environmentally and socially responsible firms in Spain during a financial Downturn: 2008–2011. South African Journal of Business Management, 46(2), 65–76. https://doi.org/10.4102/sajbm.v46i2.92
- Schumpeter, J. A. (2013). Capitalism, socialism and democracy. Routledge.
- Stefanelli, V., Ferilli, G. B., & Boscia, V. (2022). Exploring the lending business crowdfunding to support SMEs’ financing decisions. Journal of Innovation & Knowledge, 7(4), 100278. https://doi.org/10.1016/j.jik.2022.100278
- Sy, A. (2014, January 30). Jobless growth in sub-saharan Africa. Africa in focus. The Brookings Institution. https://www.brookings.edu/blog/africa-in-focus/2014/01/30/jobless-growth-in-sub-saharan-africa/
- Tarver, E. (2022, December 4). Does the tradeoff model or the pecking order play a greater role in capital budgeting?. Investopedia Academy. https://www.investopedia.com/ask/answers/052215/does-tradeoff-model-or-pecking-order-play-greater-role-capital-budgeting.asp
- Theunissen, M. (2012). An application of data envelopment analysis to benchmark CEO remuneration [ Master’s dissertation]. North-West University Potchefstroom, NWU Boloka Institutional Repository. https://repository.nwu.ac.za/bitstream/handle/10394/9845/theunissen_m.pdf?sequence=1
- Tsele, L. (2016, April 14). Listing on the JSE as an expansion strategy for your business - everything you need to know. SME South Africa. http://www.smesouthafrica.co.za/16499/Could-listing-on-the-JSE-be-the-expansion-strategy-you-need/
- United Nations. (2016) . World economic Situation and prospects 2016. The United Nations.
- Woodward, W. A., Gray, H. L., & Elliott, A. C. (2012). Applied time series analysis. CRC Press.
- Wooldridge, J. M. (2013). Introductory econometrics: A modern approach (5th International ed.). Cengage Learning.
- World Economic Forum. (2016) . Alternative Investments 2020: The future of capital for entrepreneurs and SMEs.
- World Economic Forum. (2017). The global competitiveness report 2017-2018.
1.Appendix
Figure A1. Leverage plots of AltX_MarketCap vs. hypothesis 1a variable.
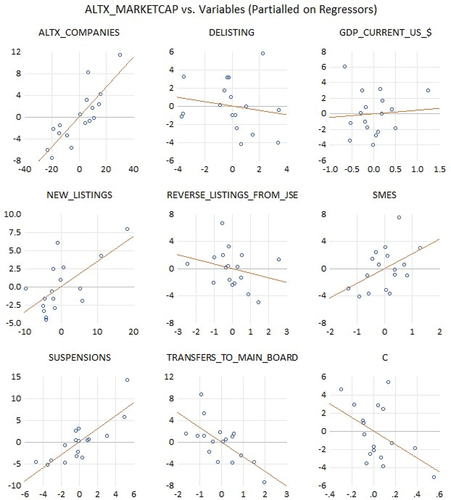
Figure A2. Leverage plots of revenue vs. hypothesis 1b variable.
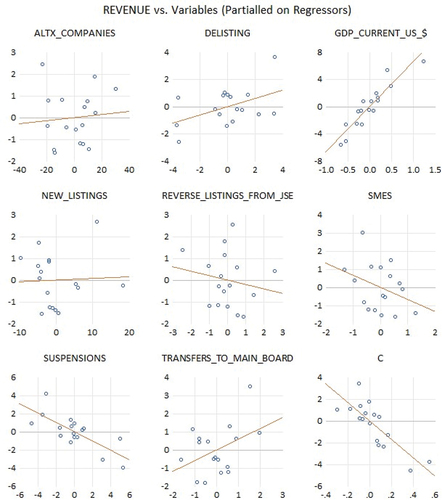
Figure A3. Leverage plots of B_BBEE_Score vs. hypothesis 1c variables.
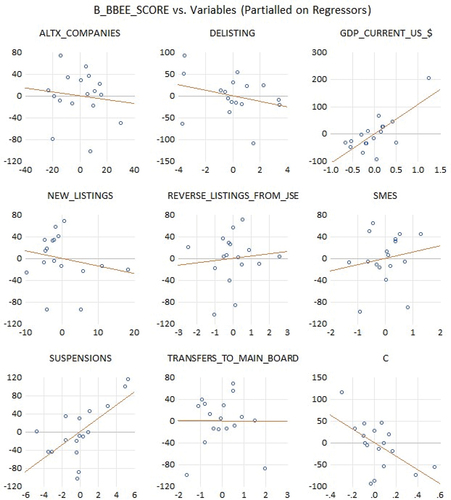
Figure A4. Leverage plots of AltX_Companies vs. hypothesis 2a variables.
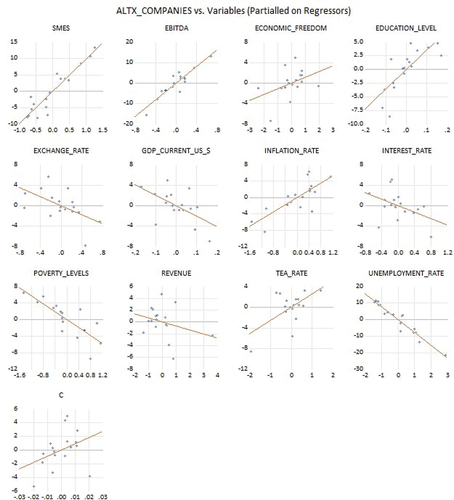
Figure A5. Leverage plots of EBITDA vs. hypothesis 2b variables.
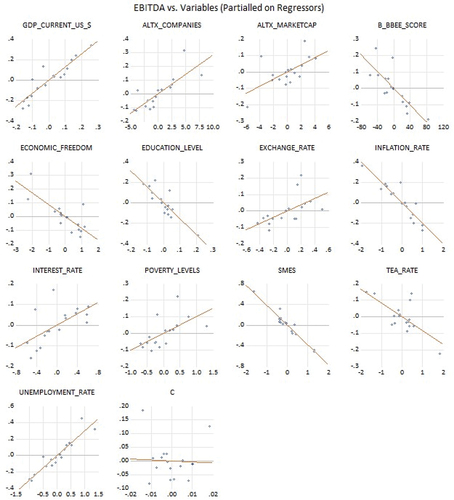
Figure A6. Multiple series stacked graph for hypothesis 1a.
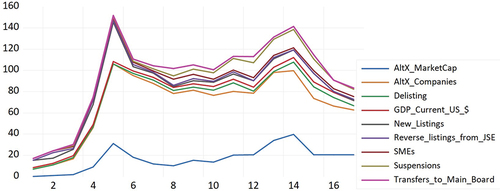
Figure A7. Forecast for hypothesis 1a.
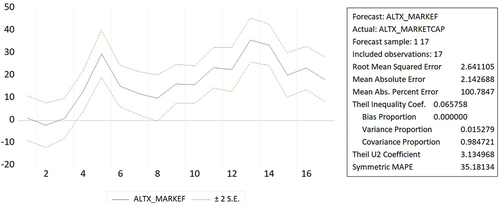
Figure A8. Multiple series stacked graph for hypothesis 1b.
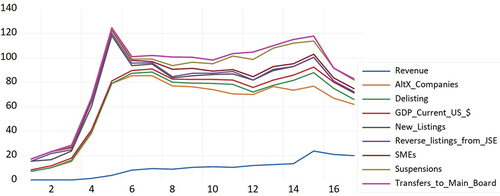
Figure A9. Forecast for hypothesis 1b.
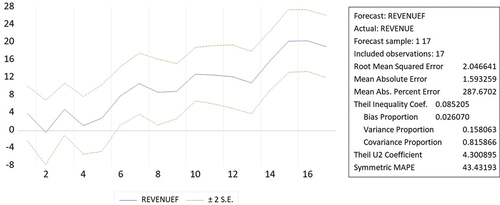
Figure A10. Multiple series stacked graph for hypothesis 1c.
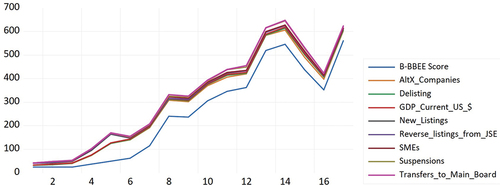
Figure A11. Forecast for hypothesis 1c.
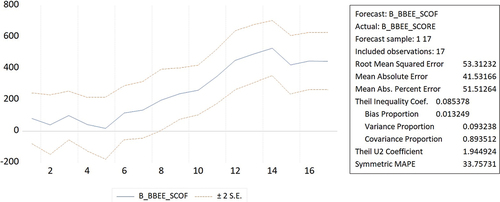
Figure A12. Multiple series stacked graph for hypothesis 2a.
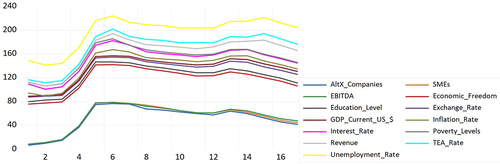
Figure A13. Forecast for hypothesis 2a.
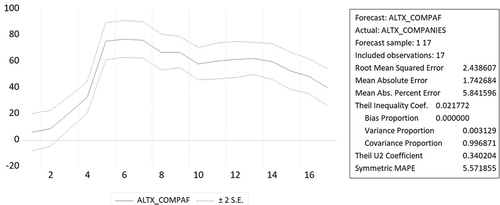
Figure A14. Multiple series stacked graph for hypothesis 2b.
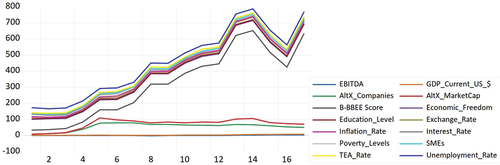
Figure A15. Forecast for hypothesis 2b.