
 ?Mathematical formulae have been encoded as MathML and are displayed in this HTML version using MathJax in order to improve their display. Uncheck the box to turn MathJax off. This feature requires Javascript. Click on a formula to zoom.
Abstract
This study examines the association between a firm’s fundamental factors and stock returns as well as how investor sentiment influences the association between these variables. The fundamental factors analyzed include accounting variables (earnings yields, change in profitability, and capital investment) and earnings quality measures. Investor sentiment is measured using the South African consumer confidence index. A sample of 1 386 firm-year observations from the companies listed on the Johannesburg Stock Exchange (JSE) between 1990 and 2022 was used. The results show that fundamental factors are related to stock returns, except for measures of earnings quality. Although earnings yields and capital investments cause variation in stock returns, their effects on stock returns are influenced by other variables associated with stock returns. In addition, investor sentiment affects the relationship between fundamental factors and stock returns, suggesting that sentiment influences the outcome of the capital market and the way investors process fundamental information. Profitability seems to be more related to stock returns than other fundamental variables. This study sheds light on how sentiment interacts with a set of fundamental factors and their sensitivity to stock returns and highlights the important role of investor sentiment and accounting information in the capital market.
1. Introduction and background
Traditional finance theory assumes that the capital market is efficient, as such investors are rational and use the information available in the market to make resource allocation decisions. However, behavioral finance theory posits that investors’ psychological states (investor sentiment) influence their investment decisions. Consequently, the movement of stock prices is not only affected by a firm’s specific information (fundamental information) and market wide information but also by investor sentiment. Investor sentiment is described as investors’ expectations regarding the return and risk related to investment (Haritha & Rishad, Citation2020) and/or investors’ psychological state of mind (optimism or pessimism), which guide their investment decisions (Park, Citation2015). Investor sentiment may, therefore, be understood as the movement of security prices not affected by fundamental information. Since the emergence of behavioral theory, researchers have investigated the association between investor sentiment and outcomes of the capital market, such as share prices and stock returns, and found mixed and inconclusive results.
In one hand some studies (Chen, Citation2008; Haritha & Rishad, Citation2020; Seok et al., Citation2019) report a positive association between these variables. In other words, these studies revealed that when investors are optimistic, their sentiment is high, which leads to an increase in share prices. On the other hand, other studies (Baker et al., Citation2007) report a negative association between share prices and investor sentiment. These authors argue that the relationship between sentiment and share prices/returns is conditioned by the type of stock or the firm’s characteristics.
Since both firm-specific information and investor sentiment may affect stock prices, only a few studies (Mian & Sankaraguruswamy, Citation2012) have attempted to link investor sentiment to firm- specific information and share prices. For instance, Mian and Sankaraguruswamy (Citation2012) find that investor sentiment has direct and indirect impacts on share prices sensitivity to earnings news.
Information about a firm’s earnings may affect investor sentiment (Seok et al., Citation2019). In addition, firms that exceed analysts’ earnings forecasts experience a sudden increase in stock prices (Chan et al., Citation2007); for such firms, investors are optimistic; which may in turn influence their decisions. In contrast, firms that fall short of analysts’ earnings forecasts experience a decrease in stock price (Chan et al., Citation2007), which leads to investor pessimism. Therefore, the relationship between firm’s specific information and stock returns may be conditioned by investor optimism or pessimism state of mind.
This study extends previous work by first examining the relationship between firms’ fundamental factors and stock returns. Thereafter, we examine whether investor sentiment affects the relationship between firm fundamental information and stock returns in South Africa, using JSE data. We describe fundamental information as variables related to a firm’s specific information that may lead to changes in stock prices, including accounting variables and earnings quality measures.
The accounting variables used are earnings yield, change in profitability, and capital investment. These variables are associated with stock returns (Chen & Zhang, Citation2007). Chen and Zhang (Citation2007), argue that earnings yields, change in profitability, and capital investment are related to the expected future cash flow of a firm and are, therefore correlated with stock returns.
We also use earnings quality measures as a proxy for a firm’s fundamental information because earnings quality is a good measure of a firm’s performance (Dechow et al., Citation2010; Fonou-Dombeu et al., Citation2022). Investors use it to forecast future cash flows, which subsequently affect stock returns. The measure of earnings quality used in this study is accrual quality. We specifically focus on accrual quality for to the following reasons. First, accrual is a good measure of earnings quality and predict earnings better than to other measures of earnings quality (Chan et al., Citation2007; Perotti & Wagenhofer, Citation2014).
Second, accrual is the “primary mechanism through which accountants seek to make financial statements useful” (Larson et al., Citation2018).
Finally, the association between accruals and stock returns have provided mixed results. Sloan (Citation1996) found that firms with low accruals have higher subsequent stock returns. Chan et al. (Citation2007) also documented that accruals are negatively related to future stock returns. This negative association is explained by the fact that accruals are susceptible to manipulation, and a high accrual could signify low earnings quality, which subsequently leads to low returns. However, Hirsleifer et al. (Citation2009) find a positive association between accruals and stock returns. This suggests that the relationship between accruals and stock returns are not yet conclusive, and the outcome may depend on the characteristics of the firms or the capital market in which the firm operates. In addition, prior studies that linked accruals to stock returns emphasized that accruals reflect managers’ manipulation of earnings, this is more observed for firms with high accruals (Chan et al., Citation2007; Dechow et al., Citation2010). The relationship between accruals and stock returns may differ in South Africa’s capital market. In fact, Fonou-Dombeu et al. (Citation2023) showed that the listed firms in South Africa display a low level of accruals, which is an indication of high earnings quality. Therefore, the question is: if earnings is of higher quality in South Africa’s listed firms, does earnings quality lead to an increase in stock returns in South Africa?
Furthermore, we link investor sentiment to the relationship between firm fundamental information (accounting variables and measures of earnings quality) and stock returns because prior studies found that accounting variables may cause variations in stock prices (Chen & Zhang, Citation2007), and that investor behavior may also affect stock prices/returns (Baker & Wurgler, Citation2006; Xavier & Machado, Citation2017). Thus, investor sentiment may play a role in the accounting variable-stock return relationship. Therefore, the questions are as follows: How does sentiment influence the association between accounting variables and stock returns? Do accounting variables and sentiment jointly influence stock returns?
We also conjecture that sentiment may influence the relationship between the measure of earnings quality and stock returns since Chen (Citation2008) reported that uncertainty influences investor judgement. In fact, the measure of earnings quality may be used as a proxy for information uncertainty because it reflects a firm’s true operational activities (Dechow et al., Citation2010; Fonou-Dombeu et al., Citation2023) and firms with high earnings quality are less volatile than firms with low earnings quality (Fonou-Dombeu et al., Citation2022; Rajgopal & Venkatachalam, Citation2011). Corollary, firms with high earnings quality will have a stable future cash flow compared to firms with low earnings quality. Investors will be optimistic about firms with high earnings quality as it will be easier to forecast the future cash flow of these firms. Thus, investor sentiment may influence the relationship between earnings quality and stock returns. Therefore, the questions are: how does investor sentiment affect the association between earnings quality measure and stock returns? Do sentiment and earnings quality measure jointly influence stock returns?
Furthermore, since the emergence of behavioral finance, investor sentiment has been widely studied in the literature, especially in developed nations, where such studies are in advanced stages (Haritha & Rishad, Citation2020). However, in developing nations, studies on investor sentiment are at an early stage (Haritha & Rishad, Citation2020). Specifically, in South Africa, there is a scarcity of studies that have attempted to link sentiment with firm fundamental information. Only a few South African studies on investor sentiment (Dalika & Seetharam, Citation2015; Muguto et al., Citation2022; Rupande et al., Citation2019), have focused on the effect of sentiment on share prices and/or stock returns. Specifically, these studies sought to examine the effect of sentiment at the market level and not at the firm’s level.
This study contributes to the literature by shedding light on how a set of fundamental factors influences stock returns in JSE-listed companies. The use of the full set of firms’ fundamental information in this study provides comprehensive and diverse information about stock returns that is concealed when one uses a single variable, accounting variables, or measure of earnings quality separately. The findings also shed light on which factor contributes more or has greater explanatory power for the change in stock returns in South Africa’s capital market. In addition, this study answers the question of whether the relationship between a firm’s fundamental information and stock returns depends on investor behavior.
2. Literature review
It is well documented in the literature that changes in securities prices are influenced by market information, firm information, and investor sentiment. In the past, investors’ rationalism was considered the only explanation for the change in share price. Investors’ decisions are based on the available information in the market. This belief is strongly supported by traditional finance theory, which assumes market efficiency and investors’ rationality. However, recent behavioral finance theory argues that investors are not always rational. Their subjective beliefs and psychological states of mind also influence the movement of share prices. The psychological state of mind, optimism, or pessimism, of investors is measured by investor sentiment. De Long et al. (Citation1990) demonstrate how irrational traders influence the financial markets.
Several studies have investigated whether investors’ psychological state of mind is related to stock returns (Baker & Wurgler, Citation2006; Brown & Cliff, Citation2005; Chen, Citation2008; Gao & Yang, Citation2017; Haritha & Rishad, Citation2020).
Baker and Wurgler (Citation2006) find that investor sentiment is inversely associated with stock return. The authors report that investor sentiment is low for firms with low profitability, high earnings volatility, non-paying dividends, and young and mature firms. For these firms, the subsequent returns will be high. In addition, Baker and Wurgler (Citation2006) argue that if it is difficult to determine a firm’s value, investors will be pessimistic, and hence, their sentiment will be low. The share price of such firms is high because of mispricing, which subsequently leads to low returns.
In an attempt to find what can reduce security mispricing due to investor sentiment, Cornell et al. (Citation2017) report that security mispricing is reduced for firms with high accounting information.
In addition, Cornell et al. (Citation2017) argue that investor sentiment has little impact on the share prices of firms that display higher accounting information. This is because, the share prices are incorrectly determined if the accounting information is of low quality. This mispricing leads to temporarily high returns. Therefore, the quality of a firm’s financial reports is an important factor in the capital market. Furthermore, the earnings figure is an item in the financial reports that is used as a primary measure of accounting information (Dechow et al., Citation2010). Before the emergence of behavioral finance, it was assumed that the market was efficient and that accounting information was the main yardstick used by investors to make decisions. Rational investors assumes that accounting information is fully reflected in securities prices (Mian & Sankaraguruswamy, Citation2012).
As many variables are used as proxies for accounting information, several studies (Chan et al., Citation2007; Chen & Zhang, Citation2007; Perotti & Wagenhofer, Citation2014; Shao et al., Citation2021) have examined how these variables influence stock prices. For instance, Chen and Zhang (Citation2007) reported that earnings, profitability, and capital investment are associated with stock returns while Chan et al. (Citation2007) found that earnings quality has great predictive power for stock returns. Another study by Rajgopal and Venkatachalam (Citation2011) report that deterioration of earnings quality is related to an increase in the volatility of stock returns. Similarly, Fonou-Dombeu et al. (Citation2022) find that measures of earnings quality are associated with a company’s performance and stock returns volatility.
In examining the effect of accruals on stock returns at the aggregate level, Hirsleifer et al. (Citation2009) reached different findings from those of previous studies. In fact, in contrast to the study by Chan et al. (Citation2007), which reported that accruals are negatively related to stock returns, Hirsleifer et al. (Citation2009) found that accruals are positively related to stock returns at the aggregate and sector levels. The results differed depending of the sector. These mixed results may imply that when it comes to examining the effect of accruals on stock returns, the results cannot be generalized because capital markets are different in terms of efficiency.
Furthermore, authors have linked investor sentiment to accounting information. In fact, Chen (Citation2008) reported that sentiment influence “investor judgement of future cash flow and their risk preference.” The author argues that some earnings components, such as capital expenditures, produce future cash flows with high or low levels of uncertainty. The study revealed that the effect of sentiment on investors’ judgement depends on the type of cash flow (cash flow with high uncertainty vs. cash flow with low uncertainty). In addition, the study finds that the effect of sentiment on expected cash flow is opposite to its effect on risk preference.
Miranda et al. (Citation2018) report that investor sentiment is negatively related to earnings management. The authors argue that this negative association could be attribute to financial analyst monitoring. Firms that are monitored by financial analysts have a lower propensity to manipulate financial reports than those that do not.
Mian and Sankaraguruswamy (Citation2012) examine whether investor sentiment influences stock prices reactions to accounting information measured by the earnings response coefficient. The study revealed that good news about a firm’s reported earnings is quickly incorporated into stock prices when investors are optimistic (high-sentiment period) than when they are pessimistic (low-sentiment period). The study concluded that investor optimism or pessimism states of mind contribute to security mispricing.
Another study by Seok et al. (Citation2019) linked investor sentiment to price sensitivity to earnings announcements and found that in a high-sentiment period, good news about a firm is fully reflected in stock prices. However, when investors are pessimistic (low-sentiment) about a specific firm, positive news announcements about that firm do not automatically change their perception or sentiment about that firm. However, negative news announcements lead to a sudden decrease in the share prices of such firms. This finding could suggest that only positive earnings news may change investors’ perceptions or judgement about a stock.
In light of the above, the literature is not conclusive about the effect of sentiment on a firm’s specific information and stock price/return relationship. Furthermore, none of the above studies have considered whether sentiment affects the relationship between a full set of accounting information (measured from the cash flow perspective) and stock returns.
3. Methodology
3.1. Sample and data
3.1.1. Sample
The initial sample comprised non-financial companies listed on the JSE. The sample period spans from 1990 to 2022. Therefore, non-financial companies not listed on the JSE over the sample period were excluded. In order to avoid deleting too many companies, we did not require all data for each company over the 32-year period. As long as a company was listed on JSE for the 32-year period, it was included in the sample. This resulted in a final sample consisting of 1 386 firm-year observations collected from 42 JSE-listed companies. Survivorship bias is unlikely to play a major role in the analysis since the data requirements constrain the sample to long live and stable companies.
3.1.2. Data
As discussed above, the data for this study were collected for 32-year period, from 1990 to 2022. The data are secondary in nature and were obtained from different sources. Data for computing accounting variables and earnings quality were extracted from the financial statements of the companies included in the sample. The financial statements of these companies were obtained from the IRSS Research Domain and analyzed to extract relevant data. Accounting data retrieved from the financial statements of sampled firms include revenues, property, plant and equipment, cash and cash equivalent, total assets, total equity, and total liabilities. Share price data employed to calculate stock returns were also obtained from the IRSS Research Domain.
The data for investor sentiment were collected from the Bureau of Economic Research website, whereas the data for other variables (macroeconomic variables) were sourced from the South Africa Reserve Bank (SARS) website.
Details regarding the variables and data sources, and variables description are provided in Appendix. A thorough explanation on how the main variables of the study are measured and computed is discussed in the section to follow.
3.2. Variables and measurements
The main variables in this study are firms’ fundamental factors, including accounting variables, measures of earnings quality, and investor sentiments. The measurements of these variables are presented below.
3.2.1. Accounting variables
The selection of accounting variables was guided by the literature. Based on Chen and Zhang (Citation2007), a number of accounting variables including earnings yield, change in profitability, and capital investment were adopted and used in this study. Chen and Zhang (Citation2007) reported that these variables are related to current and future cash flows. Therefore, they contribute to the creation of value for the firm and consequently influence stock returns. Chen and Zhang (Citation2007) further demonstrate that growth opportunities and discount rates are related to stock returns. However, these two variables (growth opportunity and discount rate) are not included in this study because they are associated with the risk and external environment of the firm. The focus of this study is not on risk preference but on internal factors linked to the accounting process that may affect the movement of the share price.
Like in Chen and Zhang (Citation2007), earnings yield is computed as earnings divided by book value of equity, change in profitability is proxied by the change in return on equity, return on equity is computed as earnings divided by book value of equity, and capital investment is the change in the book value of equity.
3.2.2. Measures of earnings quality
Accrual quality, specifically abnormal accrual, is used as a measure of earnings quality in this study.
According to Larson et al. (Citation2018) “accrual is the primary mechanism through which accountants seek to make the financial statements useful.” Accrual quality is documented as a good measure of earnings quality which is useful for determining a firm’s equity value (Chan et al., Citation2007; Perotti & Wagenhofer, Citation2014). In addition, Chan et al. (Citation2007) demonstrate that accruals predict earnings better than other measures of earnings quality. Accrual quality, specifically abnormal accrual, can also be used to gauge the quality of a firm’s reported earnings, which could reflect the true operational activity of the firm or an illustration of earnings manipulation. Abnormal accruals represent the proportion of accruals that are susceptible to earnings manipulation (Chan et al., Citation2007; Kang et al., Citation2010). A low level of abnormal accruals indicates that earnings are of higher quality (Dechow et al., Citation2010).
As in Fonou-Dombeu et al. (Citation2023) accrual quality for each firm is defined as the difference between a firm’s total and normal accruals, using EquationEq. (1)(1)
(1) .
(1)
(1)
where
is accrual quality,
total accrual scaled by
,
total assets, and
normal accrual.
are the firm and year, respectively.
and
were computed using EquationEqs. (2)
(2)
(2) and Equation(3)
(3)
(3) , respectively.
(2)
(2)
(3)
(3)
where
is the change in revenue,
is property, plant, and equipment and the remaining symbols are the same as in EquationEq. (1)
(1)
(1) .
As an alternative measure of earnings quality, this study also used a comprehensive measure of accrual (COMPAQ) developed by Larson et al. (Citation2018). Larson et al. (Citation2018) argued that the COMPAQ is an effective measure of accrual as compared to existing accrual models. Furthermore, the COMPAQ addresses some of the challenges identified in existing models (Larson et al., Citation2018). The COMPAQ is computed as the change in shareholders’ equity minus the change in cash and cash equivalents.
3.2.3. Measurement of investor sentiment
Investor sentiment is generally measured using either a survey-based or the market-based measures. Surveys-based measures include proxies such as the consumer confidence index, whereas market-based measures include a set of variables such as turnover, equity share ratio, dividend premium, and closed-end funds discount rate.
Each approach (survey or market-based) has advantages and disadvantages.
For instance, survey-based-measures have been criticized for not representing the exact and overall population because surveys are generally based on a limited sample size; surveys also suffer from interview and acquiescence biases (Mugoto et al., Citation2019; Baker & Wurgler, Citation2007). However, it has been argued that surveys are not dependent on complex financial theories and reflect the psychologic state of investors (Mugoto et al., Citation2019).
Similarly, market-based measures have limitations. They incorporated idiosyncratic noise. They are based on the estimation of a set of possible variables to measure sentiment, and there are disagreements and no clarity on which variables best measure sentiment.
Since investor sentiment is an abstract concept and there is no commonly agreed measure of sentiment in the literature (Dalika & Seetharam, Citation2015; Baker & Wurgler, Citation2006), we selected survey-based measures to proxy for investor sentiment in this study. This choice was guided by prior studies (Duong et al., Citation2017; Simpson, Citation2013; Wang, Citation2018) and was constrained by the availability of data. Specifically, the South African consumer confidence index, also called the First National Bank/Bureau for Economic Research Consumer Confidence Index (FNB/BER CCI), was used to measure investor sentiment in this study. The FNB/BER CCI data were collected from the Bureau for Economic Research (BER) website and are available on a quarterly basis. Because the other data were collected annually, to ensure that all the data had the same frequency, we computed the annual FNB/BER CCI. For each year, the FNB/BER CCI was computed by averaging the quarterly values. This procedure was also used by Simpson (Citation2013) and Duong et al. (Citation2017), who used monthly data to generate quarterly data by averaging monthly frequencies.
3.3. Regression models
To examine whether investor sentiment affects the relationship between fundamental information and stock returns, we first test the association between fundamental information (accounting variables and measure of earnings quality) and stock returns to provide up-to-date evidence of the effect of both accounting variables and the measure of earnings quality on stock returns. As explained earlier, the use of both accounting variables and earnings quality measures provides a compressive effect of fundamental information on stock returns, which can be concealed when using individual variables.
We then examine the role of investor sentiment in the relationship between fundamental information and stock returns.
3.3.1. Relation between firm’s fundamental information and stock return
The fundamental factors used in this study include a set of accounting variables and earnings quality measures.
3.3.1.1. Relation between accounting variables and stock return
To examine the relationship between accounting variables and stock returns, we use EquationEquation (4)(4)
(4) .
Our approach is based on the work of Chen and Zhang (Citation2007). Chen and Zhang (Citation2007) identify the following accounting variables that may be related to stock returns: earnings yields, profitability measured by return on equity, capital investment, growth opportunity and discount rate. Following Chen and Zhang (Citation2007), we estimate stock returns as a function of accounting variables (earnings yield, change in return on equity, and capital investment), as in EquationEq. (4)(4)
(4) . However, we did not include growth opportunity and discount rate in the model because these two variables are related to the firm’s external environment (Chen & Zhang, Citation2007).
(4)
(4)
where
is the annual stock returns;
earnings yield;
is the change in profitability, computed as the change in return on equity multiplied by the book value of equity;
is capital investment computed as the change in the book value of equity;
is the regression coefficient. All independent variables are scaled by the market value of equity.
We first estimate EquationEq. (4)(4)
(4) without control variables as in Chen and Zhang (Citation2007). Thereafter, we estimate EquationEq. (4)
(4)
(4) with control variables reported in previous studies, such as Dang et al. (Citation2017), to be predictors of stock returns. The control variables are firm size, leverage, and the market-to-book ratio. Firm size is computed as the logarithm of the market value of equity, leverage as debt divided by total equity and the market-to-book value as the book value of equity divided by the market value of equity.
3.3.1.2. Relation between measures of earnings quality and stock return
Furthermore, we consider earnings quality measures as another fundamental factor that may explain stock returns in South Africa. Specifically, accrual quality is used to measure earnings quality. EquationEquation (5)(5)
(5) is used to test the relationship between earnings quality measure and stock returns.
(5)
(5)
where MEQ is a measure of earnings quality and
are control variables, including firm size, leverage, and the market-to-book ratio. The remaining symbols are defined by EquationEq. (4)
(4)
(4) .
3.3.2. Investor sentiment and the relation between fundamental information and stock return
To test the role of investor sentiment in the relationship between fundamental information (accounting variables and measures of earnings quality) and stock returns, we estimate EquationEqs. (6)(6)
(6) and Equation(7)
(7)
(7) , respectively. If investor sentiment interplays on the association between fundamental factors and stock returns, it is expected that the coefficient
of the interaction of accounting variables and investors sentiment (ACCV*INS) in EquationEq. (6)
(6)
(6) and measures of earnings quality and investor sentiment (MEQ*INS) in EquationEq. (7)
(7)
(7) are statistically significant.
Since prior studies have reported that macroeconomic variables may be related to sentiment (Simpson, Citation2013) and stock returns (Benakovic & Posedel, Citation2010; Omotor, Citation2010), EquationEqs. (6)(6)
(6) and Equation(7)
(7)
(7) were estimated by adding macroeconomic variables, including inflation, GDP growth, and industrial production growth as in Simpson (Citation2013).
(6)
(6)
(7)
(7)
where
are accounting variables (earnings yields, profitability, or capital investment),
investor sentiment,
macroeconomic variables, including inflation, GDP growth, and industrial production growth, and the rest of the symbol, as in EquationEq. (5)
(5)
(5) .
3.4. Analysis methods
The data were processed using the Statistical Package for Social Science, version 29. Before analyzing the data, the following regression assumptions were tested: linearity, normality, autocorrelation, homoscedasticity, and multicollinearity. For each regression Equation, the assumptions were tested by looking at the histogram and P-P plots of the standardized residuals against the predicted value, scatterplot of the residuals, Durbin Watson test and variance inflation factor test. Additionally, the Glejser test was used to test for homoscedasticity.
The regression equations were estimated using multilevel regression. However, when the assumption of homoscedasticity is violated, the estimation is conducted using a Generalized Linear model with robust estimation, which is an estimation technique that is appropriate in cases where the assumption of homoscedasticity is not met (Astivia & Zumbo, Citation2019). For regression EquationEq. (7)(7)
(7) , the assumption of multicollinearity was violated because of the high correlation between investor sentiment (INVS) and the interaction variables (ACCV*INVS, and MEQ*INVS). To address this issue, a generalized linear model with generalized estimated equation (GEE) was employed. The GEE model is appropriate for correlated observations (IBM Corp, Citation2019). To further control for the high correlation, EquationEq. (7)
(7)
(7) was estimated without one of the correlated variables, specifically INVS, to confirm the GEE results.
4. Empirical results and discussion
4.1. Descriptive statistics and correlation results
presents the descriptive statistics of the variables used in the regression equations. As shown in , the stock return (RETU) has a minimum value of −0.999 and a maximum value of 11, 527. This indicates a significant difference in the returns of the sample firms’ observations, with a mean (standard deviation) of 0.296 (1.257). The mean (standard deviation) for the accounting variables are as follows: earnings yields, 0.004 (0.0105); the change in profitability, 0.0001 (0.005) and capital investment, 0.0015 (0.007). These results are dissimilar to that of the study by Chen and Zhang (Citation2007) who reported a mean (standard deviation) of 0.06 (0.08), −0.0155 (14.53) and 0.13 (0.27), for earnings yields, change in profitability and capital investment, respectively. These discrepancies could be attributed to the sample size and differences in capital markets. In fact, the study by Chen and Zhang (Citation2007) was conducted in the United States based on data for a large and developed market compared to the South African capital market.
Table 1. Descriptive statistics of the variables used in the study.
Looking at earnings quality measures in , the ACCRQ and COMPAQ have a mean (standard deviation) of −0.462 (0.107) and 0.15 (0.204), respectively.
Larson et al. (Citation2018) also reported a positive mean for the COMAQ. The mean for the ACCRQ is negative and the mean for the COMPAQ is close to zero. This could indicate that, on average, the cash flow component of earnings is high relative to earnings for the JSE firms sampled. In fact, earnings is a combination of accrual and cash flow, and a high positive accrual indicates that earnings is greater than cash flow (Chan et al., Citation2007).
With regard to the descriptive statistics for investor sentiment (INS), measured by the consumer confidence index (CCI). As shown in , the INS value ranges from −19.250 to 21; with a mean (standard deviation) of −0.439 (10.191). The trend in investor sentiment over the sample period, is displayed in .
Figure 1. Annual investor sentiment proxied by CCI index.
Source: Authors’ computation.
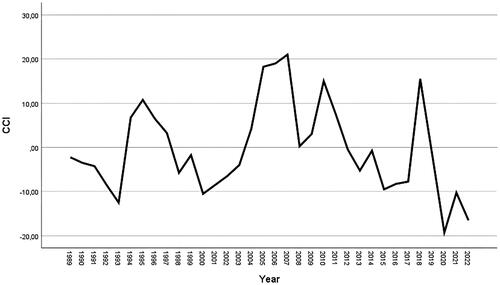
As depicted in , the CCI varies from a trough level of −19.250 in 2020 to a peak level of 21 in 2007. It is interesting to note that the CCI displays a highly pessimistic trend in 2020, illustrating a low sentiment period, which is consistent with the market conditions during the pandemic year. In fact, a negative or low sentiment score indicates a period of low sentiment, whereas a high score indicates a period of high sentiment or optimism.
shows the bivariate Pearson correlations between the main study variables. As shows, stock returns (RETU) are positively correlated with the three accounting variables (earnings yield, change in profitability, and capital investment) with correlations coefficients of 0.112, 0.115, and 0.096, respectively. These correlations are significant at the 0.01 level. Among the accounting variables, change in profitability (CPROFI) appears to be the most correlated with stock returns. The positive and significant correlations between stock returns and accounting variables indicate a direct relationship between these variables.
Table 2. Correlation results.
The correlations between stock returns and measures of earnings quality (ACCR and COMPAQ) are insignificant, indicating no relationship between these variables.
Finally, stock returns are negatively correlated with investor sentiment, with a correlation coefficient of −0.089.
4.2. Regression results
In this section, we first test the association between stock returns and firms’ fundamental information. Thereafter, we examine whether investor sentiment influences the association between these variables.
4.2.1. Regression results of firm’s fundamental information and stock return
4.2.1.1. Accounting variables on stock return
presents the results of estimating EquationEq. (4)(4)
(4) , which examines the association between accounting variables and stock returns.
Table 3. Regression results: stock return and accounting variables.
Column 1 of reports the results of estimating EquationEq. (4)(4)
(4) without control variables and column 2 displays the results with control variables.
Column 1 of shows that the estimated coefficients of earnings yields (EARY) and change in profitability (CPROFI) are significantly positive. The estimated coefficient of capital investment (CAPI) is also positive but insignificant. This suggests that, among the accounting variables used in this study, only earnings yield and changes in profitability are associated with future stock returns. It is interesting to note that the coefficient of change in profitability is 6.139, and that of earnings yields is 2.101. This means that profitability has a greater impact on stock returns than earnings yields.
These results of EquationEq. (4)(4)
(4) agree with those of Chen and Zhang (Citation2007). However, unlike Chen and Zhang (Citation2007), who report a positive and statistically significant association between capital investment and stock returns, our results show no significant association between these variables.
The control variables reported in the literature to be related to stock returns, including firm size, leverage, and the market-to-book ratio, were added to EquationEq. (4)(4)
(4) , and the results are displayed in Column 2 of . The inclusion of control variables in EquationEq. (4)
(4)
(4) did not change the results for changes in profitability and capital investment, which are still statistically significant and non-significant, respectively, related to stock returns. This suggests that the association between accounting variables, specifically profitability and capital investment is unlikely to be caused or influenced by the firm size, degree of leverage or the market-to-book ratio.
However, Column 2 of reveals that the inclusion of control variables in the model has changed the results for earnings yields, which now has a coefficient that is statistically insignificant. This could indicate that earnings yields have little impact on stock returns and that their association with the latter is influenced by the control variables.
This finding is in agreement with Ang and Bekaert (Citation2006), who found that earnings yields are not a good predictor of future stock returns; rather they are good predictor of cash flow. This finding is further supported by Alduais (Citation2020) and Lev (Citation1989), who argue that earnings have become a weak predictor of stock returns compared to other accounting variables.
4.2.1.2. Measures of earnings quality on stock return
The results of EquationEq. (5)(5)
(5) , which estimates the relationship between measures of earnings quality and stock returns, are provided in . Two proxies of accrual quality were used as measures of earnings quality: the ACCRQ and the COMPAQ. Columns 1 and 2 of presents the results of estimating EquationEquation (5)
(5)
(5) using the ACCRQ and the COMPAQ, respectively. Specifically, Columns 1.1 and 2.1 display the results without control variables whereas Columns 1.2 and 2.2 display the results with control variables.
Table 4. Regression results: Stock return and measures of earnings quality (ACCRQ and COMPAQ).
As shown in Columns 1.2 and 2.2 of , the estimated coefficients for ACCRQ and COMAQ are 0.024 and −0.081, respectively. For both earnings’ quality measures, the association is non-significant. This indicates that earnings quality proxied by accrual quality does not predict stock returns. As noted earlier in the descriptive statistics analysis in Section 4.1, the earnings of the sampled firms are of higher quality on average (this was indicated by the negative average value for the mean ACCRQ), which is an indication of low uncertainty. In fact, as pointed out by Chan et al. (Citation2007), a low accrual value means that earnings are of higher quality and, vice versa.
These results also indicate that, for stable stocks, that is, firms with high earnings quality, the accrual component of earnings does not predict stock returns.
In fact, earnings have two components: accruals and cash flow (Chan et al., Citation2007) and earnings are high relative to cash flow for firms with high accruals (Chan et al., Citation2007). Similarly, earnings are low relative to cash flow for firms with low accrual quality.
Based on the preceding argument, our results could indicate that for the firms sampled, the cash flow component of earnings is greater than the (abnormal) accruals components. This means that accrual quality is low for the firms included in our sample. These results are consistent with the descriptive statistics and correlation analyses discussed in section 4.1.
Of note, one of the measures of earnings quality used in this study, the ACCRQ, is a proxy for abnormal accruals, that is, the portion of accrual quality that is susceptible to manipulation. Therefore, the results presented above could further indicate that abnormal accruals are unrelated to stock returns. Further research could investigate whether the non-discretionary portion of accruals is associated with stock returns.
The results in are also in agreement with Hung and Van (Citation2020), who also reported a non-significant relationship between stock returns and accrual quality for small firms.
However, the results in disagree with Hirsleifer et al. (Citation2009), who find a significant positive relationship between accruals and stock returns. This dissimilitude in results may imply that when it comes to examining the effect of accruals on stock returns, the results cannot be generalized because capital markets differ in terms of efficiency and regulations. As such, for some stock markets, the cash flow component of earnings may be greater than the accrual component, and vice versa, which in turn may affect returns differently.
Taking the results of and together, it can be concluded that not all fundamental firms’ factors are associated with subsequent returns. In fact, a change in profitability predicts future stock returns, whereas capital investment and measures of earnings quality, proxied by accrual quality, are not related to changes in stock returns. Earnings yields may also lead to variations in stock returns, however their effect on stock returns is weak and influenced by other variables.
4.2.2. Regression results: investor sentiment and the relation between stock return and firm’s fundamental information
4.2.2.1. Role of investor sentiment on the relationship between accounting variables and stock return
EquationEquation (6)(6)
(6) tests whether investor sentiment influences the relationship between accounting variables and stock returns. Accounting variables, including earnings yields, change in profitability, and capital investment, were added individually to the model and the results are presented in , Column 1, 2, and 3, respectively. Particularly, Columns 1.1, 2.1 and 3.1 display the results without control variables while Columns 1.2, 2.2 and 3.2 present the results with control variables.
Table 5. Regression results: investor sentiment, accounting variables and stock return.
Our main interest in EquationEq. (6)(6)
(6) is the interaction term, that is accounting variable and investor sentiment (ACCV* INS). If investor sentiment affects the relationship between the accounting variables and stock returns, the coefficient of the interaction term must be statistically significant.
As illustrated in Columns 1.2, 2.2 and 3.2 of , the coefficients of the interaction, ACCV*INS, are −0.060, 0.215 and 0.347, and are significant for all accounting variables. The negative coefficient (−0.060) of the interaction term between earnings yields and investor sentiment indicates that the association between earnings yields and future stock returns is weak when sentiment decrease. The positive coefficients (0.215; 0.347) of the interaction terms between profitability and investor sentiment, and capital investment and investor sentiment, suggest that the association between these accounting variables and future stock returns is strong when sentiment decrease.
In addition, for each model (Columns 1.2, 2.2, and 3.2), the individual coefficients of each accounting variable and investor sentiment are significant. This means that accounting variables and investor sentiment are related to stock returns, and after adding the interaction term, the relationship remains significant, indicating that both accounting variables and investor sentiment affect stock returns. Moreover, investor sentiment influences the association between accounting variables and stock returns.
It is interesting to note that the coefficient of capital investment (CAPI) becomes significant when added alone to the model, although it is insignificant when the regression is estimated in EquationEq. (4)(4)
(4) with other accounting variables. This suggests that CAPI is related to stock returns but that the effect of CAPI on stock returns is cancelled out or influenced by other accounting variables.
It is further interesting to note that in Column 2, the sign of the interaction term of profitability and investor sentiment, ACCV*INS, is positive, indicating that the effect of profitability on stock returns dominates the effect of sentiment on stock returns, which means that profitability appears to be more related to stock returns than other accounting variables, which is consistent with the results of , where it was found that profitability explains the variation in stock returns more than other accounting variables. In addition, the effect of sentiment on stock return is greater than that of earnings yields. This is illustrated by the negative sign of the coefficient of ACC*INS, in Column 1 of .
Overall, these results reveal that both the accounting variables and investor sentiment influence stock returns. Additionally, investor sentiment affects the relationship between the accounting variables and stock returns. This could indicate that although firms’ specific information is incorporated into stock prices (Mian & Sankaraguruswamy, Citation2012), investors pay attention to accounting information, and their sentiment influences the way they process information.
4.2.2.2. Role of investor sentiment on the relationship between measures of earnings quality and stock return
displays the findings from the estimation of EquationEq. (7)(7)
(7) , which tests the effect of investor sentiment on the association between measures of earnings quality and stock returns. EquationEquation (7)
(7)
(7) is estimated with and without control variables and the results are reported in Columns 1 and 2, respectively.
Table 6. Regression results: investor sentiment, measures of earnings quality (ACCRQ & COMPAQ) and stock return.
Panel A of reports the results of estimating EquationEq. (7)(7)
(7) using ACCRQ as a measure of earnings quality. As shown in Panel A of , the coefficient for ACCRQ is positive and non-significant, the coefficient for INS is negative and significant, and the coefficient of the interaction between accrual quality and investor sentiment, ACCRQ*INS, is also negative and significant. It is interesting to note that, although the coefficient for ACCRQ is insignificant, the coefficient of the interaction term, ACCRQ*INS, is significant. This suggests that investor sentiment has a strong effect on stock returns and plays a role in the association between ACCRQ and stock returns. Additionally, since the sign of the coefficient of the interaction term, ACCRQ*INS, is negative, similar to the coefficient of INS, the results further confirm the strong and dominating effect of sentiment on stock returns. This could mean that investors’ psychological state of mines has become a better predictor of stock returns than fundamental information (earnings quality) in South African JSE-listed firms.
As noted in section 4.1, on average earnings of the sampled firms are of higher quality. The significant and negative coefficient of ACCQ*INS could further indicate that when sentiment increase, subsequent stock returns decrease for firms with high earnings quality. Therefore, the results in Panel A of suggest that the quality of a firm’s reported earnings matters for investors and is important in the capital market. This is consistent with Perotti and Wagenhofer (Citation2014), who reported that earnings quality provides useful information to investors for investment decisions and that security mispricing is reduced for firms with higher earnings quality.
It is a highly possible that investors pay less attention to accounting information when earnings is of lower quality. Therefore, further research could investigate whether the results of this study would have been different if earnings of the sampled firms were of lower quality, as well as whether the results would have been different in low-versus high-sentiment periods.
As shown in Panel B of , when the COMPAQ is used as a measure of earnings quality, the results are similar to those in Panel A. That is, the COMPAQ is not related to stock returns, INS is negatively associated with stock returns, and the interaction term COMAQ*INS is negatively related to stock returns.
Overall, these results suggest that although a firm’s fundamental factors drive stock returns movement, investors behavior appears to be one of the main catalysts of change in stock returns because sentiment influences the way investors process fundamental information.
As explained in Section 3, macroeconomic variables, including the consumer price index (CPI), GDP growth (GDPG), and industrial production growth (IPG), which are possibly correlated with investor sentiment and stock returns were included in regression EquationEqs. (6)(6)
(6) and Equation(7)
(7)
(7) . Columns 1, 2 and 3 of , and Panels A and B in shows that, these variables are related to stock returns. Specifically, in all models, CPI and IPG are negatively related to stock returns, whereas GDPG is positively related to stock returns. This is in agreement with prior studies by Reddy (Citation2012), Omotor (Citation2010), and Benakovic and Posedel (Citation2010), who find that macroeconomic variables are associated with stock returns.
For both EquationEqs. (6)(6)
(6) and Equation(7)
(7)
(7) , the regressions were estimated without control variables, and the findings were almost similar to the estimation with the control variables. This indicates that the inclusion of control variables into the regression EquationEqs. (6)
(6)
(6) and Equation(7)
(7)
(7) , does not affect the role of investor sentiment on the relationship between fundamental factors and stock returns.
5. Conclusion
This study examines the association between a firm’s fundamental factors and stock returns in the South African capital market. The fundamental factors analyzed include accounting variables (earnings yields, change in profitability, and capital investment) and earnings quality measures (accrual quality).
Because a firm’s fundamental factors and investor sentiment may affect stock returns, this study further examines whether sentiment affects the association between a firm’s fundamental factors and stock returns. Following prior studies, investor sentiment is proxied by the FNB/BER consumer confidence index, which is a survey-based measure of sentiment.
Using a sample of firms listed on the JSE from 1990 to 2022, we find that fundamental factors influence stock returns. Specifically, among the fundamental factors studied, the change in profitability predicts best stock returns compared to other variables. We also find that earnings yields and capital investment cause changes in stock returns, however, their effect on stock returns are weak and influenced by other variables.
In addition, the findings reveal that the earnings quality measures are unrelated to stock returns. One of the measures of earnings quality analyzed is a proxy for abnormal accruals. The results indicate that abnormal accruals are unrelated to variations in stock returns. Could other earnings components, such as non-discretionary accruals or cash flows be related to stock returns in SA? We leave this to future investigations.
Examining the role of investor sentiment in the relationship between fundamental factors and stock returns, we find that investor sentiment influences the relationship between accounting variables and stock returns. This specifically indicates that, although accounting variables are related to stock returns, the relationship is conditioned by investor behavior.
Moreover, the findings reveal that investor sentiment also affects the link between measures of earnings quality and stock returns since the coefficient of the interaction term of measures of earnings quality and investor sentiment is statistically significant. In addition, the earnings quality of the firms included in the study is of higher quality, and the association between the measures of earnings quality and stock return is non-significant. The significance of the coefficient of the interaction term between sentiment and measures of earnings quality, suggests that investors pay attention to the quality of a firm’s reported earnings, and that sentiment has a strong effect on stock returns. Future studies may provide more insights by examining whether sentiment level (high sentiment level vs. low sentiment level) affects stock prices reactions to the quality of accounting information.
The overall findings of the study are consistent with the traditional finance literature and the behavioural literature that argue that accounting information and investor behavioural biases affect security prices. In fact, Prior studies reported that fundamental information is associated with stock returns. Prior studies also found that investor sentiment affect stock returns. Our study extends the literature by exploring whether investor sentiment influence the fundamental information and stock returns relation. The results suggest that the incorporation of firm’s fundamental information into stock price/returns may be influenced by investors behavioural bias. As such, the users of accounting information must pay attention to the market sentiment as the later influences the effect of accounting information on the outcomes of capital market. Therefore, this study highlights the important roles of both fundamental and behavioral factors in the financial market.
The findings of the study also have implications for accounting standards setters, as the quality of accounting information does matters to capital market participants such as investors, because sentiment may influence the way they process accounting information.
Authors’ contributions
The corresponding author N.C. Fonou-Dombeu did the data collection, conducted the experiments and written the article. The co-authors B. C. Nomlala and C.J. Nyide provided guidance in the design, structure of the manuscripts; they also provided insightful comments that help improve the quality of the manuscripts. All authors read and approved the final manuscripts.
Disclosure statement
The authors report there are no competing interests to declare.
Data availability
Data are available on request
Additional information
Funding
Notes on contributors

Nyanine Chuele Fonou-Dombeu
Nyanine Chuele Fonou-Dombeu is currently a lecturer at Durban University of Technology. She holds a PhD in Accounting from the University of KwaZulu Natal, South Africa, a Master and Honours degree (Accounting) from North-West University, South Africa and a BCom from the University of South Africa. Her research interest is in the areas of earnings quality, behavioral finance, fair value accounting and lean accounting.

Bomi Cyril Nomlala
Bomi Cyril Nomlala is an accomplished accounting scholar, researcher, and dedicated educator who brings a wealth of knowledge and experience to the field of accounting/auditing. With a passion for fostering the next generation of financial professionals, Prof. Bomi Nomlala has made significant contributions to academia, the research arena and the accounting industry.
Bomi Nomlala is a Professor in the School of Accounting, Economics, and Finance at the University of KwaZulu-Natal (UKZN). He received his Ph.D. in Accounting in 2019. He has over fifteen years of auditing/forensic education and public sector experience. He is a member of the Accounting and Auditing professional bodies.
He is known for his engaging teaching style and commitment to imparting practical knowledge to his students. He has published over 39 research papers on a wide variety of topics ranging from accounting, auditing, finance, risk and insurance. He has also supervised over 8 PhD students, more than eight masters students to completion and a lot of honours students. He published his research work both locally and internationally to the audience and also examined a number of theses and dissertations on a wide variety of topics.

Celani John Nyide
Celani John Nyide currently heads the Department for Finance and Information Management at Durban University of Technology. He holds a DBA (Finance) from the University of KwaZulu-Natal. Dr. Nyide is a well-published multidisciplinary scholar in the fields of managerial accounting and finance, business administration, and information management. He leads a team of researchers in the Accounting and Information Management (AIM) project. Additionally, he has successfully supervised numerous postgraduate students and has participated in several high-profile conferences internationally.
References
- Alduais, F. (2020). An empirical study of the earnings-returns association: Empirical evidence from chinia’s A-share market. Future Business Journal, 6(1), 1–18. https://doi.org/10.1186/s43093-020-0010-8
- Ang, A., & Bekaert, G. (2006). Stock return predictability: Is it there? Review of Financial Studies, 20(3), 651–707. https://doi.org/10.1093/rfs/hhl021
- Astivia, O. L. O., & Zumbo, B. D. (2019). Heteroskedasticity in multiple regression analysis: What it is, how to detect it and how to solve it with application R and SPSS. Practical Assessment, Research and Evaluation, 24(1), 1–19.
- Baker, M., & Wurgler, J. (2006). Investor sentiment and the cross section of stock returns. The Journal of Finance, 61(4), 1645–1680. https://doi.org/10.1111/j.1540-6261.2006.00885.x
- Baker, M., Wurgler, J., & Yuan, Y. (2007). Investor sentiment in the stock market. Journal of Financial Economics, 104(2), 272–287. https://doi.org/10.1016/j.jfineco.2011.11.002
- Benakovic, D., & Posedel, P. (2010). Do macroeconomic factors matter for stock returns? Evidence from estimating a multifactor model on the Croatian market. Business System Research, 1(1–2), 1–50.
- Brown, G. W., & Cliff, M. T. (2005). Investor sentiment and asset valuation. The Journal of Business, 78(2), 405–440. https://doi.org/10.1086/427633
- Chan, C. K., Jegadeesh, N., & Lakonishok, J. (2007). Earnings quality and stock returns. Journal of Business, 79(3), 1041–1082. https://doi.org/10.1086/500669
- Chen, K. (2008). Investor sentiment and use of accounting information, University of Southern California, working paper.
- Chen, P., & Zhang, G. (2007). How do accounting variables explain stock price movement? Theory and evidence. Journal of Accounting and Economics, 27, 219–244.
- Cornell, B., Landsman, W. R., & Stubben, S. R. (2017). Accounting information, investor sentiment and market mispricing. Journal of Law, Finance and Accounting, 2, 325–345. https://doi.org/10.1561/108.00000017
- Dalika, N. K., & Seetharam, Y. (2015). Sentiment and return: analysis of investors sentiment in the South African market. Investment Management and Financial Innovation, 2(1), 267–276.
- Dang, N. H., Hoang, T. V. K., & Tran, D. (2017). The relationship between accounting information in the financial statements and the stock returns of listed firms in Vietnam Stock Exchange. International Journal of Economics and Finance, 9(10), 1–10. https://doi.org/10.5539/ijef.v9n10p1
- De Long, J. B., Shleifer, A., Summers, L. H., & Waldmann, R. J. (1990). Noise trader risk in financial markets. Journal of Political Economy, 98(4), 703–738. https://doi.org/10.1086/261703
- Dechow, P., Ge, W., & Schrand, C. (2010). Understanding earnings quality: A review of the proxies, their determinants and their consequences. Journal of Accounting and Economics, 50(2–3), 344–401. https://doi.org/10.1016/j.jacceco.2010.09.001
- Duong, H. K., Schuldt, M., & Gotti, G. (2017). Investor sentiment and timely loss recognition. Review of Accounting and Finance, 17(3), 383–404. https://doi.org/10.1108/RAF-07-2016-0104
- Fonou Dombeu, N. C., Mbonigaba, J., Olarewaju, M. O., & Nomlala, B. C. (2022). Earnings quality measures and stock return volatility in South Africa. Future Business Journal, 8(1), 1–15. https://doi.org/10.1186/s43093-022-00115-x
- Fonou-Dombeu, N. C., Mbonigaba, J., Olarewaju, M. O., & Nomlala, B. C. (2022). Effect of earnings quality properties on the performance of companies: Empirical evidence from South Africa. Finance, Accounting and Business Analysis, 4(1), 1–17.
- Fonou-Dombeu, N. C., Nomlala, B. C., & Nyide, C. J. (2023). Earnings quality during COVID-19 pandemic: Evidence from South African listed companies. Journal of Accounting, Finance and Auditing Studies, 9(3), 340–367.
- Gao, B., & Yang, G. (2017). Forecasting stock index futures returns with mixed-frequency sentiment. International Review of Economics & Finance, 49, 69–83. https://doi.org/10.1016/j.iref.2017.01.020
- Haritha, P. H., & Rishad, A. (2020). An empirical examination of investor sentiment and stock market volatility: Evidence from India. Financial Innovation, 6(1), 1–15. https://doi.org/10.1186/s40854-020-00198-x
- Hirsleifer, D., Hou, K., & Teoh, S. H. (2009). Accruals, cash flow and aggregate stock returns. Journal of Financial Econometrics, 91(3), 389–406. https://doi.org/10.1016/j.jfineco.2007.11.009
- Hung, D. N., & Van, V. T. T. (2020). Studying the impact of earnings quality on stock return: Experiments in Vietnam. International Journal of ADVANCED aND APPLIED SCIENCES, 7(4), 45–53. https://doi.org/10.21833/ijaas.2020.04.007
- IBM Corp. (2019). IBM SPSS advanced statistics 26, Armonk: New York, https://www.ibm.com/support/pages/can-i-compute-robust-standard-errors-spss.
- Kang, Q., Liu, Q., & Qi, R. (2010). Predicting stock market returns with aggregate discretionary accruals. Journal of Accounting Research, 48(4), 815–858. https://doi.org/10.1111/j.1475-679X.2010.00379.x
- Larson, C., Sloan, R., & Giedt, J. Z. (2018). Defining, measuring and modelling accruals: A guide for researchers. Review of Accounting Studies, 23(3), 827–871. https://doi.org/10.1007/s11142-018-9457-z
- Lev, B. (1989). On the usefulness of earnings and earnings research: Lessons and directions from two decades of empirical research. Journal of Accounting Research, 27(27), 153–192. https://doi.org/10.2307/2491070
- Mian, G. M., & Sankaraguruswamy, S. (2012). Investor sentiment and stock market response to earnings news. The Accounting Review, 87(4), 1357–1384. https://doi.org/10.2308/accr-50158
- Miranda, K. F., Machado, M. A. V., & Macedo, L. A. F. (2018). Investor sentiment and earnings management: does analysts’ monitoring matter? Strategic Finances, 19(4), 1–29.
- Mugoto, H. T., Rupande, L., & Muzindutsi, P. F. (2019). Investor sentiment and foreign financial flows: Evidence from South Africa. Zbornik Radova Ekonomski Fakultet u Rijeka, 37(2), 473–498.
- Muguto, H. T., Muguto, L., Bhayat, A., Ncalane, H., Jack, K. J., Abdullah, S., Nkosi, T. S., & Muzindutsi, P.-F. (2022). The impact of investor sentiment on sectoral returns and volatility: Evidence from the Johannesburg stock exchange. Cogent Economics & Finance, 10(1), 24. https://doi.org/10.1080/23322039.2022.2158007
- Omotor, D. G. (2010). Relationship between inflation and stock market returns: Evidence from Nigeria. CBN Journal of Applied Statistics, 1(1), 1–15.
- Park, S. (2015). Investor sentiment and earning management. Investment Management and Financial Innovations, 12(4), 81–89.
- Perotti, P., & Wagenhofer, A. (2014). Earnings quality measures and excess returns. Journal of Business Finance & Accounting, 41(5-6), 545–571. https://doi.org/10.1111/jbfa.12071
- Qiu, L., & Welch, I. (2006). Investor sentiment measures. NBER Working Paper No.10794.
- Rajgopal, S., & Venkatachalam, M. (2011). Financial reporting quality and idiosyncratic return volatility. Journal of Accounting and Economics, 51(1–2), 1–20. https://doi.org/10.1016/j.jacceco.2010.06.001
- Reddy, L. D. V. (2012). Impact of inflation and GDP on stock market returns in India. Journal of Advanced Research in Management and Social Science, 1(6), 1–17.
- Rupande, L., Muguto, H., & Muzindutsi, P. F. (2019). Investor sentiment and stock return volatility: evidence from the JSE. Cogent Economics & Finance, 7(1), 1600233. https://doi.org/10.1080/23322039.2019.1600233
- Seok, S. I., Cho, H., & Ryu, D. (2019). Firm specific investor sentiment and daily stock return. North American Journal of Economics and Finance, 50, 1–19.
- Shao, S., Stoumbos, R., & Zhang, X. F. (2021). The power of accounting information in explaining stock return. Review of Accounting Studies, 26(4), 1249–1289. https://doi.org/10.1007/s11142-020-09572-7
- Simpson, A. (2013). Does investor sentiment affect earnings management. Journal of Business Finance & Accounting, 40(7-8), 869–900. https://doi.org/10.1111/jbfa.12038
- Sloan, R. (1996). Does stock price fully reflect information in accrual and cash flow about future earnings? The Accounting Review, 71(3), 289–315.
- Wang, W. (2018). Investor sentiment and the mean variance relationship: European evidence. Research in International Business and Finance, 46, 227–239. https://doi.org/10.1016/j.ribaf.2018.02.006
- Xavier, G. C., & Machado, M. A. V. (2017). Anomalies and investor sentiment: Empirical evidence in Brazilian market. Brazilian Administration Review, 14(3), 1–20.