
Abstract
This study presents the advantages of detailed landscape analysis by UAV (drone hereafter) photogrammetry compared with satellite remote sensing data. First, satellite data are used for generating a coarse-scale land use/land-cover (LULC) map of the study region using conventional GIS techniques. The Advanced Land Observation Satellite-2 (ALOS-2) Phased Array L-band Synthetic Aperture Radar-2 (PALSAR-2) L-Band backscattering data are processed with a multilayer perceptron (MLP) supervised classification for generating a categorical map. The satellite-derived classification map resulted in eight general land-cover types with a ground resolution of 7.5 m, providing a moderate-resolution representation of the island landscapes. Second, the drone’s image data are used to collect ground survey information and microscale information of the local site by implementing a structure from motion (SfM) technique to develop mosaicked orthorectified images of the sites. The orthophoto and digital surface model (DSM) derived from the drone-based data had resolutions of 0.05 m and 0.1 m, respectively. The SAR-based LULC map showed an overall accuracy of 78.1%, and the drone-based LULC map had an overall average accuracy of 92.3%. The subset area of the SAR map was compared with the drone-based map and showed average Kappa statistics of 0.375, demonstrating that satellite data cause challenges in correctly delineating the local land environment. The terrain information generated by the SfM method provided a good representation of the topography showing the drastic changes in the environment. The results indicate the usefulness of drone-based landscape analysis for future land-use planning at a local village scale.
PUBLIC INTEREST STATEMENT
Every year, new techniques or tools are developed for more advancing researches. Remote sensing field is one of the rapid developing area, which gives advantages when conducting large-scale analysis, such as from using satellite information. On the other hand, in the past few years, the emerging trend of the unmanned aerial systems (UASs) shows it’s potential in utilizing at various opportunities to conduct experiments or researches focusing more relating to local-scale analysis. The purpose of this work is to show what can be achieved from utilizing the former satellite data and the latter new technology of UAS, by focusing on conventional approach of image classifications for the landscape analysis at both large/local scale. Satellite analysis showed a promising overview of larger spatial extent, while UAS gave precision in local scale analysis with addition of very detailed topography information.
1. Introduction
Remote sensing data, such as spaceborne data (satellite data) and airborne data (aircraft observation), in association with GIS techniques are advantageous for observing and analyzing areas from local to global scales to understand environmental conditions, situations, or changes occurring on this planet (Gurney, Foster, & Parkinson, Citation1993). GIS techniques have shown promising results in various fields such as forestry (Iizuka & Tateishi, Citation2015), ecology (Apan, Citation1996; Honnay, Piessens, Landuyt, Hermy, & Gulinck, Citation2003; Martínez, Ramil, & Chuvieco, Citation2010), urban planning (Weber, Citation2003), land-use change (Tang, Wang, & Yao, Citation2008; Villa, Citation2012; Wu et al., Citation2006), and other related fields. Satellite sensors are either passive (optical) or active, such as synthetic aperture radar (SAR), and both types of sensors have advantages and disadvantages. The type of sensor used depends on the objectives of the project and the required details of the analysis and processing. A critical issue for optical sensors is cloud cover, which makes it difficult or impossible to detect and analyze the land surface under the clouds. For SAR sensors, the radar distortions and resulting complex feature interpretations are disadvantages compared to optical sensors (Richards, Citation2009). The data from many satellites have a low ground resolved distance, which blurs the images and makes it difficult to identify objects compared to airborne imagery. Sanga-Ngoie, Iizuka, and Kobayashi (Citation2012) stated the importance of analyzing detailed land features, and the level of detail can impact the results of environmental assessments. Although fine-resolution satellite imagery such as GeoEye, WorldView, and other high-resolution satellite sensors exist, the collection of visible and analyzable scenes may be less frequent due to cloud cover, providing unsatisfactory results and limiting the analysis. Alternatives are required to overcome these issues so that current land information can be updated for land-use planning and monitoring. Unmanned aerial vehicle (UAV, hereafter also referred to as drone) technology can be used as such an alternative. This approach allows us to enhance and advance the analysis compared to using only satellite imagery, while additional surveying of the sites can be improved compared to conventional ground surveying (Congalton & Green, Citation2009).
Various research studies have demonstrated the usefulness of implementing UAVs in different fields of study (Flynn & Chapra, Citation2014; Getzin, Nuske, & Wiegand, Citation2014; Jaud et al., Citation2016; Luna & Lobo, Citation2016). For example, Luna and Lobo (Citation2016) utilized UAVs to assess the planting quality of crops by mapping gaps in the crop canopy to guide replanting. UAV images have been used not only for field investigations but also for terrain analysis based on photogrammetry (Jaud et al., Citation2016), and such information can be used to understand the local topography. Implementing a drone-based technique for topographic analysis has better quality/accuracy than satellite remote sensing techniques, such as the generation of digital elevation models (DEM) from interferometric SAR data (Crosetto, Citation2002), which limits the resolution and quality depending on various factors, resulting in discontinuities in obtaining correct land information. Research on integrating satellite information and drone photogrammetry is still developing, and it is important to compare the scale of the information that can be obtained from both data sets.
The objective of this study is to present the advantages of the drone photogrammetry method in collecting more detailed and useful local landscape information than satellite data. Postmining sites in Indonesia were selected as the case study sites because their complex topography and landscape were suitable to compare the results of both SAR- and UAV-based methods. In these sites, massive tin mining activity has degraded the land and has changed the landscape, presenting evidence of how human interactions can change the environment. The results could provide better precision to obtain detailed land information including the microtopography (elevation, slope, etc.), which is required for strategic land-use management and the reclamation of such environmentally degraded lands.
2. Methodology
2.1. Study area
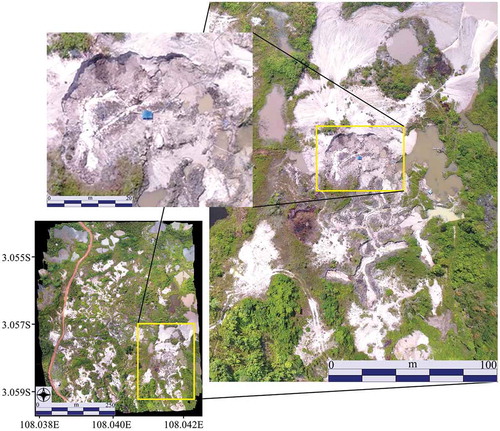
The study area is located at Belitung Island in Indonesia, located between Sumatra and Kalimantan, just east of Bangka Island. The center of the island is located at 2.83° S and 107.916° E. The land area is approximately 4,800 km2, and the population is 262,357 according to the 2010 census (http://sp2010.bps.go.id/index.php/navigation/wilayah). The west coast of the island has been developed into tourist resorts, while the majority of the island consists of preserved forested areas (either natural or secondary forest) or plantation areas. On the east side of the island, there are large areas of degraded land due to the tin-mining activity (Erman, Citation2007; Pöyhönen, Citation2009). The history of tin mining in Belitung began in the eighteenth century (Heidhues, Citation1991), and the mining continued in the colonial era; today, an Indonesian government-owned company runs the mines. Due to depressed tin prices in recent years, transitions are seen from industrial to agricultural production, resulting in a reduction in tin production, and different products are now produced such as white pepper. However, there are still individual mining activities that have raised some issues (Pöyhönen, Citation2009). This is evident by interpreting images of areas where the mining activity ended and where lakes were generated (dark features resembling holes); these features can be observed throughout the island (Figure ). The focus of this study is on these postmining areas, covering the east side of the island. The postmining areas are identified from the large bare soil area with several hole-like lakes in the surrounding area. Mining concession data are used to confirm the postmining sites and to determine whether the site has been abandoned. The information was collected from the support of the local company. Two test sites were selected for implementing the aerial survey with the drone (Figure ).
Figure 1. Overview of Belitung Island and the selected sites for implementing the aerial survey with the drone. In the eastern part of the island, mining activities are evident. The dark features are small lakes generated by the mining process (zoomed image). The dotted area within the image represents the survey area for the flight zones. The selected sites are hereafter referred to as Sites 1 and 2. Images are sourced from Google Earth.
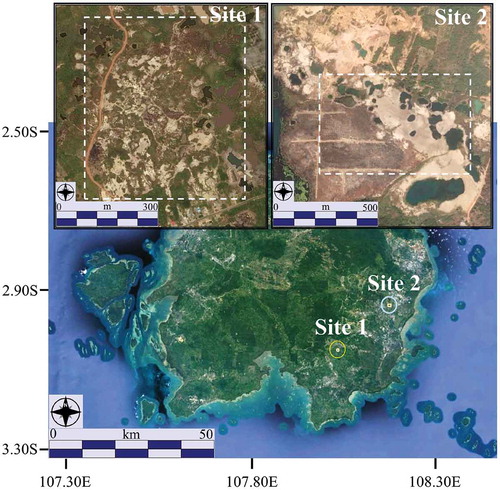
Site 1 is located in the southcentral area of the island. The site consists of four major land use/land-cover (LULC) types. The first is vegetation, which is broad in structure, from small grasses to shrubs to tall trees. The second is bare soil, where the major bare soil is white soil, which is the sandy tailings from the mining activity, and a small area of brown soil is observed (the path along the north-south direction located on the west side of the site), which is mainly used as a pathway for the locals. Water bodies (small lakes) occur as hole-like shapes, which result from open-pit mining, where the water pumps used for mining can directly flood the holes, but also local precipitation contributes to generating small lakes. This is the same for most of the mining sites throughout the island. Site 2 is located in the eastern part of the island. Similar grass and shrubs can be seen in the vegetative classes, but a plantation area was seen on the west side of the site. The site consists of LULC types similar to Site 1, but with larger homogenous areas of bare soil. White soil is again the result from mining activity, and the brown soil on the west side of the site is used as pathways for accessing the plantation area. Few houses are seen along the roads that cross in the east–west direction near the center of the site.
2.2. Data sets
One main data set is the satellite remote sensing data from the Advanced Land Observation Satellite-2 (ALOS-2) Phased Array L-band Synthetic Aperture Radar-2 (PALSAR-2). Since cloud-free optical data were difficult to obtain, SAR data were utilized. PALSAR-2 is a microwave sensor acquiring L-band (1.2 GHz) wavelength information. Data were obtained for 2 June 2016, specifying a Level 1.1 stripmap mode, high sensitivity (6 m), dual polarized product in single look complex (SLC) format. Both HH (Horizontal transmitted, Horizontal received) and HV (Horizontal transmitted, Vertical received) polarized data were used for further analysis. Because the focus is on the mining area of the island, only the images with high coverage over the east part of the island were collected.
The second type of data consisted of drone-based aerial photos acquired at the study site. A DJI Phantom 4 quadcopter (DJI, Shenzhen, China) was used, and a sufficient number of photos were acquired to collect detailed information of the area.
2.3. SAR preprocessing and LULC classification
Preprocessing of the PALSAR-2 data was performed using the software Sentinel-1 toolbox 4.0.2 developed by the European Space Agency (ESA), and Clark Labs’ TerrSet software (Clarks Lab, MA, USA) was used for the image classification. Preprocessing of the SAR data was performed using a 7 × 7 Lee Sigma speckle filter to reduce the noise caused by multiple surface objects, referred to as speckles (Lee, Wen, Thomas, Chen, & Chen, Citation2009). The filtered product was then processed using terrain flattening (slope correction) to flatten the area to reduce distortions to the imagery due to hills and mountains (Small, Citation2011). A Range Doppler Terrain Correction was applied to the terrain-flattened product to convert from radar coordinates to geographical coordinates. Finally, an additional 3 × 3 Lee Filter was applied to reduce the number of artifacts caused by the radiometric correction. The ground range pixel spacing of the processed data is 7.5 m.
Other than the preprocessed HH and HV bands, the data were processed by extracting texture information derived from the HH and HV data. Using a 3 × 3 window size, the following texture parameters were extracted using the grey-level co-occurrence matrix (GLCM) method (Wen, Zhang, & Deng, Citation2009): Contrast, Dissimilarity, Homogeneity, Angular Second Moment, Energy, Maximum Probability, Entropy, GLCM Mean, GLCM Variance, and GLCM Correlation. Each texture parameter was generated from both HH and HV bands, and all data except for the GLCM correlation were stacked and used as variables for the classification process. Training data for the land-cover classes were obtained using Google Earth imagery as reference information (Sharma, Tateishi, Hara, & Iizuka, Citation2016). Through the interpretation of multiple imageries at different time periods, sufficient training samples were collected representing each land-cover class on the island for use in the classification process. Eight classes were used for the classification process: Residential, Forest, Wet Forest (riparian forest), Shrub, Logged, Plantation, Bare land, and Water. Multi-layer perceptron (MLP) neural network supervised classification (Eastman, Citation2015) was implemented to develop an LULC map of the eastern Belitung Island. The advantage of implementing MLP is the ability to derive patterns and trends from complicated/numerous data, which could be difficult to extract using other techniques; moreover, the method has advantages in characterizing nonlinear trends (Iizuka et al., Citation2017). The classification map was processed with an additional 3 by 3 mode filter to smooth the classification results.
2.4. Drone observations, orthophoto generation and LULC classification
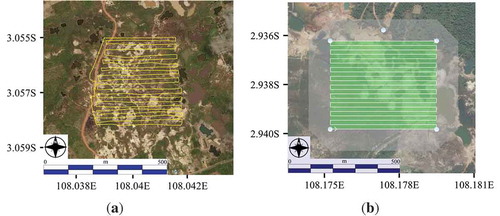
Field observations were conducted at the two sites selected from the satellite imagery. The Phantom 4 drone flew across the area to collect aerial imagery and video to obtain detailed information on the sites. For the manual flight control, the software DJI GO (DJI Technology Co., Ltd; http://www.dji.com/goapp) was used, and for the automatic flight control and the photo acquisition, the software Altizure (Everest Innovation Technology; https://www.everest-innovation.com/) was used. The aerial photos were processed using Photoscan Pro (Agisoft, St. Petersburg, Russia) to generate a mosaicked orthorectified image of each site. Photoscan outputs a mosaicked image of the area by generating a point cloud from the photos using a structure-from-motion (SfM) technique (Mancini et al., Citation2013). Based on the estimated camera positions and photos, a 3D polygon mesh is developed by the software (http://www.agisoft.com/pdf/photoscan-pro_1_2_en.pdf). After constructing the geometry, an orthophoto can be generated. Orthorectification refers to the process of correcting the geometry of the images based on the angles and distances of the features from the sensor’s position, and the process results in an image with a nadir view (directly vertical), unlike an uncorrected image, which results in inclined features (Zhou, Chen, Kelmelis, & Zhang, Citation2005). Aerial surveys were performed on 21 July 2016 at Site 1 and on 22 July 2016 at Site 2. Due to drone regulations and climatic conditions, the photos were acquired by maintaining a stable altitude of 140 m for Site 1 (considering the flight limit of 150 m), and 100 m for Site 2 (due to strong wind). Figure shows the flight paths at the sites.
Figure 2. Flight paths of the Phantom 4 drone across (a) Site 1 and (b) Site 2. Site 1 was flown using manual flight control and Site 2 was flown using an automated flight plan.
For image classification, the same MLP method was implemented on the drone imagery for developing a categorical map. The RGB composite image (ortho image) was decomposed into individual red (R), green (G) and blue (B) bands. The bands were transformed into an additional color space, hue, lightness and saturation. An additional green-red vegetation index (GRVI) (Motohka, Nasahara, Oguma, & Tsuchida, Citation2010) was generated, and each band is stacked as variables for the classification process.
2.5. Digital surface model (DSM) generation
Along with generating a mosaicked orthophoto of the study site, additional data were generated to determine the topography. A digital surface model (DSM), a 3D representation of the terrain’s surface, was developed based on the dense point cloud information created in Photoscan. A DSM represents the earth’s surface and includes the heights of all objects. For example, the height of the terrain will be shown as the top layer of each object, where this represents the top canopy layer for trees and the roof for a house. The local terrain and the characteristics of each site were examined by further processing to generate slope information from the DSM data. The inverse distance weighting (IDW) interpolation method was implemented to generate the DSM from dense point cloud data.
Evaluation and Comparison of LULC Maps
The two LULC maps generated by SAR- and drone-based methods was first evaluated separately in different ways due to the differences in the spatial resolutions. The SAR-based LULC map was validated by the cross-validation method in the classification process to determine the classification capability of the model. Fifty percent of the data were used for training from the whole training data set, while the other 50% was used for validation. A total of 10,000 samples were used for each LULC class. The conventional accuracy assessment method was applied to the drone-based LULC map to validate the overall accuracy of the categorical map (Congalton & Green, Citation2009). The ground truth information was collected through the aerial image, and each class was confirmed from the images taken during the ground observation. Selected points were automatically generated using stratified random sampling, and 300 points per class were generated. For the comparison between the two maps, the Kappa index of agreement (KIA) (Pontius, Citation2000) was computed to quantify the reliability of the SAR map to the drone map.
3. Results
3.1. SAR-based LULC map of east Belitung island
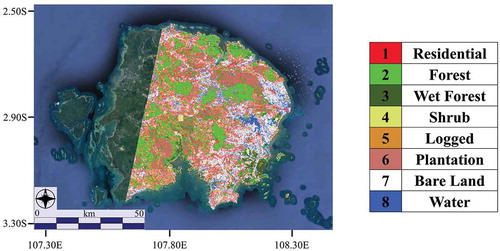
Figure shows the results of the classification using the PALSAR-2 data with a resolution of 7.5 m for the categorical map. An accuracy assessment was performed using 5000 pixels per class, resulting in a model accuracy of 78.1%. The training and testing root mean square (RMS) were 0.2017 and 0.2022, respectively, indicating that there were no issues with overfitting. Table shows the variables used in the neural network model and the accuracy of the categorical map with regard to each variable. The skill measure represents the measured accuracy minus the accuracy expected by chance. For this map, the most influential variable was HV mean, and the least influential variable was HH contrast. Overall, a higher accuracy was obtained when HV-polarized data were used in the model, which is probably due to the high proportion of vegetated land cover in the region, because it is well known that HV data are sensitive to vegetative classes (Iizuka & Tateishi, Citation2014).
Table 1. Sensitivity of the MLP model to forcing a single independent variable to be constant. Skill measure represents the measured accuracy minus the accuracy expected by chance. If skill measure shows higher decrease from the accuracy, the variable is considered to have higher influence to the model
Figure 3. Land-use/land-cover map of Belitung Island based on PALSAR-2 data.
3.2. Drone orthophoto and LULC map
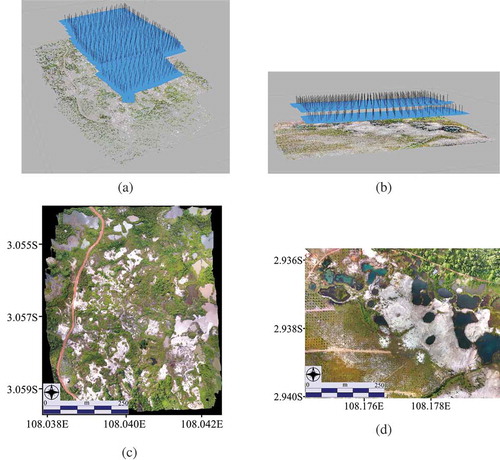
At Site 1, the Phantom 4 drone acquired multiple photos over the area shown in Figure . Due to difficulties with network connections, an automated flight course could not be planned for this area; instead, manual flight control was used for the flight paths and photo acquisition, resulting in the unstable tracks seen in the figure. A total of 655 photos were acquired with a minimum of 85% forward and side overlap. Figure shows the flight track for Site 2, which was acquired using automated flight control, and at this site, 517 photos were acquired with 85% forward and side overlap using the Altizure app. Using the Photoscan software, an orthophoto of the site was generated (Figure ). The total areal coverage was approximate 30 ha for Site 1 and 32 ha for Site 2.
Figure 4. Orthophoto of the two sites generated by using Photoscan Pro, with 655 photos for Site 1 and 517 photos for Site 2. (a) A screen capture of generating the point cloud from the photos at Site 1; the blue marks are the estimated camera positions and the black perpendicular line is the axis. (b) The data for Site 2. (c) The final orthophoto generated for Site 1 and (d) for Site 2.
3.3. Interpretation of the topography
Figure shows the DSMs and the slope information generated from the DSM for each site, representing the local topography. The elevation is based on the height from the ellipsoid and on the WGS84 datum. Because the elevation represents DSM data and not digital terrain model (DTM) data, some objects, such as shrubs and trees, are represented with much higher elevations or higher sloped features compared to the surroundings. In addition, the water bodies have a similar rugged slope due to the difficulty in obtaining the actual water elevation through photogrammetry.
Figure 5. Topographical information for Site 1 and Site 2. (a) and (b) are the DSMs showing the elevation heights from the ellipsoid for Site 1 and Site 2, and (c) and (d) are the slope maps of Site 1 and Site 2, respectively.
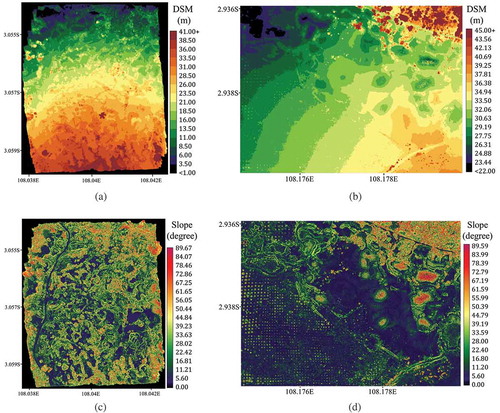
The topography at Site 1 exhibits a trend of higher elevation in the southern part and a gradually decreasing elevation toward the northern part. This trend can be interpreted by looking at the small lakes in the orthophoto (Figure a), where the majority of the lakes are located in the northern area at low elevations. The soils were possibly scraped due to mining activity using the water located in the northern area, and the sandy tailings were piled on the southern side, generating a gentle decreasing slope to the north. Ignoring all the vegetated areas and the water bodies, the slope information was extracted only from the bare soils in the image. At Site 1, the average slope was 7.20°, with a standard deviation of 6.50°. The brown- and white-colored soil areas had average slope values (and standard deviations) of 6.40° (5.84) and 7.50° (6.71), respectively.
At Site 2, a general trend of decreasing elevation was observed from the east to the west side of the image. The highest part is in the lower right corner of the image, with a gradual decrease in elevation toward the top left corner. The top right corner of the image is a forested area; therefore, higher elevation data occur in this area. On the west side of the image, there is a stream, and the decreasing elevation in this area continues toward the stream. The area appears similar to floodplains; however, the gradual elevation trends can be made by similar explanation to Site 1. As in Site 1, the terrain information is extracted from the bare soil areas, which obtained an average slope of 5.71°, with a standard deviation of 5.10°. The slope values in the brown- and white-colored soil areas (Figure b) were on average (and standard deviations) 5.41 and 5.97° (4.39 and 5.62°)), respectively.
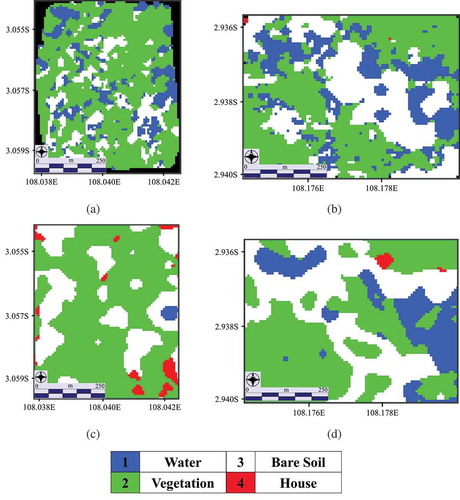
Figure 6. Top images show the LULC maps generated from the drone imagery for (a) Site 1 and (b) Site 2. Bottom images indicate the subset area (enlarged area) of the candidate sites for the LULC maps based on the SAR imagery for (c) Site 1 and (d) Site 2.
Overall, the brown soil areas are more leveled because they were pathways for the locals, which includes vehicles. Additionally, similar pathways are seen at the plantations for transportation purposes (but not main asphalt roads).
The white bare soil areas result from the human impacts of mining activities. The small-scale open-pit method for mining generates many small hills in the surrounding areas. This is likely one of the causes of the rough topography in the area, especially for Site 1. The composition of the white soil at Site 1 in the highly sloped area is characterized by coarse sand (2.0–0.2 mm): 52.3%, fine sand (0.2–0.02 mm): 42.7%, silt (0.02–0.002 mm): 0.3%, and clay (< 0.002 mm): 4.7%. The soil in the low sloped area has coarse sand: 23.4%, fine sand: 74.1%, silt: 0.9%, and clay: 1.6%. The fine sand has possibly runoff to the low sloped areas. At Site 2, a more homogenous area of bare soil is seen with a smoother topography than Site 1. The environment looks similar to a floodplain considering the surrounding environment. Usually, this kind of environment experiences flood events that transport the sediments and leave the fine-grained sand more inland; however, in the case of this area, the gradual relief of the sandy soils is formed from the past mining activity. The open-pit method has a high water demand. It uses high-pressure water to scrape off the soil, separating the minerals and the sandy tailings, and piling the tailings in one area. As this area is observed to have adequate water capacity at the west side, the mining site would have been owned by a large company, leaving larger volumes of soil in one place than the small-scale activities at Site 1. The composition of the white soil in Site 2 is characterized by coarse sand: 69.6%, fine sand: 29.4%, silt: 0.2%, and clay: 0.8%. Sites 1 and 2 both have low pH values, with an average of 5.72. The soil analysis has been requested to the Japan Soil Association.
A comparison of the two sites from the DSM analysis indicates that Site 2 is flatter than Site 1; simply by considering the flatness and the LULC homogeneity of the area, Site 2 could be a candidate for developments (e.g., residential), because a major cost of developments is from land clearing and leveling. Even though a large water stream is seen in the west area, the elevation at the white soil area can be as high as 10 m from the water, with lower risks of flood events than at other locations. Moreover, using the topography data, parameters such as the soil volume of the area can be calculated, and further decisions can be made if there are needs for additional ground level raising and volume adjustments. These kinds of decisions can be made from the drone imagery with the SfM method at a local scale, which cannot be easily performed with only SAR interpretation.
SAR-based LULC map comparison to the local-scale drone map
Figure shows the categorical map and the classes from both the SAR and drone analyses at the two sites. The resolution of the SAR- and drone-based LULC maps is 7.5 m and 0.05 m, respectively. The categorical map generated from the drone image resulted in a total of four LULC classes: Water Bodies, Vegetation, Bare Soil and Houses (houses were added manually due to their small number and area). Using the ground truth points collected through the imagery, an accuracy assessment was performed for the drone-based map, and the overall accuracy result was 89.9% and 94.7% for Site 1 and Site 2, respectively. A sample size of 300 points was selected for each LULC class, resulting in a total of 900 points (houses were omitted from the assessment). Most of the error occurs between the water and bare soil classes, with confusion between the murky water and wet soils.
The detectability of the LULC classes for both sources is different; generally, the resolution is what causes the differences. Specifically, the SAR data are being confused due to the scattering mechanism of the microwaves, depending on the land objects, moisture content, topography, etc. for the correct classification (Ji & Wu, Citation2015; Richards, Citation2009). To compare the maps, relying on the conventional accuracy assessment does not make sense; therefore, the SAR-based map was quantitatively assessed for its similarity with the drone (reference) map using KIA. To combine both maps, the original LULC classes were merged into a general class. Forest, Wet Forest, Shrub, Logged, and Plantation is now combined into a “Vegetation” class, and Deep Water and Shallow Water are now a “Water” class. Now, the two maps display the four general classes: Water, Vegetation, Bare Soil and Residential. Second, the drone LULC map was resampled to 7.5 m using the nearest neighbor algorithm with a 3 × 3 mode filter. The SAR-based map was compared to the drone map by computing KIA. As a result, the KIA showed a value of 0.42 and 0.33 for Site 1 and Site 2, respectively. KIA can be interpreted where 0 indicates that the agreement of the maps is caused just by chance, a value between 0 and 1 indicates an agreement that is better than chance, and KIA = 1 is a perfect agreement. Therefore, in this case, it could be interpreted that the SAR-based map is on average 37.5% more reliable than an agreement just by chance.
4. Discussion
A classified map of eastern Belitung Island was developed using PALSAR-2 microwave remote sensing data. It was effective in determining and understanding the landscape of the island compared to utilizing optical satellite data, which are often limited due to the frequent cloud cover that obscures the underlying surface. This is a critical problem for determining surface conditions and is especially a problem for determining land features in tropical regions (Asner, Citation2001). SAR data are not affected by cloud cover, and the major land-cover types could be distinguished, resulting in a coarse representation of the landscape. However, it is difficult to obtain fine resolution information because of the limitation with SAR and its resolution of the imagery (Ji & Wu, Citation2015; Reigber et al., Citation2013). It is often difficult to classify land features accurately unless the collection occurs in full polarimetric mode, collecting HH, HV, VV, and VH data (Ji & Wu, Citation2015). The image classification utilizing PALSAR-2 with the MLP method resulted in a model accuracy of 78.1%. Variables were used based on the information that can be derived from the dual polarized SAR product. Increasing the number of variables improved the accuracy of the classified map, and the most influential variable for the classification was the HV mean data, while the least influential variable was HH contrast. The ranking of the variables depends largely on the LULC class types, and the results may change. The model still has room for improvements; however, from the interpretations of the classified map, distinguishing the major LULC types can be acknowledged to some degree. However, when this at a more local scale, the accuracy could be very limited. As shown by the results, SAR map with an average KIA of 0.375 is not very high to give satisfying results for precise landscape analysis. It is likely that an in-depth analysis of the LULC types at a local scale is erroneous with the space-borne SAR data because the heterogeneity of the land features cannot be discriminated due to the relatively low resolution; thus, alternative approaches are required to detect fine details in the landscape.
To aid in such a problem, the drone information can be utilized as a tool for fine, local-scale landscape analysis. The orthophotos generated from multiple photos (Figure ) demonstrate the potential for obtaining the detailed information of a landscape. The ground resolution was approximately 0.05 m (depending on the camera sensor and the flying height above the ground, the resolution can be higher), which is much higher than the resolution of any current satellite imagery, allowing for the in-depth analysis of the landscape. Small patches of water bodies or bare soils were easily detected with the drone image and the generated map (Figure ), while the SAR map tends to show a more generalized (merged) area. The average accuracy was 92.3%, which can represent a better understanding and reliability of the local landscape information. The limitation is that the drone image is captured from a normal RGB camera, which lacks additional information that can usually be collected from multispectral satellite images (e.g., infrared). Therefore, delineating subclasses of LULC types could be difficult. Onboarding different multispectral sensors might work for precise classifications (Ahmed et al., Citation2017).
If topography needs to be considered, an alternative source of topographic data is usually utilized. However, the SfM method can also generate terrain information. Therefore, compared to conventional data such as from the 90 m resolution Shuttle Radar Topography Mission (SRTM), Sites 1 and 2 showed an excellent interpretation of the drastic changes in the topography within the sites. This was possible because of the generated DSM resulting in a 0.1 m resolution. At Site 1, local workers (active tin mining) were detected through the analysis, which can be seen in the orthophoto (Figure ). These individual miners cause issues of frequent land degradation, but since it is at an individual scale, it is often overlooked from satellite observations. They can be identified by the differences in the slope angles suddenly increasing within the LULC class compared to the smoother relief in the surrounding area. Notably, the surrounding slope angles in the smoother area average 6.16°, but the mining pits are 19.34° on average. Clearly, the water pumps used for scraping the sediments are causing such degradation. This cannot be observed in coarse satellite images due to the resolution, while the aerial photos taken from the drone demonstrate one of their potentials.
Figure 7. Local worker using water pumps for tin mining. They are usually difficult to recognize in situ because they tend to stay away from the main roads. Massive terrain degradation from the activity can be clearly observed using the drone images, which is difficult to detect from the SAR image (at Site 1).
5. Conclusions
This study presents the advantages of drone photogrammetry in collecting more detailed and useful local landscape information than the satellite imagery. The changes in the local environment on Belitung Island are rapid and dramatic. Many areas face changes from one land-cover type to another depending on the demands. In the case of the post tin mining sites, anthropogenic activity has influenced the environment of the landscape. The SAR data with the use of the MLP method have demonstrated their usefulness in developing a coarse LULC map of the island. To provide a wide view of the large spatial extent, the conventional approach utilizing satellite imagery was promising. However, in regard to the local-scale analysis, detailed observation of the land needs a more in-depth analysis, but the SAR data were not applicable for this. A more precise analysis of the landscape can be performed by the drone using the SfM photogrammetry method. Although the spatial extent of the drone imagery was smaller than the satellite-derived data, the drone-based information provided higher precision and handled a broader area than conventional ground surveying. The SfM method can provide two important types of information: orthoimage and terrain data. To detect the conditions in the post mining sites and to analyze the area prior to landscape-level planning for development, business, or conducting research, it is crucial to understand the local LULC distribution and the terrain characteristics. The results indicate that the method can detect and analyze general LULC classes and characterize the heterogeneous topography using fine-detail photos. This study demonstrates that this technique can be considered for regions where various land-use decisions are required.
Acknowledgements
We would like to express our sincere appreciation to the two anonymous reviewers for the critical reviewing of the work.
Additional information
Funding
Notes on contributors
Kotaro Iizuka
Kotaro Iizuka is an assistant professor at the Center for Spatial Information Science, University of Tokyo, Japan. He is specialized in Remote Sensing and GIS (Geographical information System), receiving his PhD degree at Graduate School of Science, Department of Earth Sciences, Chiba University, Japan. His research interests is in developing and finding new ideas/information’s relating to spatial information science, which can be processed and used as base knowledge for further decision makings, which can be linked with various situations from local policies up to global perspectives. He mainly deals with, but not limited to, forestry by utilizing optical/radar satellites, UAVs, LiDAR to make advancements in relation with precision forestry.
References
- Ahmed, O. S., Shemrock, A., Chabot, D., Dillon, C., Williams, G., Wasson, R., & Franklin, S. (2017). Hierarchical land cover and vegetation classification using multispectral data acquired from an unmanned aerial vehicle. International Journal of Remote Sensing, 38, 2037–2052. doi:10.1080/01431161.2017.1294781
- Apan, A. A. (1996). Tropical landscape characterization and analysis for forest rehabilitation planning using satellite data and GIS. Landscape and Urban Planning, 34, 45–54. doi:10.1016/0169-2046(95)00201-4
- Asner, G. P. (2001). Cloud cover in landsat observations of the Brazilian Amazon. International Journal of Remote Sensing, 22, 3855–3862. doi:10.1080/01431160010006926
- Congalton, R. G., & Green, K. (2009). Assessing the accuracy of remotely sensed data; principles and practices (2nd ed. ed.). New York: CRC/Taylor & Francis.
- Crosetto, M. (2002). Calibration and validation of SAR interferometry for DEM generation. ISPRS Journal of Photogrammetry and Remote Sensing, 57, 213–227. doi:10.1016/S0924-2716(02)00107-7
- Eastman, J. R. (2015). TerrSet tutorial. Worcester, MA: Clark University.
- Erman, E. (2007). Rethinking of legal and illegal economy: A case study of tin mining in Bangka Island. Retrived from http://globetrotter.berkeley.edu/GreenGovernance/papers/Erman2007.pdf
- Flynn, K. F., & Chapra, S. C. (2014). Remote sensing of submerged aquatic vegetation in a shallow non-turbid river using an unmanned aerial vehicle. Remote Sensing, 6, 12815–12836. doi:10.3390/rs61212815
- Getzin, S., Nuske, R. S., & Wiegand, K. (2014). Using unmanned aerial vehicles (UAV) to quantify spatial gap patterns in forests. Remote Sensing, 6, 6988–7004. doi:10.3390/rs6086988
- Gurney, R. J., Foster, J. L., & Parkinson, C. L. (1993). Atlas of satellite observations related to global change. Great Britain: Cambridge University Press.
- Heidhues, M. F. S. (1991). Company Island: A note on the history of Belitung, Indonesia. 51, 1–20. doi:10.2307/3351063
- Honnay, O., Piessens, K., Landuyt, W. V., Hermy, M., & Gulinck, H. (2003). Satellite based land use and landscape complexity indices as predictors for regional plant species diversity. Landscape and Urban Planning, 63, 241–250. doi:10.1016/S0169-2046(02)00194-9
- Iizuka, K., Johnson, B. A., Onishi, A., Magcale-Macandog, D. B., Endo, I., & Bragais, M. (2017). Modeling future urban sprawl and landscape change in the Laguna de Bay Area, Philippines. Land, 6, 26. doi:10.3390/land6020026
- Iizuka, K., & Tateishi, R. (2014). Simple relationship analysis between l-band backscattering intensity and the stand characteristics of Sugi (Cryptomeria japonica) and Hinoki (Chamaecyparis obtusa) trees. Advances in Remote Sensing, 3, 219–234. doi:10.4236/ars.2014.34015
- Iizuka, K., & Tateishi, R. (2015). Estimation of CO2 sequestration by the forests in Japan by discriminating precise tree age category using remote sensing techniques. Remote Sensing, 7, 15082–15113. doi:10.3390/rs71115082
- Jaud, M., Passot, S., Le Bivic, R., Delacourt, C., Grandjean, P., & Le Dantec, N. (2016). Assessing the accuracy of high resolution digital surface models computed by PhotoScan® and MicMac® in sub-optimal survey conditions. Remote Sensing, 8, 465. doi:10.3390/rs8060465
- Ji, K., & Wu, Y. (2015). Scattering mechanism extraction by a modified cloude-pottier decomposition for dual polarization SAR. Remote Sensing, 7, 7447–7470. doi:10.3390/rs70607447
- Lee, J. S., Wen, J. H., Thomas, L. A., Chen, K. S., & Chen, A. J. (2009). Improved sigma filter for speckle filtering of sar imagery. IEEE Transactions on Geoscience and Remote Sensing, 47, 202–213. doi:10.1109/TGRS.2008.2002881
- Luna, I., & Lobo, A. (2016). Mapping crop planting quality in sugarcane from UAV imagery: A pilot study in Nicaragua. Remote Sensing, 8, 500. doi:10.3390/rs8060500
- Mancini, F., Dubbini, M., Gattelli, M., Stecchi, F., Fabbri, S., & Gabbianelli, G. (2013). Using unmanned aerial vehicles (UAV) for high-resolution reconstruction of topography: The structure from motion approach on coastal environments. Remote Sensing, 5, 6880–6898. doi:10.3390/rs5126880
- Martínez, S., Ramil, P., & Chuvieco, E. (2010). Monitoring loss of biodiversity in cultural landscapes. New Methodology Based on Satellite Data. Landscape and Urban Planning, 94, 127–140. doi:10.1016/j.landurbplan.2009.08.006
- Motohka, T., Nasahara, K. N., Oguma, H., & Tsuchida, S. (2010). Applicability of green-red vegetation index for remote sensing of vegetation phenology. Remote Sensing, 2, 2369–2387. doi:10.3390/rs2102369
- Pontius, R. G. (2000). Quantification error versus location error in comparison of categorical maps. Photogrammetric Engineering and Remote Sensing, 66, 1011–1016.
- Pöyhönen, P. (2009) Legal and illegal blurred: Update on tin production for consumer electronics in Indonesia, FinnWatch, Helsinki. Retrived from https://www.somo.nl/wp-content/uploads/2009/06/Legal-and-illegal-Blurred.pdf
- Reigber, A., Scheiber, R., Jäger, M., Prats-Iraola, P., Hajnsek, I., Jagdhuber, T., … Moreira, A. (2013). Very-high-resolution airborne synthetic aperture radar imaging: Signal processing and applications. Proceedings of the IEEE, 101, 759–783. doi:10.1109/JPROC.2012.2220511
- Richards, J. A. (2009). Remote sensing with imaging radar. New York: Springer.
- Sanga-Ngoie, K., Iizuka, K., & Kobayashi, S. (2012). Estimating CO2 sequestration by forests in oita prefecture, Japan, by combining LANDSAT ETM+ and ALOS satellite remote sensing data. Remote Sensing, 4, 3544–3570. doi:10.3390/rs4113544
- Sharma, R. C., Tateishi, R., Hara, K., & Iizuka, K. (2016). Production of the Japan 30-m land cover map of 2013–2015 using a random forests-based feature optimization approach. Remote Sensing, 8, 429. doi:10.3390/rs8050429
- Small, D. (2011). Flattening Gamma: Radiometric terrain correction for SAR imagery. IEEE Transactions on Geoscience and Remote Sensing. doi:10.1109/TGRS.2011.2120616
- Tang, J., Wang, L., & Yao, Z. (2008). Analyses of urban landscape dynamics using multi-temporal satellite images: A comparison of two petroleum-oriented cities. Landscape and Urban Planning, 87, 269–278. doi:10.1016/j.landurbplan.2008.06.011
- Villa, P. (2012). Mapping urban growth using soil and vegetation index and landsat data: The Milan (Italy) city area case study. Landscape and Urban Planning, 107, 245–254. doi:10.1016/j.landurbplan.2012.06.014
- Weber, C. (2003). Interaction model application for urban planning. Landscape and Urban Planning, 63, 49–60. doi:10.1016/S0169-2046(02)00182-2
- Wen, C., Zhang, Y., & Deng, K. (2009, September) Urban area classification in high resolution SAR based on texture features. International Conference on Geo-spatioal Solutions for Emergency Management (GSEM 2009) (pp. 281–285). Beijing, China.
- Wu, Q., Li, H., Wang, R., Paulussen, J., He, Y., Wang, M., … Wang, Z. (2006). Monitoring and predicting land use change in Beijing using remote sensing and GIS. Landscape and Urban Planning, 78, 322–333. doi:10.1016/j.landurbplan.2005.10.002
- Zhou, G., Chen, W., Kelmelis, J. A., & Zhang, D. (2005). A comprehensive study on urban true orthorectification. IEEE Transactions on Geoscience and Remote Sensing, 43, 2138–2147. doi:10.1109/TGRS.2005.848417