
Abstract
In this study, four models were developed to predict intrinsic constants based on some simple physical parameters as well as clay mineralogy of a reconstituted clay sample. The effect of each predictor on the response was evaluated for each individual clay mineralogy. According to the results, it appears that the void ratio at liquid limit has the greatest effect on clays with a considerable amount of smectite, while the effect of the initial void ratio of such clays is the least amongst other clay minerals. The accuracy of the predictive model increases with the inclusion of clay mineralogy as an input parameter. R2 increases from 0.978 to 0.99 and from 0.831 to 0.896 for intrinsic parameters of and
, respectively. A simplified method is also presented to determine the virgin compression line of reconstituted clays using the initial void ratio, the void ratio at the liquid limit, and its clay mineralogy.
PUBLIC INTEREST STATEMENT
This paper introduces four predictive models for intrinsic constants based on some simple geotechnical parameters as well as predominant clay mineral of a reconstituted clay sample. The effect of each input parameter on the response of the models was evaluated for each individual clay mineralogy. According to the results, the void ratio at liquid limit has the greatest effect on clays with a considerable amount of smectite, while the effect of the initial void ratio of such clays is the least amongst other clay minerals.
1. Introduction
Dredged slurry sedimentation is currently used frequently in land reclamations as a sustainable solution to manage the huge quantities of slurries dredged from lakes and rivers every year. The deposited slurries can be found all over the world where reclamation is considered to be an essential step in developing new urban areas. Over the past seven decades, researchers and geotechnical engineers across the world have been interested in better comprehending the compression behaviour of dredged slurries at high initial water content due to the potential effect of their settlement on future coastal development projects.
During the dredging process, the structure of a clayey material is broken down such that the sedimented dredged clay can be considered as a reconstituted soil. A reconstituted soil is defined as a type of remoulded sample which is prepared at a water content equal to or greater than its liquid limit following Burland’s (Citation1990) procedure. During the past seven decades, many researchers have performed a considerably large number of consolidation tests on remoulded/reconstituted samples to investigate the compressibility of clays (Butterfield, Citation1979; Habibbeygi, Nikraz, & Verheyde, Citation2017; Hong & Tsuchida, Citation1999; Hong, Citation2006; Mesri & Olson, Citation1971; Mitchell & Soga, Citation1976; Nagaraj & Miura, Citation2001; Nagaraj & Murthy, Citation1983; Sridharan & Gurtug, Citation2005; Sridharan & Nagaraj, Citation2000). However, a relatively accurate prediction of the compressibility behaviour of dredged slurries can be derived by performing modified oedometer (consolidation) tests on these types of materials; unfortunately, consolidation tests on reconstituted clays are always time-consuming, costly and cumbersome. The determination of compression index is considered to be a relatively expensive and time-consuming test in most geotechnical projects, especially when undertaken on clays with high initial water content. Considering all these difficulties and limitations in assessing the compressibility of reconstituted clays at high initial water content, geotechnical engineers estimating the volumetric behaviour of reconstituted clays often tend to use empirical correlations instead of performing one-dimensional consolidation tests. Accordingly, having some reliable empirical equations to predict the compression behaviour of such soils is beneficial. In this case, compressibility can be estimated by understanding some simple physical characteristics of the soil sample under study (i.e. initial water content, liquid and plastic limits, natural void ratio), which can be determined conveniently in the laboratory.
To the authors’ best knowledge, some research has previously been conducted to consider the effect of initial water content and soil properties on the compression behaviour of reconstituted clays (Cerato & Lutenegger, Citation2004; Kootahi & Moradi, Citation2016; Lee, Hong, Kim, & Lee, Citation2015; Lei, Wang, Chen, Huang, & Han, Citation2015; Takashi, Citation2015; Xu & Yin, Citation2015; Zeng, Hong, Cai, & Han, Citation2011), but only a few studies have taken into account the influence of clay mineralogy (Habibbeygi, Nikraz, & Chegenizadeh, Citation2017; Xu & Yin, Citation2015). In this paper, the intrinsic concept was used as a basic frame of reference for interpreting and evaluating the compressibility of reconstituted clays. Furthermore, the effect of clay mineralogy on compression behaviour has been assessed using a broad range of geotechnical data from the literature. Eventually, four series of practical relationships were developed to estimate the intrinsic constants and compressibility of a reconstituted clay based on some simple physical parameters, as well as the clay’s mineralogy.
2. Existing correlations for predicting intrinsic constants
Burland (Citation1990) proposed a unique framework for normalising the compression behaviour of reconstituted clays by introducing the intrinsic concept in his 40th Rankine lecture. The intrinsic concept has since been consistently used worldwide to explain the behaviour of clays (Al Haj & Standing, Citation2015; Habibbeygi et al., Citation2017; Hong, Lin, Zeng, Cui, & Cai, Citation2012; Hong, Yin, & Cui, Citation2010; Horpibulsuk, Liu, Zhuang, & Hong, Citation2016). Intrinsic compression behaviour can be interpreted by two constants of compressibility—compression index () and
—and a void ratio invariant, named the void index (
). According to Burland, compression index (
) can be defined as the subtraction of two definite void ratios (Equation 1). The void index at each state (
) can also be expressed with the related void ratio and the intrinsic constants as follows (Burland, Citation1990):
where and
are the void ratios of the reconstituted clay at the effective vertical consolidation stresses (
) at 100 kPa and 1000 kPa, respectively. To distinguish the reconstituted invariants from those of natural clays, the symbol (*) has been used with compression parameters in the equations related to a reconstituted clay.
Burland (Citation1990) stated that the compression behaviour of reconstituted clays can be generalised by using the normalised invariant of the void index and, in fact, a unique line can interpret the compressibility of all different clays independent of their natural state. However, it has been recently documented that the initial water content () of reconstituted clays has a considerable effect on the intrinsic compression line (ICL) at low stress levels (Habibbeygi et al., Citation2017; Hong et al., Citation2010; Xu, Gao, Yin, Yang, & Ni, Citation2014), and the ICL is almost unique for a broad range of initial water content for a “medium to high” stress range when
is plotted against
in a semi-log scale.
Burland (Citation1990) also proposed an empirical equation for calculating the ICL indirectly. The value of void index () to estimate the inherent compressibility of reconstituted clays can be calculated as follows:
Burland (Citation1990) also suggested a method for calculating the ICL indirectly in the absence of one-dimensional consolidometer test results, based on the regression analyses on a various range of clays (Equations 4 and 5). The use of the following equations must be limited to the liquid limit () from 25% to 160% (i.e.
in the range of 0.6–4.5) (Burland, Citation1990):
where is the void ratio of reconstituted clays at liquid limit.
Yin and Miao (Citation2013) proposed a modification to Burland’s relationships by considering the influence of initial water content on the intrinsic constants of reconstituted clays. Forty-two samples from three different sampling sites in China were collected in their study. The geotechnical parameters of the investigated soils can be summarised as follows:
The liquid limit varied between 61% and 91%; The plastic limit was limited to a narrow range of 30% to 38%; and the initial water content varied between 43% and 180%.
The modified equations for estimating the intrinsic constants ( and
) in terms of
, and
are as follows:
where and
are the initial water content and the liquid limit of the studied reconstituted clay, respectively.
Zeng, Hong, and Cui (Citation2015) performed 48 consolidometer tests on natural clays, as well as reconstituted kaolinite clays, with different initial water content to assess the inherent compression behaviour of such soils. They used the consolidation test results of their study, as well as the data of earlier research, to suggest equations for estimating the intrinsic constants. They suggested two groups of equations based on the range of . Equations (8) and (9) were developed for the
range of 0.76–2.7, while Equations (10) and (11) were suggested to be used for a broader range of
of 0.66 to 5.72. Density of solid particles of the studied soils varied from 2.65 g/cm3 to 2.75 g/cm3. The initial water content (
) ranged from 22.3% to 163.3% and the liquid limit from 28.1% to 100%:
where and
are the void ratios at initial state and the liquid limit of the investigated reconstituted clay, respectively.
Xu and Yin (Citation2015) investigated the intrinsic compression curves of clays with three different minerals (kaolinite, illite and smectite). The consolidation tests results of their work on the reconstituted samples, with initial water content ranging from 1 to 2 times their respective liquid limits, revealed that the effects of the initial water content on the intrinsic constants of reconstituted clays depended on the type of the clay minerals. For example, their study demonstrated that has less impact on
of the predominant montmorillonite clay than on other secondary clay minerals.
Habibbeygi et al. (Citation2017) performed eight series of consolidation tests on reconstituted samples to investigate the impact of mineralogy on the compressibility of expansive clays. The initial water content of their study ranged from 0.67 to 1.33
, and vertical consolidation stress varied from as low as 1 kPa to as high as 1,600 kPa to consider a broad range of consolidation stress. Their studies depicted that the initial water content had a considerable impact on the intrinsic constants for the studied soil. In fact,
and
increased with increases in the initial water content. Furthermore, the intrinsic constants of the studied clay with smectite as the predominant clay mineral were higher than the estimated values from existing empirical equations.
In summary, it appears that there is a considerable influence of clay mineralogy on the intrinsic constants of a reconstituted clay. While some experimental equations have been proposed to estimate the intrinsic constants of reconstituted clays ( and
) by past researchers (Burland, Citation1990; Yin & Miao, Citation2013; Zeng et al., Citation2015), none of these equations has taken into account the effect of clay mineralogy on the intrinsic constants. Given past research, the main objective of this paper has been to investigate the effect of clay mineralogy on the value of intrinsic constants, and to suggest some equations for estimating these constants and compressibility based on simple, measureable, physical geotechnical parameters considering the influence of clay mineralogy.
3. Estimating the intrinsic constants
To develop some empirical equations that are able to predict values of the intrinsic constants under different circumstances, a large series of 1D consolidation test data was collected in this study to include not only diverse initial states and physical properties, but also the variety of clay mineralogy in the predicting relationships. The collected data were then used to derive some regression models based on the availability of the input data. Finally, the proposed model, including the clay mineralogy, was compared to the existing models, and the influence of each parameter in the model on the response was evaluated for various clay minerals.
4. Experimental data of reconstituted clays
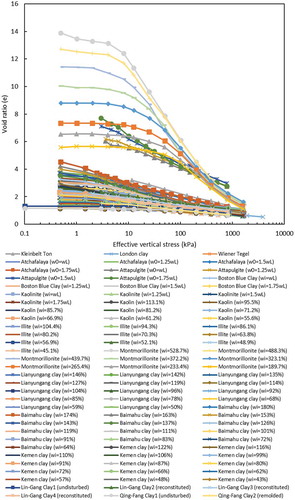
A broad range of experimental data of 94 consolidation tests on various reconstituted/remoulded clays, with different mineralogy and initial water contents, was used in this study. A summary of the geotechnical properties, initial state, and references to these tests is tabulated in Table . Density of soil particles ranged from 2.57 g/cm3 to 2.80 g/cm3 and the initial water content varied from 22.4% to 528.7%. The liquid and plastic limits of the studied soils were in the range of 39.8% to 258.9% and 15% to 42.8%, respectively. As can be seen from Table , the data include three different clay minerals—kaolinite, illite and smectite.
Table 1. Geotechnical properties of consolidometer tests
Figure illustrates the compression curves of all these clays in the form of vs.
relationship. The initial consolidation stress in the tests was as low as 0.5 kPa and reached high stress levels of 1,600 kPa to 4,000 kPa. As expected, most curves are inverse S-shaped, with a distinct remoulded yield stress. Figure shows two sets of curves, separated approximately at
= 5, as there were no samples available at this void ratio. Remoulded yield stress of a reconstituted clay, which is similar to pre-consolidation stress of a natural clay, is a particular stress beyond which the inherent structure of a reconstituted clay breaks down, and the compressibility (the slope of virgin compression line) increases abruptly.
Figure 1. Compression curves of the studied clays in e- space (references for experimental data are listed in Table ).
The compression curves of the studied soils are replotted in a normalised plane, using the void index in Figure ( vs.
). However, there is a considerable disparity between normalised compression curves of reconstituted clays at low stress level; Burland’s equation can express these well when the vertical consolidation stress is higher than the vertical consolidation stress at the remoulded yield stress. A new polynomial equation (Equation 12) has also been fitted to the data with a reasonable correlation coefficient, as high as 0.93, to refine the existing ICL equations:
Figure 2. Normalised compression curves of the studied clays in -
space (references for experimental data are listed in Table ).
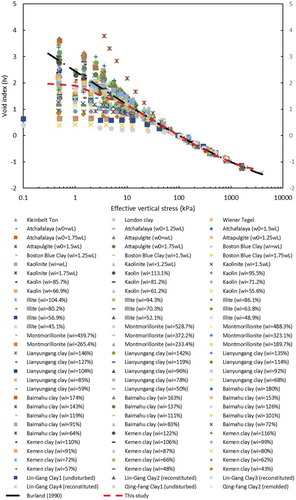
The refined equation, as well as the Burland’s equation, is plotted in Figure for comparison. It is noted that Burland’s empirical equation has been developed for the reconstituted soils, with lower than 4.44, while the proposed equation used data with
up to 7.04. However, Burland’s equation and the refined equation are close to each other for the medium level of effective vertical stress (50–100 kPa), and even overlap for some stresses in this range. The modified equation becomes slightly more concave upwards than Burland’s equation for consolidation stresses higher than 100 kPa. As shown in Figure , there is a disparity between the results of this modified equation (i.e. central fitting of scatter plot) and the experimental data, especially for the low-stress level (i.e. less than 20 kPa). The initial soil sample condition, clay mineralogy, non-linear behaviour of clays, change in the soil permeability, the coefficient of consolidation during consolidation procedure and secondary consolidation are some of the factors that affect the compression curves.
5. Regression models
Following the introduction of the intrinsic concept by Burland (Citation1990), the void index has been used herein to normalise the compression curves and to interpret the compressibility of reconstituted clays. Based on Burland’s work, the compressibility of a reconstituted clay can also be estimated by knowing the values of and
. These two void ratios can also be used to determine the intrinsic compression index (
) and to predict the compression behaviour of a reconstituted clay.
Two simple geotechnical parameters, i.e. the void ratio at initial condition () and the void ratio at liquid limit (
), along with the type of clay mineralogy (
), were adopted as predictors to obtain the empirical equations for estimating the intrinsic constants in this study. As all input parameters may not be available, the following four regression models have been developed based on the degree of availability of geotechnical parameters of the investigated soil:
Model 1: If only the void ratio at the liquid limit () is available.
Model 2: If both the void ratio at the liquid limit () and the initial void ratio (
) are known.
Model 3: If, in addition to the void ratios of ( and
), clay mineralogy (
) is also available.
Model 4: A simplified form of Model 3, which is easier to use without losing much accuracy from Model 3.
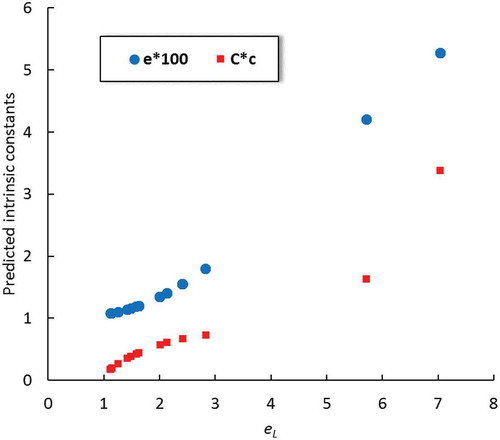
5.1. Model 1
Three different regression models were developed to estimate and
depending on the information obtainable for the studied reconstituted clay. The first model, which is the simplest one, uses only one parameter,
, to estimate the intrinsic parameters. The void ratio at the liquid limit can be calculated by assuming saturated condition for the clayey soil, using the relationship
, where
is the specific gravity, and
is the liquid limit of the studied clay. The equations for this model can be summarised as follows:
The relationship of and the intrinsic constants predicted from this model are illustrated in Figure . The values of intrinsic constants increase continuously when
increases in this model, which is in good agreement with the observed data and the results of past research (Burland, Citation1990; Hong et al., Citation2010).
Figure 3. Plot of intrinsic constants and
against
in Model 1.
5.2. Model 2
In Model 2, the effect of initial state has been applied to the model by adding the initial void ratio into the predicting relationships. The following equations estimate the intrinsic parameters of a reconstituted clay when both initial state () and
are accessible:
5.3. Model 3
In the third model, which is the most sophisticated model to predict intrinsic constants, in addition to initial state parameters, and
, the clay mineralogy is also included. Clay mineralogy of the investigated soil was assumed to be represented by its most predominant clay mineral. Clay was implied into the regression analysis by a dummy parameter named
. Intrinsic equations and the values of dummy parameters of
to
, depending on the type of principal clay mineral, are presented as follows:
It is much easier to use the Wilkinson notation to express the regression equations (Wilkinson & Rogers, Citation1973), as it is a very powerful notation in presenting a complex regression model. The notation is used to present a model in terms of a response and predictors in the form of a simple equation with a table of predictor coefficients. In this notation, stands for constants and each predictor is separated with a symbol of “+”. If there is a powered predictor in the equation, it means that all lower order terms of the predictor are included in the equation, unless otherwise noted. Thus, substituting Equations (19)–(21) yields
where is the categorical invariant of clay mineralogy and can be expressed in this model by two dummy variables,
and
. The coefficients of predictors (
) for this relationship are tabulated in Table .
Table 2. Predictor coefficients of Model 3
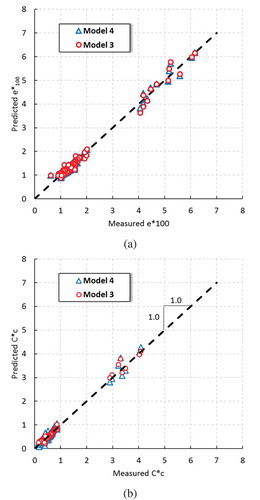
5.4. Model 4
Model 4 is a simplified version of Model 3. The model still considers the clay mineralogy, initial state, and properties of the studied soil, yet it retains its simplicity. Despite the fact the model is simple, it still has a good accuracy in predicting the intrinsic parameters of and
. The correlation coefficients of R2 are 0.99 and 0.85 for
and
, respectively,
Wilkinson notation has been used to express Equations (23) and (24). A symbol of “:” means only the product of two predictors without the lower order terms of the predictor. The coefficient of each predictor and dummy variables are presented in Table .
Table 3. Predictor coefficients of Model 4
6. Comparison and discussion
A comparison of the ability of the proposed models to predict intrinsic constants has been presented in this section. Figure demonstrates the values of predicted and
against the related measured values obtained from the experimental data. It can be seen that the estimated values of
and
are in good agreement with the observed values. Moreover, Model 4 can estimate the parameters accurately even though it has relatively lesser order of terms of predictors than Model 3. A summary of the results is presented in Table . As can be noted, the accuracy of the models increases when the clay mineralogy is considered as an input parameter (Models 3 and 4).
Table 4. R2 of the proposed models for intrinsic parameters (and
)
Figure 4. Comparison of predicted intrinsic constants and measured ones: (a) (b)
.
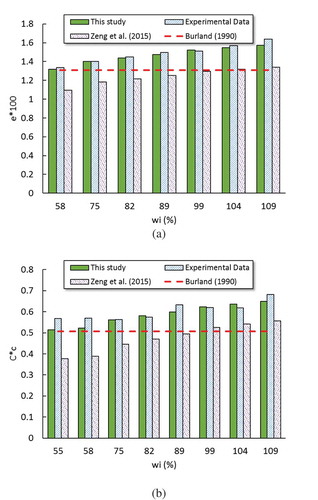
The dataset reported by Habibbeygi et al. (Citation2017) were used to compare the different empirical equations existing in the literature. The and
values of Baldivis clay, estimated for different conditions of initial water content, are plotted in Figure . The geotechnical and physical parameters for the studied clay are presented in Table . According to Burland’s equation, intrinsic constants are independent of the initial state (for example,
or
). Zeng et al. (Citation2015) modified Burland’s equation to consider the effect of the initial state. The values estimated by equations suggested by Zeng et al. (Citation2015) increase with an increase in the value of
, in a trend similar to the observed values. However, both these equations underestimate the intrinsic constants of the investigated clays with a considerable amount of smectite in its mineralogy. On the other hand, as depicted in Figure , the estimated values of intrinsic constants using the proposed model of this study are higher than the predicted values from other methods, and are close to the observed values. Thus, the predicted intrinsic constants from the proposed model are in good agreement with the measured constants for the investigated clay.
Figure 5. Comparison of predicted intrinsic constants by different methods for Baldivis clay: (a) (b)
.
The effect of each predictor on the response of the proposed model has been examined for Model 4. Figure presents the influence of change in each predictor on . As can be seen from Figure ), the change in
has the greatest effect on
among other predictors. It shows that changing
from 0.63 to about 14 increases
by about 3. Moreover, it also shows that changing
from 1.11 to 7 raises
by about 2. Figure ) shows the interaction plot for observing the effect of changing one predictor while keeping others fixed. For example, the increase in
(from 1.11 to 7.0) is much more effective on the growth of
when the principal mineral of clay is smectite, with an increase of 3, whereas the increase of
is just one (1) when the principal clay mineral is illite. Interaction graphs for
and
are plotted in Figure ,) for comparison. The increase in both
and
lead to an increase in
, but with different rates for different clay minerals. For example, the rate of increase of
with
for smectite is the lowest. On the other hand, the rate of increase of
with the increase of
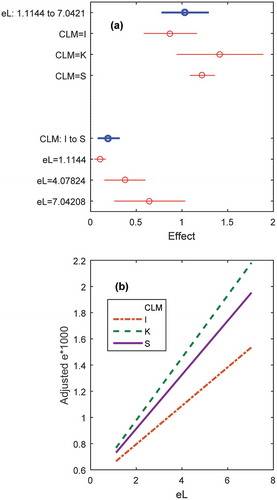
is the highest in smectite. In Model 4,
is only a function of
and its mineralogy. The effects of the variation of these predictors are plotted in Figure . While the increase in
leads to an increase in
, the variation is the least for illite, with a growth of about 0.8.
Figure 6. The effect of predictors on (I: illite, K: kaolonite, S: smectite): (a) predictor effect, (b) predictor effect with CLM, (c)
effect and (d)
effect.
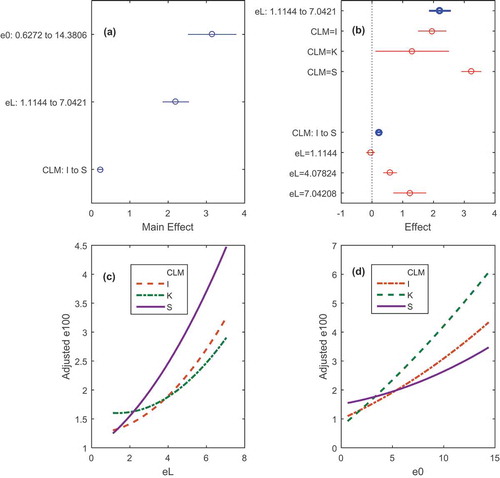
Figure 7. The effect of predictors on (I: illite, K: kaolonite, S: smectite): (a) predictor effect and (b)
effect.
The non-linear compressibility can be explained by the rheological behaviour. Rheological behaviour accounts for the secondary consolidation of clays. The rheological behaviour exists in the primary consolidation and cannot be neglected.
7. Virgin compression line estimation
An advantage of using the void index for normalisation is that it allows estimation of compression curves without performing consolidation tests. In other words, the virgin compression line (VCL) of a reconstituted clay can be determined by substituting the modified equation of ICL (Equation 12) into the void index definition equation (Equation 2) as follows:
where ;
is in kPa, and
is the remoulded yield stress of a reconstituted clay. This equation can be used for a broad range of
(1.1–7.0) and the initial state of
0.63 to 14.38).
Depending on the availability of information about the studied soil, intrinsic constants of and
can be calculated from any of the four models—Models 1 to 4. In cases where the three main physical parameters of clay mineralogy, the initial void ratio and the void ratio at liquid limit are available, Equations (19) and (21) can be used. Otherwise, if clay mineralogy is not known with any degree of accuracy, either groups of equations—Equations (13)–(15) or Equations (16)–(18)—can be used for two different conditions of accessibility to the initial state. Moreover, the void ratio at liquid limit can always be computed by knowing the specific gravity of the investigated soil and the liquid limit. Therefore, the VCL of a reconstituted clay can be computed indirectly, without performing time-consuming laboratory 1D consolidation tests, by knowing simple physical geotechnical parameters.
To sum up, the steps are as follows:
First determine the initial state, including clay mineralogy and the liquid limit of the studied soil;
Secondly, the intrinsic parameters should be estimated by using one of the four proposed models—Models 1 to 4—based on the degree of understanding of the initial state; and
Finally, the VCL can be determined by Equation (25).
The ICL calculated by this method has been plotted for Baldivis clay in Figure for consolidation stress greater than 100 kPa (i.e. stress range higher than the remoulded yield stress of Baldivis clay).
Figure 8. intrinsic compression line of Baldivis clay in -
space (reference for experimental data is listed in Table ).
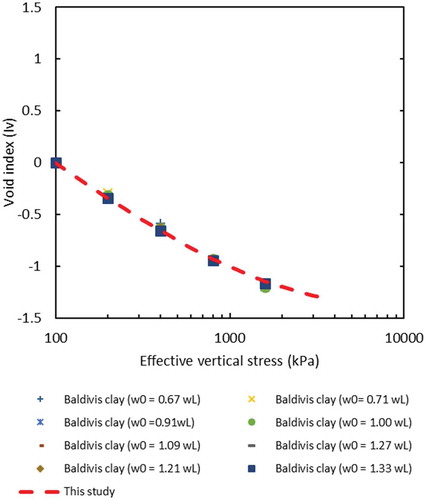
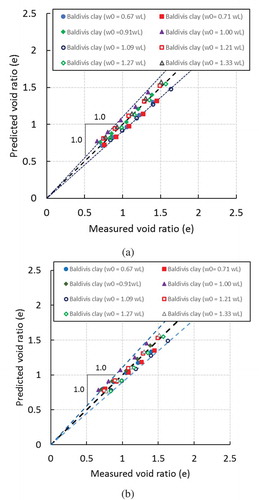
Figure identifies that the refined equation of the void index can satisfactorily predict the void index of the studied reconstituted clay for stresses higher than the remoulded yield stress. Predicted values of the void ratio of Baldivis clay using this method are illustrated in Figure for models 3 and 4. As can be seen, there is good agreement between the measured values and predicted values for both models. The estimated void ratios are in the range of ± 10% of the observed value for the studied soil.
Figure 9. Comparison of estimated and observed void ratios for Baldivis clay (a) Model 3 and (b) Model 4.
8. Conclusions
Based on the intrinsic concept, the compression behaviour of a reconstituted clay can be estimated if the intrinsic constants are known. Four regression models are proposed for estimating the intrinsic constants based on the degree of available data for the studied clay. The proposed models use the maximum advantage of the available data so that when enough information is obtainable, accuracy increases significantly. The results show that the clay mineralogy of a reconstituted clay has a considerable impact on the values of intrinsic constants. The effect of each predictor on the response of the suggested model is also investigated in this paper. The results show that, however, increases with an increase in
for all types of clay minerals, but the increase is greatest in clays with smectite in their mineralogy. On the other hand, it seems that
has a lesser effect on
for a clay with smectite as its principal mineral as compared to other clay minerals. The refined equation of the void index is also used to predict the compression behaviour of a reconstituted clay from Baldivis, Western Australia. The results show that the predicted void ratios are in good agreement with measured values from consolidation tests for a wide range of initial water content. It is recommended that further investigation on the natural clays be carried out through a laboratory testing programme targeted to study the accuracy of the proposed models for a broader range of initial conditions and the clay mineralogy. Remote sensing can be used as a more accurate method for identifying the soil characteristics and the models can accordingly be modified based on the test results.
Acknowledgements
The first author would like to acknowledge the contribution of an Australian Government Research Training Program Scholarship in supporting this research.
Additional information
Notes on contributors
Farzad Habibbeygi
Farzad Habibbeygi is a PhD student at School of Civil and Mechanical Engineering, Faculty of Science and Engineering, Curtin university and a member of Engineers of Australia. His research areas of interest are mechanical and compression behaviour of expansive clays, numerical modelling and artificial neural network. He has also published several research papers in international journals in his area of interest.
References
- Al Haj, K. M. A., & Standing, J. R. (2015). Mechanical properties of two expansive clay soils from Sudan. Geotechnique, 65(4), 258–273. doi:10.1680/geot.14.P.139
- Burland, J. B. (1990). On the compressibility and shear strength of natural clays. Geotechnique, 40(3), 329–378. doi:10.1680/geot.1990.40.3.329
- Butterfield, R. (1979). A natural compression law for soils (an advance on e–Log p′). Geotechnique, 29(4), 469–480. doi:10.1680/geot.1979.29.4.469
- Cerato, A. B., & Lutenegger, A. J. (2004). Determining intrinsic compressibility of fine-grained soils. Journal of Geotechnical and Geoenvironmental Engineering, 130(8), 872–877. doi:10.1061/(ASCE)1090-0241(2004)130:8(872)
- Habibbeygi, F., Nikraz, H., & Chegenizadeh, A. (2017). Intrinsic compression characteristics of an expansive clay from Western Australia. International Journal of GEOMATE, 12(29), 140–147. doi:10.21660/2017.29.20455
- Habibbeygi, F., Nikraz, H., & Verheyde, F. (2017). Determination of the compression index of reconstituted clays using intrinsic concept and normalized void ratio. International Journal of GEOMATE, 13(39), 54–60. doi:10.21660/2017.39.98271
- Hong, Z., & Tsuchida, T. (1999). On compression characteristics of Ariake clays. Canadian Geotechnical Journal, 36(5), 807–814. doi:10.1139/t99-058
- Hong, Z. S. (2006). Void ratio-suction behavior of remolded ariake clays. Geotechnical Testing Journal, 30(3), 234–239.
- Hong, Z. S., Lin, C., Zeng, L. L., Cui, Y. J., & Cai, Y. Q. (2012). Compression behaviour of natural and reconstituted clays. Geotechnique, 62(4), 291–301. doi:10.1680/geot.10.P.046
- Hong, Z. S., Yin, J., & Cui, Y. J. (2010). Compression behaviour of reconstituted soils at high initial water contents. Geotechnique, 60(9), 691–700. doi:10.1680/geot.09.P.059
- Horpibulsuk, S., Liu, M., Zhuang, Z., & Hong, Z.-S. (2016). Complete compression curves of reconstituted clays. International Journal of Geomechanics, 16, 06016005. doi:10.1061/(ASCE)GM.1943-5622.0000663
- Kootahi, K., & Moradi, G. (2016). Evaluation of compression index of marine fine-grained soils by means of index tests. Marine Georesources & Geotechnology. doi:10.1080/1064119x.2016.1213775
- Lee, C., Hong, S.-J., Kim, D., & Lee, W. (2015). Assessment of compression index of Busan and Incheon clays with sedimentation state. Marine Georesources & Geotechnology, 33(1), 23–32. doi:10.1080/1064119x.2013.764947
- Lei, H., Wang, X., Chen, L., Huang, M., & Han, J. (2015). Compression characteristics of ultra-soft clays subjected to simulated staged preloading. KSCE Journal of Civil Engineering. doi:10.1007/s12205-015-0343-y
- Mesri, G., & Olson, R. E. (1971). Consolidation characteristics of montmorillonite. Geotechnique, 21(4), 341–352. doi:10.1680/geot.1971.21.4.341
- Mitchell, J. K., & Soga, K. (1976). Fundamentals of soil behavior (Vol. 422). New York, NY: University of California. Berkeley, John Wiley & Sons Inc.
- Nagaraj, T., & Miura, N. (2001). Soft clay behaviour analysis and assessment. Rotterdam, Netherlands: A. A. Balkema.
- Nagaraj, T., & Murthy, S. (1983). Rationalization of Skempton’s compressibility equation. Geotechnique, 33(4), 433–443. doi:10.1680/geot.1983.33.4.433
- Sridharan, A., & Gurtug, Y. (2005). Compressibility characteristics of soils. Geotechnical & Geological Engineering, 23(5), 615–634. doi:10.1007/s10706-004-9112-2
- Sridharan, A., & Nagaraj, H. (2000). Compressibility behaviour of remoulded, fine-grained soils and correlation with index properties. Canadian Geotechnical Journal, 37(3), 712–722. doi:10.1139/t99-128
- Takashi, T. (2015). e-log σv’ relationship for marine clays considering initial water content to evaluate soil structure. Marine Georesources & Geotechnology. doi:10.1080/1064119x.2015.1113577
- Wilkinson, G., & Rogers, C. (1973). Symbolic description of factorial models for analysis of variance. Applied Statistics, 22(3), 392–399.
- Xu, G., Gao, Y., Yin, J., Yang, R., & Ni, J. (2014). Compression behavior of dredged slurries at high water contents. Marine Georesources & Geotechnology, 33(2), 99–108. doi:10.1080/1064119x.2013.805287
- Xu, G.-Z., & Yin, J. (2015). Compression behavior of secondary clay minerals at high initial water contents. Marine Georesources & Geotechnology, 34(8), 721–728. doi:10.1080/1064119x.2015.1080333
- Yin, J., & Miao, Y. (2013). Intrinsic compression behavior of remolded and reconstituted clays-reappraisal. Open Journal of Civil Engineering, 03(03), 8–12. doi:10.4236/ojce.2013.33B002
- Zeng, -L.-L., Hong, Z.-S., Cai, Y.-Q., & Han, J. (2011). Change of hydraulic conductivity during compression of undisturbed and remolded clays. Applied Clay Science, 51(1–2), 86–93. doi:10.1016/j.clay.2010.11.005
- Zeng, -L.-L., Hong, Z.-S., & Cui, Y.-J. (2015). Determining the virgin compression lines of reconstituted clays at different initial water contents. Canadian Geotechnical Journal, 52(9), 1408–1415. doi:10.1139/cgj-2014-0172