
 ?Mathematical formulae have been encoded as MathML and are displayed in this HTML version using MathJax in order to improve their display. Uncheck the box to turn MathJax off. This feature requires Javascript. Click on a formula to zoom.
Abstract
This paper examines the dynamic interactions between insurance and economic growth in eight African countries for the period of 1970–2013. Insurance demand is measured by insurance penetration which accounts for income differences across the sample countries. A Bayesian Time Varying Parameter Vector Auto regression (TVP-VAR) model with stochastic volatility is used to analyze the short run and the long run among the variables of interest. Using insurance penetration as a measure of insurance to economic growth, we find positive relationship for Egypt, while short-run negative and long-run positive effects are found for Kenya, Mauritius, and South Africa. On the contrary, negative effects are found for Algeria, Nigeria, Tunisia, and Zimbabwe. Implementation of sound financial reforms and wide insurance coverage are proposed recommendations for insurance development in the selected African countries.
Public Interest Statement
The contributions of financial institutions such as banks and stock markets have been researched extensively in the financial literature. However, little or no knowledge about the contributions of insurance activities to economic growth has been given in the literature. Yet, given the huge contribution of insurance to the economy as a whole, little is known about the contribution of insurance to the economy in African countries. To individuals, insurance purchase enables an individual to sustain his continuous consumption of his property in the case of theft or damaged. Firms on the other hand can engage in high-risk investment and receive high returns as a result of pool of risk involved by insured. To the Government, on the other hand, expenditure on damages caused by natural disasters such as fire, flood, and other natural disasters is reduced if not eliminated due to insurance purchase.
1. Introduction
The growing share of the insurance sector in the aggregate financial sector in almost every developing and developed country has shifted attention to insurance-growth nexus. The insurance markets have witnessed a tremendous growth in the last decade with the world premium in US dollars increased by 175% between the year 2000 and 2008, significantly outpacing worldwide economic growth (Outreville, Citation2011). The worldwide insurance premium volume in 2009 was US$4.06 trillion equivalent to 7% of the global GDP (International Insurance fact book, Citation2010). World insurance premiums rose by 6 percent from $4.3 trillion in 2010 to $4.57 trillion in 2011, according to Swiss Reinsurance Company (Citation2015) latest study of world insurance. It rose by 2.4 percent from $4.57 trillion in 2011 to $4.61 trillion in 2012 and it rose by 1.4 percent to the tune of $4.64 trillion by 2013.
These developments led research scholars to begin to focus on the link between insurance and growth. Indeed, several studies have found evidence that the development of insurance sector is related to economic growth and the key elements in the economic development of a country (Soo, Citation1996; Ward & Zurbruegg, Citation2000; Arena, Citation2008; Curak, Loncar, & Poposki, Citation2009; and Avram, Nguyen, & Skully, Citation2010). Many studies have equally tried to examine insurance-growth relationship in Africa. These studies are Mojekwu, Agwuegbo, and Olowokudje (Citation2011), Akinlo (Citation2012), Eze and Okoye (Citation2013), Alhassan and Fiador (Citation2014). One of the shortcomings of these previous studies is the use of the volume of premium as a measure of insurance development, which is not adequate in capturing actual insurance activities.
In this study, the sample countries were chosen based on availability of common long data span, and it was observed that the insurance penetrations (volume of premium divided by the gross domestic product of each county) show variations across the selected countries. For instance, insurance penetration, as a measure of insurance demand, shows large variations among the selected African countries. It was 0.76, 0.73, 2.84, 3.32, 0.4, 5.26, 1.33, and 3.88% for Algeria, Egypt, Kenya, Mauritius, Nigeria, South AfricaFootnote1, Tunisia, and Zimbabwe, respectively, in 1980. In 1990, it was 1.02% for Algeria, 0.77% for Egypt, 2.63% for Kenya, 3.20% for Mauritius, 0.55% for Nigeria, 9.89% for South Africa, 1.41% for Tunisia, and 3.84% for Zimbabwe (Swiss Reinsurance Company, Citation1990). By 2013, there have been some tremendous variations among the African countries. In 2013, insurance penetration in Algeria has declined to 0.68%, it was also 0.68% for Egypt, 3.41% for Kenya, 5.84% for Mauritius, 0.36% for Nigeria, 15.4% for South Africa, 1.76% for Tunisia, and 1.5% for Zimbabwe (International Insurance fact book, Citation2015). Therefore, the relationship between insurance purchase and economic growth in the selected countries is better analyzed individually given the large variations of the insurance penetration among the sample countries.
Furthermore, from the methodological perspective, the literature suggests that prior studies in both developed and developing countries have employed constant parameter models in the insurance–growth nexus. And given the recent global financial crises and various financial reforms, in form of recapitalization and consolidation that have been initiated in the sample countries, then a time varying parameter model that is capable of capturing the effects of these policy changes on the economies should be adopted. For this purpose, a Bayesian method adequate in handling the time varying parameters in the Time Varying Parameter Vector Auto regression (TVP-VAR) is employed.
This paper, therefore, using insurance penetration as measures of insurance activities in Africa, provides a robust measure of insurance activities with more samples and a time-varying model analysis. The remaining part of the paper is constructed as follows. Section 2 provides overview of insurance development in the selected countries, literature review is presented in section 3, section 4 contains the methodology, theoretical model, data measurement and sources, and the Bayesian TVP-VAR modeling. Section 5 presents the estimation results and discussions of the results while Section 6 provides conclusion and policy implications.
2. Trends of insurance development in the selected African countries
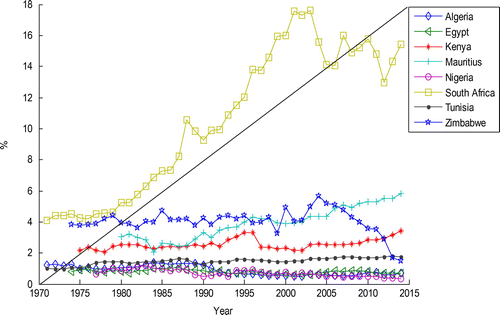
In the process of comparative analysis of each selected African countries, it is necessary to provide brief trend overview on the level of insurance sector development in these countries. This is necessary to help understand the financial and economic background of these countries. Figure shows that the insurance penetrations of all the sample countries are below the 45 degree trend line except for South Africa that is above the line. The trend analysis reveals that insurance demand varies in African countries and is still relatively low compared to their counterparts in Asia and Europe except for South Africa.
Figure 1. Treand of insurance penetration of selected African countries.
3. Literature review
The relevant literature on the relationships between insurance and growth is reviewed as follows. Beenstock, Dickinson, and Khajuria (Citation1988) apply pooled time series and cross section analysis on 1970 to 1981 data, covering mainly 12 countries. They regress premiums for property liability insurance on Gross National Product (GNP), income, and interest rate development. They find that premium are correlated to interest rate and GNP, marginal propensity to insure for both short- and long-run rise with income per capita and was higher in the long run. They conclude that insurance consumption was not affected by economic cycles or cyclical income variation.
For Organization for Economic Cooperation and Development (OECD) countries, Ward and Zurbruegg (Citation2000), on the other hand, examine the potential causal relationship between economic growth and insurance market activity for nine OECD countries for the period 1961–1996. Using annual real GDP as a measure of economic activity and annual real total written premiums as a measure of insurance activity, the author uses the VAR-error correction methodology on a country by country basis to find the presence of a long-run relationship for five countries (Australia, Canada, France, Italy, and Japan). The authors only find causation for three countries (Australia, Canada, and Japan).
Kugler and Ofoghi (Citation2005) evaluate both a long-run relationship and Granger-causality between insurance market size and economic growth for the United Kingdom using net written premium for each insurance market (general and long-term insurance) in the UK for the period 1966–2003. Using Johansen cointegration test, the authors find a long-run relationship between development in insurance market size and economic growth for all insurance components. Regarding causality tests, there is evidence of long-run causality from growth in insurance market size to GDP growth for eight out of nine insurance categories that are considered. Webb, Grace, and Skipper (Citation2005) analyzed the effect of banking and insurance on the growth of capital and output based on cross-country data of 55 countries for the period from 1980 to 1996. The insurance variable is measured by average insurance penetration (insurance premium relative to GDP). At the first stage of ordinary least square (OLS) estimation, assuming exogenous financial variables indicate positive effect of banking development on economic growth. The results of simultaneous equations, assuming endogenous relationship between financial activity and economic growth, show that higher levels of banking and life insurance penetration predict higher rates of economic growth.
In the same vein, Arena (Citation2008) study on causal relationship between insurance market activity and economic growth included 56 countries (both developed and developing ones) in the period from 1976–2004. Insurance premiums are used as proxies of total and life and non-life insurance activity separately. As an estimation method, the author used generalized method of moment (GMM) for dynamic models of panel data. The result shows a positive and significant effect of total, life, and non-life insurance market activity on economic growth. Impact of life insurance on economic growth is driven by high-income countries only. In the case of non-life insurance, its impact was driven by both developed and developing countries, but it is larger in developed countries than in the developing ones.
Haiss and Sümegi (Citation2008) on the other hand apply a cross-country panel data analysis from 29 European countries in the period from 1992–2005. The insurance variable is measured by premium income and total net investment of insurance companies. Premium income was split into life and non-life premium income. An estimation of Ordinary Least Squares (OLS) on unbalanced panel was done for the EU-15 countries, Switzerland, Norway, and Iceland, while non-life had a larger impact in Central and Eastern Europe. Wadlamannati (Citation2008) equally examines the effects of insurance growth and reforms along with other relevant control variables on economic development in India in the period from 1980–2006. Growth of insurance penetration (life, non-life, and total) was used as proxies of insurance sector growth. The author applied ordinary least squares, cointegration analysis, and error correction models. The study confirms a positive contribution of insurance sector to economic development and a long-run equilibrium relationship between the variables. While the reforms in the insurance sector do not affect economic activity, its growth has positive impact on economic development.
Similarly, using GMM, Liyan, Donghui, Fariborz, and Yanghui (Citation2010) investigate the relationship between insurance development and economic growth on a dynamic panel data-set of 77 economies for the period 1994–2005. Insurance density is used to measure the development of insurance. They conclude that insurance development is positively correlated with economic growth. The sample, which was divided into developed and developing countries, showed that the overall insurance development, life ,and non-life insurance development play a much more important role for developing countries than they do for the developed countries.
Han, Li, Moshiran, and Tian (Citation2010) studied the relationship between insurance development and economic growth using a dynamic panel data model on 77 countries for the period 1994–2005. The insurance density is used to measure the development of the insurance; they concluded that the development of insurance is positively correlated with economic growth. The estimated sample is then divided into developed and developing countries. For developing economies, the development of insurance is more important than that played in the case of developed economies. Likewise, Kjosevski (Citation2011) examined the impact of insurance on economic growth using the insurance penetration as a measure of insurance development, three variables were used: life insurance penetration, penetration non-life insurance, and total insurance penetration. The analysis used data for the period 1995–2010 of the Republic of Macedonia using the OLS technique, followed by an analysis of the variability in order to identify the effects of each variable. The result of this analysis shows that the development of total insurance sector positively affects economic growth; this result is confirmed in non-life insurance, while the results show that life insurance negatively affects economic growth.
In another panel study, İlhan and Taha (Citation2011) examined the role of insurance in economic growth using 29 countries between 1999 and 2008. The countries are Australia, Austria, Belgium, Canada, Czech Republic, Denmark, Finland, France, Germany, Greece, Hungary, Iceland, Ireland, Italy, Japan, Turkey, South Korea, Luxemburg, Mexico, Holland, Norway, Poland, Portugal, Slovakia, Spain, Sweden, Switzerland, England, and United States. The result shows that there is a positive relationship between insurance and economic growth in the sample countries.
Chien-Chiang (Citation2011) disaggregated real insurance premiums into life and non-life insurance premiums to examine the interrelationship between insurance market activities and economic growth for 10 selected OECD countries between 1979–2006. Panel unit-root tests, heterogeneous panel cointegration tests and panel causality techniques are all employed and the conclusion is that there is fairly evidence favoring the hypothesis of a long-run equilibrium relationship between real GDP and insurance market activities. The non-life insurance market has a greater impact on the real GDP than the activities of the life insurance market. The causality test of the dynamic panel-based error correction model indicates long-run and short-run bidirectional causality.
Pei-Fen, Chin-Chiang, Chun-Ping, and Lee (Citation2011) investigate the effect of life insurance (using penetration and density measure) on economic growth and what conditions affect the insurance-growth nexus such as economic, financial, demographic, income level, and regional conditions. The authors employ the two-step system GMM of dynamic model for 60 countries. The result shows that the development of the life insurance market has a positive effect on economic growth. The conditional variables of middle-income countries, sub-Saharan Africa, savings, the real interest rate, social security, the stock market turnover ratio, and the young dependency ratio alleviated the positive impacts of the development of the life insurance market on growth. By contrast, the conditional variables of low-income countries and Latin America strengthen the positive impact of life insurance market on growth. Horng, Chang, and Wu (Citation2012) carried out the relationship among insurance, financial development, and economic growth for Taiwan. The paper found economic growth to granger cause insurance demand and financial development to granger cause economic growth both in the short run.
Zouhaier (Citation2014) examines the relationship between the insurance business and the economic growth of 23 OECD countries over the period 1990–2011, using a static panel data model. The key findings emerged from the empirical analysis show a positive impact of non-life insurance, as measured by the penetration rate on economic growth and a negative effect exerted by the total insurance and non-life insurance, as measured by the density on economic growth.
In Nigeria, Mojekwu et al. (Citation2011) examined the impact of insurance contributions on economic growth in Nigeria over a 27-year period, between 1981 and 2008 using a dynamic factor model. The proposed technique describes a number of methods designed to analyze a functional but unobservable random quantities called factors. The factor loadings indicate which common trend is related to which set of time series. The result obtained shows a positive relationship between insurance contribution, measured the volume of premium and economic growth in Nigeria.
In addition, Akinlo (Citation2012) examines the effects of insurance on economic growth in Nigeria during the period of 1986 to 2010. The structure, growth of insurance subsectors, and the direction of causality between insurance and economic growth in Nigeria were addressed in the study. An error-correction model analysis and cointegration technique was adopted in the analysis. The cointegration technique shows that all the variables apart from premium are highly significant. The coefficient of premium was significant at 10%. The findings of the study indicate insurance measured as premium, has a positive significant influence on economic growth, and that there is a long-run relationship between insurance and economic growth in Nigeria.
Omoke (Citation2012) makes use of insurance density (premium per capita) as a measure for insurance market activity and real GDP for economic growth in Nigeria between 1970 and 2008. The study also employs control variables such as inflation and savings rates as other determinants of growth. The Johansen cointegration and vector error correction approach were used to estimate the relationship among the variables. The finding of the study is that insurance does not reveal any positive and significant effect on economic growth in Nigeria within the period of study. The result shows low-insurance market activity and development in Nigeria. In their paper, Eze and Okoye (Citation2013) use cointegration test and error correction model to examine the impact of insurance practice on the growth of Nigerian economy. Insurance premium capital, total insurance investment, and insurance sector development are used as measures of insurance development. The paper concludes that there is a significant positive effect of insurance practice on the growth of Nigerian economy.
Yinusa and Akinlo (Citation2013) analyzed both the long- and short-run relationships between insurance development and economic growth in Nigeria over the period 1986–2010. Using error correction model (ECM), the study finds that insurance development is cointegrated with economic growth in Nigeria. There is a long-run relationship between insurance development and economic growth in Nigeria. The results also show that physical capital and interest rate both at contemporary and one lagged value have significant positive effect on economic growth in Nigeria, while physical capital and inflation have negative long run relationships with economic growth. The results generally indicate statistically significant contribution of insurance to economic growth in Nigeria.
Alhassan and Fiador (Citation2014) examined long-run causal relationship between insurance penetration and economic growth for Ghana during the period of 1990–2010. The authors used autoregressive distributed lag (ARDL) bounds approach to cointegration by Pesaran, Shin, and Smith (Citation1996, Citation2001). The study found a long-run positive relationship between insurance penetration and growth. A unidirectional causality was found from aggregate insurance penetration to growth on one hand and life and non-life insurance penetration to growth on the other hand.
A panel study by Akinlo and Apanisile (Citation2014) examined the relationship between insurance and economic growth in sub-Saharan Africa over the period 1986–2011. Pooled OLS, Fixed Effect Model, and Generalized Method of Moment Panel Model were employed in the estimation. The estimations of the dynamic panel data results show that insurance has positive and significance impact on economic growth in sub-Saharan Africa. This shows that premium contributes to economic growth in sub-Saharan Africa which means that a well-developed insurance sector is necessary for the economic development, as it provides long-term investments for economic growth and simultaneously strengthening risk-taking abilities.
Recently, Olayungbo (Citation2015) investigated the asymmetric non-linear relationship between insurance and economic growth in Nigeria from 1976 to 2010. The conclusion is that asymmetric effect is present in Nigeria’s insurance market. Also, unidirectional causality runs from positive GDP growth to negative insurance premium growth. In addition, the robustness results, using variance decomposition and impulse response with control variables, show that low insurance promotes high growth in Nigeria. The impulse responses also show the presence of an asymmetric relationship between low insurance and high growth in Nigeria. In conclusion, from the insurance-growth literature, it is clear that studies on African countries are scarce. To the best of our knowledge, no known study has employed time-varying parameter VAR in the analysis of the relationship between insurance demand and growth. Our paper, therefore, fills this gap in the insurance-growth literature.
4. Theoretical framework and model
The neoclassical growth theory of Solow (Citation1956) is adopted in this paper. It assumes a one-sector production technology in which output is a homogeneous good that can be consumed or invested. Here, the economy is closed. In a closed economy with no public spending, all output is devoted to consumption or investment by households i.e. Y(t) = C(t)+ I(t). By subtracting C(t) from both sides gives the amount saved as S(t) = Y(t) - C(t), equals the amount invested, I(t). Given that saving must equal investment, S(t) = I(t), it follows that the saving rate equals the investment rate. In other words, the saving rate of a closed economy represents the fraction of the GDP that an economy devotes to investment. The Cobb–Douglas production function that provides a reasonable description of the actual economies can be represented as:(1)
(1)
The Cobb–Douglas production function can be written in intensive form to derive output (GDP) per capita as:(2)
(2)
From Equation (2), the steady state equationFootnote2 is:(3)
(3)
Substituting Equations (3) into (2) gives:(4)
(4)
Where lnyt is the growth of GDP per capita, lnA0 + gA is the growth of technology and other factors such as natural resources, climate, and institutions, is the saving rate, which is the saving rate proxy by insurance penetration. In Africa, the premiums collected by the insurance companies are invested as saving in the capital markets or banks and other interest-bearing assets depending on the contractual term. These savings are then made available as loans to investors for investment purposes into machines, tools, and other investment purposes which are translated to economic growth. Insurance premium does not contribute to the GDP directly but through the productive capacity it provides to investors in form of loan to them.
are the growth of technology, population growth (proxy by percentage of urban population to total population), and depreciation, while ɛt represent country-specific shock (Favero, Citation2000). Equations (Equation4
(4)
(4) ) can be written in econometric term as:
(5)
(5)
Where parameter β0 captures the term ,
is
and β2 represents
. According to Mankiw, Romer, and Weil (Citation1992), (gA + δ) is not directly observable, as a result, we are left with population,
.
4.1. Data source and variable measurement
Our paper uses annualFootnote3 secondary data for the period of 1970–2013. The annual data on insurance penetration for both life and non-life insurance demand are sourced from Swiss Re Sigma Database (Citation2014) based on common data availability for the sample African countries. The data on Gross Domestic Product (GDP) per capita and urban population growth are sourced from World Development Indicator (Citation2014). The urban population is measured as a percentage of the total population of each selected African countries. The urban population growth is used because in Africa, insurance penetration is better measured in the urban areas because there is virtually no insurance market in the rural areas. The percentage of urban population to the total population is to account for the proportion of the urban population to total population that has access to insurance across the selected countries. The real GDP per capita is measured in US dollar by dividing the monetary value of goods and services produced in each country by its population using 2005 as the base year. The real GDP per capita is used to account for the standard of living of each African country. Insurance penetration is a measure of insurance demand on both life (long-term) and non-life (General) insurance premium. It is obtained by the ratio of direct premium written to nominal Gross Domestic Product (GDP) expressed in percentage. It indicates how much each inhabitant of a country spends on average on insurance. Penetration measures insurance consumption relative to the size of the economy by adjusting for income. It should be noted that as insurance premium increases and income is unchanged, insurance penetration would reduce. The response of insurance penetration to increase in premium equally depends on the type of insurance, as some types of insurance are mandatory. For instance, motor vehicle insurance is compulsory for vehicle owners and increase in the premium may not reduce its purchase.
4.1.1. Descriptive statistics of the eight African countries
The descriptive statistics of the eight African countries are presented in Tables –. It is shown that the values of the mean and median are close. The closeness suggests that the distribution is nearly symmetrical. The presence of symmetry indicates the existence of low variability and normal distribution. The values of the skewness, kurtosis, and the standard deviation being close to zero also provide information about the symmetrical nature of the distribution of our data. The Jarque–Bera, as a goodness of fit, also shows that the skewness and kurtosis are matching the normal distribution in most of the data. All these descriptive parameters imply smooth distribution of our data. Only the GDP per capita and the urban population variable are in logarithmic form.
Table 1. Descriptive statistics for Algeria
Table 2. Descriptive statistics for Egypt
Table 3. Descriptive statistics for Kenya
Table 4. Descriptive statistics for Mauritius
Table 5. Descriptive statistics for Nigeria
Table 6. Descriptive statistics for South Africa
Table 7. Descriptive statistics for Tunisia
Table 8. Descriptive statistics for Zimbabwe
4.2. Time-Varying Parameter Vector Auto regression Model (TVP-VAR)
The application of TVP-VAR, over the constant parameter VAR, stems from the idea that policies such as recapitalization and consolidation have been implemented in the sample countries at different times. Therefore, if economic policies vary over time, then it should have potential effects on these economies. Many prior studies such as (Canova, Citation1993), (Sims, Citation1993), (Stock & Watson, Citation1996), (Cogley & Sargent, Citation2003), (Primiceri, Citation2005 for the US), (Benati & Mumtaz, Citation2005 for the UK) (Canova & Gambetti, Citation2009), (Canova & Ciccarelli, Citation2009), (Koop, Leon-Gonzalez, & Strachan, Citation2009), and (Nakajima, Citation2011 for the Japanese economy) are well developed literature on modeling and estimating time-varying VAR in multivariate linear structure. In 2008, in a more general term, Footnote4many economies also went into recession and many of the associated policy discussions suggest that the parameters in VARs may be changing again (Koop & Korobilis, Citation2010). The basic structural TVP-VAR can be written as:(6)
(6)
The disturbance ut is a structural shock, equals to
assumed to be
) and time-varying where A is a lower triangular matrix with ones on the main diagonal and with
a diagonal matrix, where:
Equation (6) can further be expressed as:(7)
(7)
In reduced forms, the Equation (7) can be written as Equations (8) and (Equation9(9)
(9) ):
(8)
(8)
(9)
(9)
The coefficient , the parameter at and
are all time-varying with stochastic volatility, hjt = log
. Following Primiceri (Citation2005) and Nakajima (Citation2011), the coefficients and the parameters follow a random walk process as:
(10)
(10)
(11)
(11)
(12)
(12)
Where and uht are i.i.d and jointly normally distributed with the variance and co-variance matrix as:
(13)
(13)
From the model in Equation (5), , the vector ordering of our variables are:
(14)
(14)
where lnyt is lnGDPpercap, is lninspen while
is lnurbanpop. Given our vector variables in Equation (Equation14
(14)
(14) ), the structural identification model of 3 by 3 variable case is specified as:
(15)
(15)
where lnurbanpop, lninspen and lnGDPpercap are percentage log of urban population to total population, log of insurance penetration and log of per capita GDP with matrix A being a lower matrix. The variable vectors in Equation (Equation14(14)
(14) ) are used in the estimation of the Bayesian TVP-VAR model separately for each of the eight African countries.
4.2.1. Bayesian inference
The treatment of the hyper parameters i.e. the unobservable states, βt, at and as time-varying and random variables necessitates the use of Bayesian method of estimation (Koop, Citation2003 and Geweke, Citation2005). In Bayesian inference, the posterior distribution is proportional to the likelihood function times the prior distribution. The posterior distribution computed by Baye’s theorem in continuous form can be written as:
(16)
(16)
The prior density represents our beliefs about θ prior to having the data y. f(y|θ) denotes the likelihood function. The posterior distribution can further be stated in proportionality form as:
(17)
(17)
Given the hyper parameters to be estimated, the posterior distributionFootnote5 is:(18)
(18)
Where
and the likelihood is:
(19)
(19)
(20)
(20)
(21)
(21)
Given the likelihood function and the prior distributions, we estimate the posterior distribution using the Markov Chain Monte Carlo (MCMC) sampling methods. The MCMC allows the function of the parameters such as the impulse response function and posterior means to be estimated. We draw samples from the posterior distribution, given
and
using the MCMC algorithm presented in the Appendix 1.
4.2.2. Choice of priors and calibrations
In choosing our priors, we also follow Nakajima (Citation2011). Flat priors are set for the initial state from the standpoint that we have no information about the initial state apriori. The inverse gamma distributions, a family of two parameters, are used as priors alongside of the variance of the normal distribution to ensure precisionFootnote6. In Bayesian statistics, the inverse gamma distribution serves as the conjugate prior of the variance of a normal distribution Nakajima (Citation2011). The prior choices are summarized as follows:(22)
(22)
For the initial state of the time-varying parameters, flat priors are set; β0 = a0 = h0 = 0 and Nakajima (Citation2011).
5. Empirical results
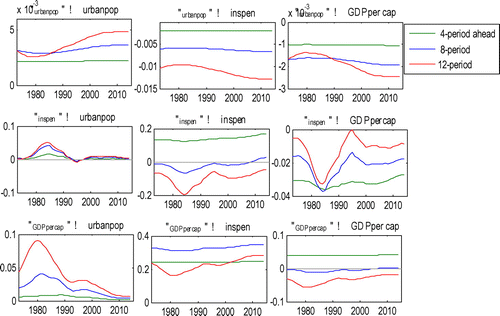
After ensuring the stationarity of our variables and determining the optimal lag lengthFootnote7 based on Akaike Information Criterion (AIC), Bayesian Information Criterion (BIC), Schwartz Criterion and Hannan–Quinn Criterion (HQC), we follow Nakajima (Citation2011)Footnote8 by generating 10,000 draws from the posterior, and after which the initial 1,000 samples are discarded as burn-in. We present the impulse responses of the relationships between insurance demand and economic growth for each country from Figure –Footnote9 as follows.
Figure 2. Impulse responses for Algeria.
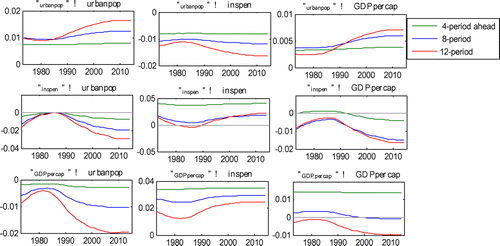
Figure 3. Impulse responses for Egypt.
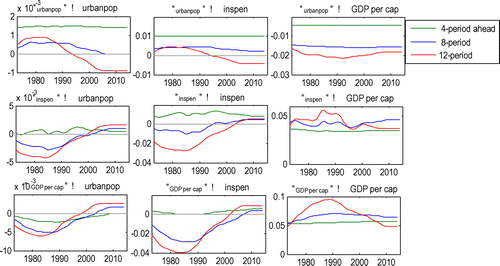
Figure 4. Impulse responses for Kenya.
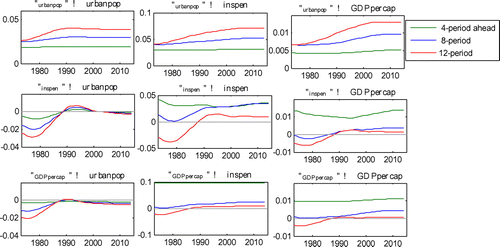
Figure 5. Impulse responses for Mauritius.
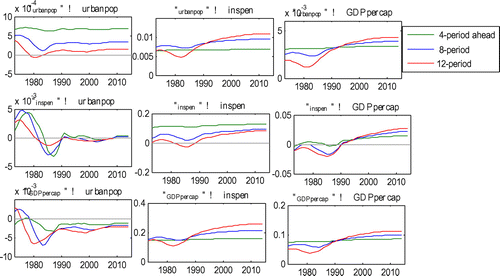
Figure 6. Impulse responses for Nigeria.
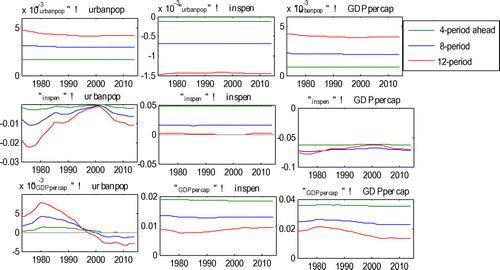
Figure 7. Impulse responses for South Africa.
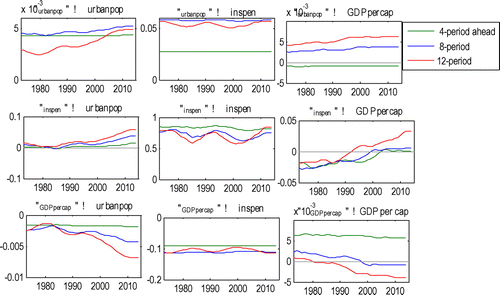
Figure 8. Impulse responses for Tunisia.
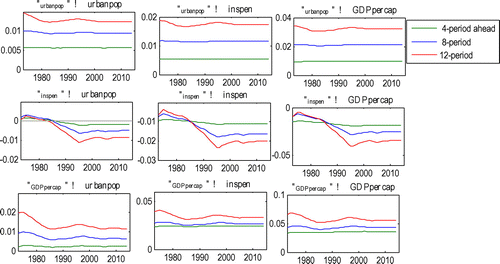
Figure 9. Impulse responses for Zimbabwe.
5.1. Discussion of results
The dynamic relationship between insurance demand and economic growth, using insurance penetration as a measure of insurance demand shows that positive relationship only exists in Egypt throughout the period of study in Figure . The positive effects of insurance to GDP in Egypt are around 0.05% over the sample period. However, short-run negative and long-run positive relationships are found for Kenya, Mauritius, and South Africa, while negative response of GDP to insurance demand are found for Algeria, Nigeria, Tunisia, and Zimbabwe. The short-run negative and long-run positive effects for Kenya range from -0.01% to 0.01% over the sample period. For Mauritius, the dynamic effects are higher as they range between -0.05% and 0.05%. For South Africa, the dynamic effects range from -0.02% to 0.05%. The negative responses of GDP to insurance demand in Algeria are around -0.01%, the negative responses are bigger in Nigeria and Tunisia with -0.05% while the responses are between -0.02 and -0.03 in Zimbabwe. The small and negative effects of GDP to insurance demand in these countries can be attributable to low level of insurance penetration in these countries.
The average steady economic growth of 4.0% in Egypt might be the explanation of the positive response of GDP to insurance development in the country. The positive result is reasonable for South Africa being the country with the highest insurance penetration in Africa (see Figure ). Mauritius also has been ranked first in sub-Saharan Africa in terms of ease of doing business World Bank’s Doing Business Survey and being the fastest and most dynamic growing economy in the region. Mauritius is also second in terms of insurance penetration among the sample countries (see Figure ). These factors, coupled with moderate insurance penetration, might have been responsible for the positive response of GDP to insurance in the long run in this country. In Kenya, insurance penetration is moderate compared to other African countries like Tunisia, Nigeria, and Algeria. The perception of Kenya as the financial hub in the Eastern and Central Africa by foreigners might have increased her insurance penetration from 0.10% to 2.8% by 2010. This might have led to the long-run positive effects of insurance on growth in this country in Figure . For Algeria, with negative effects of insurance demand on growth in Figure , the low growth rate of 2.6% in Algeria in the past six years (African Economic Outlook, Citation2009) coupled with low-insurance penetration, might be responsible for the long-run negative effects on growth. Negative effects are also found in Nigeria, Tunisia, and Zimbabwe in Figure , , and respectively. Although, insurance premium is growing in Nigeria, however, insurance penetration has been very low. Nigeria has the lowest insurance penetration in the sample country. The low-insurance penetration in Nigeria confirms the same conclusion by Omoke (Citation2012) that found low-insurance effects on economic growth in Nigeria. In Tunisia and Algeria, government control and ownership of insurance companies and non-liberalization of the insurance sector could be the likely reasons for the negative effects of insurance on growth in these two countries. Lastly, existence of high-inflationary pressure, which erodes purchasing power, could also be the likely reason for the negative effect of insurance demand in Zimbabwe. High inflation rates reduce the real income of the people which may then reduce their insurance purchase and hence its negative effects on growth. In summary, the relationship between insurance demand and economic growth using insurance penetration which accounts for income changes is positive for Egypt, negative for Algeria, Nigeria, Tunisia, and Zimbabwe. On the contrary, we found short-run negative effects and long-run positive effects for Kenya, Mauritius, and South Africa.
6. Conclusion and policy implications
Prior studies have employed either bank or stock variables in the analysis of the relationship between finance and growth in developed and developing countries neglecting insurance. From the trend analysis, we can infer that insurance density and insurance penetration are still relatively low in the sample countries except for South Africa. In overall, insurance demand promotes growth in Egypt, Kenya, Mauritius, and South Africa while insurance demand has negative effects for growth in Nigeria, Tunisia, and Zimbabwe. Consequence upon our results, we recommend that given the relatively low-insurance culture and development in most of the sample countries, efforts and policies should be geared towards the awareness and education on the benefits of insurance demand. Secondly, financial reforms and insurance policies such as recapitalization and consolidation policies that can sustain and deepen insurance market should be pursued by the government and the insurance regulatory authorities of these countries. This is important especially for African countries that are characterized by government ownership of insurance companies and opposed to liberalization reforms. Lastly, compulsory insurance demand scheme can be implemented for private, government workers, and all vehicle owners in these countries.
However, this paper is not without limitation. There is therefore the need for expansion of the scope of study to cover the supply side of the insurance market and the segmentation within the overall insurance market. In the future, General Equilibrium Models such as Computable General Equilibrium (CGE) model or Dynamic Stochastic Generalized Equilibrium (DSGE) model that can capture the two sides of the market may be explored.
Additional information
Funding
Notes on contributors
D.O. Olayungbo
David Oluseun Olayungbo is currently a lecturer I in the Department of Economics, Obafemi Awolowo University, Ile-Ife Nigeria. Olayungbo, who had his PhD in Economics in 2014, has published several articles on banking and finance. He teaches macroeconomics, monetary, banking, and finance at both undergraduate and graduate levels at the university. The research reported in this paper will help government of African countries to see the need for high insurance coverage or penetration in the region.
A.E. Akinlo
Anthony Enisan Akinlo, who is a full Professor of Economics in the university, specializes in monetary and macroeconomics with many publications in reputable journals to his credits. He supervised Olayungbo’ PhD thesis. This paper is a part of the thesis. Akinlo is a renowned and erudite scholar who has published several articles in high rated journals. He has supervised several PhDs in monetary and financial economics.
Notes
1. It should be noted that colonial heritage and the colonial settlers in South Africa contribute greatly to the huge insurance development in the country. South Africa consists of both white and black race. The whites are Afrikaans and English-speaking, while the blacks are Africans, Coloreds, and Indians. South Africa was ranked second with 13.87% after Taiwan and ahead most developed in the world in terms of insurance penetration in 2005 (Swiss Re Sigma Database, Citation2011).
2. Explicit derivations of the steady state of capital per worker, k*, from the intensive form of the Cobb Douglas production function can be found in Mankiw et al. (Citation1992), Romer (Citation1986) and Solow (Citation1956).
3. Rathke and Sarferaz (Citation2010) also used annual data with a Bayesian TVP-VAR for England.
4. There were many structural changes in the selected African countries to mention few. For instance, in Nigeria, there were structural changes in 1986 with the introduction of Structural Adjustment Programme (SAP), change from long military rule to democratic government in 1999, and a recapitalization policy in the insurance and banking sector in 2005. Also in South Africa, the elimination of Apartheid regime had significant impact in the economy.
5. For detailed joint posterior distribution and the multi-move sampler see, Primiceri (Citation2005) and Nakajima (2011)
The lag length results are not provided in this analysis due to space constraints and they are available upon request.
6. Convergence diagnostic checks such as Geweke diagnostic, inefficiency factors, sample autocorrelation, mean, standard deviations, and interval estimates are common parameters in Bayesian TVP-VAR to measure the unbiasedness, independence of draws and ultimately the efficiency of results. See, Carter and Kohn (Citation1994), Cogley and Sargent (Citation2003), Primiceri (Citation2005), and Nakajima, Citation2011 for details and similar models.
7. In the time-varying VAR analysis, lag length of 2 using the Schwartz Criterion (SC) was found to be optimal and used for the eight African countries.
8. The Matlab codes developed by Nakajima, 2011 was used in the analysis. It is available upon request.
9. Geweke diagnostic and inefficiency factor of each the eight selected African countries are not presented due to space constraints. They are all available upon request.
References
- African Economic Outlook, 2009. OECD Development Centre. 2, rue André Pascal 75775 Paris Cedex 16, France. Paris: African Development Bank with the headquarter in France.
- Akinlo, T. (2012). Effects of insurance on economic growth in Nigeria. (an unpublished M.Sc Thesis, Department of Economics, Obafemi Awolowo University, Ile-Ife, Nigeria.
- Akinlo, T., & Apanisile, O. (2014). Relationship between insurance and economic growth in Sub-Saharan African: A panel data analysis. Modern Economy, 5, 120–127. doi:10.4236/me.2014.52014.
- Alhassan, A. L., & Fiador, V. (2014). Insurance-growth nexus in Ghana: An autoregressive distributed lag bounds co-integration approach. Review of Development Finance, 4, 83–96. doi:10.1016/j.rdf.2014.05.003.
- Arena, M. (2008). Does insurance market promote economic growth? A cross-country study for industrialized and developing countries Journal of Risk and Insurance, 75, 921–946.
- Avram, K., Nguyen, Y., & Skully, M. (2010). Insurance and economic growth: A cross-country examination (Working Paper). Clayton: Monash University, Dept of Accounting and Finance.
- Beenstock, M., Dickinson, G, & Khajuria, S. (1988), The relationship between property-liability insurance penetration and income: An international analysis, The Journal of Risk and Insurance, 55, 259–472.
- Benati, L., & Mumtaz, H. (2005). “The great stability in the U.K.”: Good policy or good luck? Mimeo: Bank of England.
- Canova, F. (1993). Modelling and forecasting exchange rates with a Bayesian time-varying coefficient model. Journal of Economic Dynamics and Control, 17, 233–261.10.1016/S0165-1889(06)80011-4
- Canova, F., & Ciccarelli, M. (2009). Estimating multicountry var models. International Economic Review, 50, 929–959.10.1111/iere.2009.50.issue-3
- Canova, F., & Gambetti, L. (2009). Structural changes in the US economy: Is there a role for monetary policy? Journal of Economic Dynamics and Control, 33, 477–490.10.1016/j.jedc.2008.05.010
- Carter, C. K., & Kohn, R. (1994). On Gibbs sampling for state space models. Biometrika, 81, 541–553.10.1093/biomet/81.3.541
- Chien-Chiang, L. (2011). Does insurance matter for growth: empirical evidence from OECD countries. The B.E. Journal of Macroeconomics, 11, 18.
- Cogley, T., & Sargent, T.J. (2003). Drifts and volatilities: Monetary policies and outcomes in the post WWII U.S. (Mimeo: New York University).
- Curak, M., Loncar, S., & Poposki, K. (2009). Insurance sector development and economic growth in transition countries. International Research Journal of Finance and Economics, 34, 29–41.
- Eze, O.R, & Okoye. V. (2013). Analysis of insurance practices and economic growth in Nigeria: Using co-integration test and error correction model. Global Advanced Research Journal of Management and Business Studies, 2, 63–70.
- Favero, C. A. (2000). Applied macroeconometrics. Oxford: Oxford University Press.
- Geweke, J. (2005). Contemporary Bayesian econometrics and statistics. New York, NY: Wiley.10.1002/0471744735
- Haiss, P., & Sümegi, K. (2008). The relationship between insurance and economic growth in Europe: A theoretical and empirical analysis. Empirica, 35, 405–431.10.1007/s10663-008-9075-2
- Han, L., Li, D., Moshiran, F., & Tian, Y. (2010). Insurance development and economic growth. The Geneva Paper, 35, 183–99.
- Horng, M., Chang, Y., & Wu, T. (2012). Does insurance demand or financial development promote economic growth? Evidence from Taiwan Applied Economics Letters, 19, 105–111.10.1080/13504851.2011.568386
- İlhan, E., & Taha, B. (2011). The relationship between insurance sector and economic growth. An econometric analysis. International Journal of Economic Resources, 2(2), 1–9.
- International Insurance Fact Book, 2010. Retrieved from www.iii.org/publication/international-insurance-fact-book-2010
- International Insurance Fact Book, 2015. Retrieved from www.iii.org/publication/international-insurance-fact-book-2015
- Kjosevski, J., (2011). Impact of insurance on economic growth: The case of Republic of Macedonia. European Journal of Business and Economics, 4, 34–39.
- Koop, G. (2003). Bayesian econometrics. Hemel Hempstead: Wiley-Inter science.
- Koop, G., & Korobilis, D. (2010). Bayesian multivariate time series methods for empirical macroeconomics. Foundations and Trends in Econometrics., 267–358.
- Koop, G., Leon-Gonzalez, R., & Strachan, R. (2009). On the evolution of the monetary policy transmission mechanism. Journal of Economic Dynamics and Control, 33, 997–1017.10.1016/j.jedc.2008.11.003
- Kugler, M., & Ofoghi, R. (2005). Does insurance promote economic growth in Europe: A theoretical and empirical analysis. Empirica, 35, 405–431.
- Liyan, H., Donghui, L., Fariborz, M., & Yanghui, T. (2010). Insurance development and economic growth, The International Association for the Study of Insurance Economics, 35, (1018–5895).
- Mankiw, N. G., Romer, D., & Weil, D. (1992). A contribution to the empirics of economic growth. The Quarterly Journal of Economics, 107, 407–437.10.2307/2118477
- Mojekwu, J. N., Agwuegbo, S. O. N., & Olowokudje, F. F. (2011). The impact of insurance contribution to economic growth in Nigeria. Journal of Economics and International Finance, 3, 444–451.
- Nakajima, J. (2011). Time-varying parameter var model with stochastic volatility: An overview of methodology and empirical applications. Bank of Japan: Monetary and Economic Studies.
- Olayungbo, D. O. (2015). Insurance and economic growth nexus in Nigeria: Asymmetric non-linear relationship under heterogeneous agents. African Development Review, 27, 248–261.10.1111/afdr.v27.3
- Omoke, P. C. (2012). Insurance market activity and economic growth: Evidence from Nigeria. Asian Economic and Financial Review, 1, 245–253.
- Outreville, J.F., (2011, July 14). The relationship between insurance growth and economic development: 80 Empirical Papers for a Review of the Literature. (ICER Working paper No.12/2011). Canada: HEC Montreal
- Pei-Fen, C., Chin-Chiang, L., Chun-Ping, C., & Lee, C. (2011). How does the development of the life insurance market affect economic growth? Some international evidence, Journal of International Development. (Working Paper).
- Pesaran, M.H., Shin, Y, & Smith, R. J. (1996). Testing for the existence of a long-run relationship. Department of Applied Economics Working Paper No.96220. Cambridge: University of Cambridge.
- Pesaran, M. H., Shin, Y., & Smith, R. J. (2001). Bounds testing approaches to the analysis of level relationships. Journal of Applied Econometrics, 16, 289–326.10.1002/(ISSN)1099-1255
- Primiceri, G. E. (2005). Time varying structural vector autoregressions and monetary policy. Review of Economic Studies, 72, 821–852.10.1111/roes.2005.72.issue-3
- Rathke, A., & Sarferaz, S. (2010). Malthus was right: New evidence from a time-varying VAR. Institute for Empirical Research in Economics. (Working Paper No.47). Switzerland: University of Zurich.
- Romer, P. M. (1986). Increasing returns and long-run growth. Journal of Political Economy, 94, 1002–1037.10.1086/261420
- Sims, C. A. (1993). Business cycle, indicator and forecasting (pp. 179–204). Chicago, IL: University of Chicago press for the NBER.
- Solow, R. (1956). A contribution to the theory of economic growth. The Quarterly Journal of Economics, 70, 65–94.10.2307/1884513
- Soo, H. H. (1996). Life insurance and economic growth: Theoretical and empirical investigation. (Ph.D. Dissertation). University of Nebraska, Department of Economics, Lincoln, NE.
- Stock, J. H., & Watson, M. W. (1996). Evidence on structural instability in macroeconomics time series relations. Journal of Business and Economics Statistics, 14, 11–30.
- Swiss Re Sigma Database. (2014). Zurich: Swiss Re Economic Research and Consulting.
- Swiss Reinsurance Company, (1990). Zurich: Sigma Publication, No. 5/2006.
- Swiss Reinsurance Company, (2015). Zurich: Sigma Publication, No. 5/2006.
- Wadlamannati, K. C. (2008). Do insurance sector growth and reforms effect economic development, empirical evidence from India. Journal of Applied Economic Research, 2, 43–86.
- Ward, D., & Zurbruegg, R. (2000). Does insurance promote economic growth? Evidence from OECD countries The Journal of Risk and Insurance, 67, 489–506.10.2307/253847
- Webb, I., Grace, M. F., & Skipper, H. (2005). The effect of banking and insurance on the growth of capital and output. Journal Financial issues, 2(2), 1–32.
- World Development Indicator (2014). Washington, DC: The World Bank. 1818 H Street N.W. Washington, D.C. 20433, USA.
- Yinusa, D. O., & Akinlo, T. (2013). Insurance development and economic growth in Nigeria, 1986-2010. Journal of Economics and International Finance., 5, 218–224. doi:10.5897/JBF2013.0498.
- Zouhaier, H., (2014). Insurance and economic growth. Journal of Economic and Sustainable Development, 38, 249–264.
Appendix 1
1. Algorithm of the Markov Chain Monte Carlo simulation.
Given the likelihood and the prior distributions, we estimate the posterior distribution using the Markov Chain Monte Carlo (MCMC) sampling methods. We draw samples from the posterior distribution , by the following MCMC algorithm:
i. Initialize and θ.
ii. Sample
iii. Sample
iv. Sample
v. Sample
vi. Sample
vii. Sample
viii. Go to 2.
Step i–viii are under gone recursively to generate {and y} in the TVP regression model, see (Nakajima, Citation2011 and Primiceri, Citation2005)