
 ?Mathematical formulae have been encoded as MathML and are displayed in this HTML version using MathJax in order to improve their display. Uncheck the box to turn MathJax off. This feature requires Javascript. Click on a formula to zoom.
Abstract
In the paper, we make an attempt to estimate the size of informal economy on the base of micro-data. Two main approaches are described and compared. They are implemented on the base of an RLMS sample for 2012. The first method, called single equation approach, is based on the specific category of household expenditures and the arbitrarily defined household type (self-employed or employee). The second method allows to obtain the results for income under-report for both wage income and self-employment income, and uses information on all the household current consumption categories. The single equation model is restricted to one expenditure category and two types of households, although it enables to perform the estimation on different subsamples of households with various socioeconomic characteristics. The comparison of the system of equations approach with single equation is made concerning the scale of informal economy and the role of wage-income under-report, which is possible to obtain through the system.
Public Interest Statement
The paper provides an introduction to the micro-based methods to estimate the size of informal economy, with the help of the reported information of the amount of goods consumed by a household and its income. This approach is alternative to the macro approaches to estimate the informal economy and in some cases it enables to provide comparative results, as far as the informal economy has monetary estimation (a share of concealed income). The edge of the method is the flexibility to take into account the socio-demographic characteristics of the household, as far as its income structure.
1. Methods to estimate the informal economy: Literature review
Black economy is by definition the activity concealed from law. So it will not be indicated in the official revenue documents. Although, if we are looking at the revenue surveys, they may include some information about the black economy activities, but to some extent, because people still have some incentives to conceal black economy activities. Therefore, researches may try to estimate the part of the economic activity which is treated as the black economy. One of the ways to estimate the black economy is microeconomic approach and is based on the data obtained from households budget surveys. The key idea is that the households indicate their expenditures more accurately than they indicate their income.
Actually, the main idea of the authors Pissarides and Weber (Citation1989) is that (1) the reporting of expenditure on some items by all groups of population is accurate; (2) the reporting of income by some groups of the population is accurate. The income reporting is accurate not by some groups, but by some types of occupation of the population. The authors believe that the expenditure item which is recorded correctly is the expenditures on food (the less likely to conceal). The under-report of income comes from the people who are self-employed. Employees report their income correct. Although this may look like a strong assumption that only the self-employed are those who under-report their income, because for most of the people to indicate the wage expenditures is not always reasonable. They may obtain other wages which are not indicated in the responses to the questionnaire.
In the article written by Lyssiotou, Pashardes, and Stengos (Citation2004) the authors actually use the method of Pissarides and Weber (Citation1989) proposed in 1989 to estimate single food expenditure equation. But the authors go further n the estimation proposing the two other methods of black economy estimation.
The basic way of developing the model of Pissarides and Weber used by the authors is to include in the analyses the demand for durable goods. By dividing the demand into the demand for durable and the demand for non-durable goods one may notice that the share of income a household spends on durable goods depends not only on the level of income, but on the income source. Therefore, self-employment income may indicate not only income under-report, but the preference heterogeneity: self-employed people may tend to spend more on expensive goods (consumption of durable goods), therefore they are spending too little on food and other non-durable goods.
Another reason why the self-employment income is not a good proxy for the utility is that it tends to be more volatile, therefore, it influences savings. Households spend less and earn more than employees to meet the precautionary savings.
Estimation of the size of informal economy in Turkey estimated by Aktuna, Starzec, and Gardes (Citation2011) is based on the model proposed by Lyssiotou et al. (Citation2004). But now the authors assume that a household has three forms of income: wage income, self- employment and other income. The other income seems to be reported correctly, while the other income components may be hidden. Another enlargement is that the preference heterogeneity term depends on the share of each part of the income (the heterogeneity is viewed in the form of difference in savings between different occupation groups and consumption patterns).
The estimated system of equations is actually the same. The difference is that the system is estimated by generalized method of moments and the household production activities are included in the system in the form of household consumption and household production. So the initial model is enlarged and includes the consumption of household goods and the income from their production evaluated by the market price.
2. The basic models description
Let us describe the basic model as it is presented by Pissarides and Weber. The variables reported by the households: (1) consumption of individual items Cij (i is the household index, j is the index of the index of the consumption item); (2) after-tax income ; (3) vector of household characteristics Zi. According to our assumptions, there is under-report of the level of income for households in self-employment. Denote by ki the coefficient by which a household i is underreporting their income. Then the connection between the actual and reported income is written in the following form:
. So ki = 1 for employees and ki > 1 for the self-employed. The expenditure function of item j is written in the following form:
. It is needed to note the definition of
. We denote by this the measurement of the income influencing consumption decisions. The relation between the permanent and actual income is measured by
. This parameter accounts for the variation of income due to the unforeseen circumstances. The mean of pi does not depend on the type of the household and is the same for the employees and the self-employed. On the other hand, the variation of the parameter is different depending on the type of a household:
. If the household is self- employed, then the variation of this parameter is higher, reflecting the higher variation of the self- employed income. That is why current consumption is a function of not a current income, but the permanent income.
Therefore, permanent income, which is directly related to the consumption function, can be decomposed into current income and the parameters of the model through the following way:
This implies existence of the two additional random regressors in the model if we put into the model observed income instead of the permanent income. To verify statistical hypothesis the authors must make assumptions concerning the statistical distribution of the coefficients responsible for the income mismatch. The coefficients have log-normal distribution. So now write them in the form of deviations from their means:ln pi = μp + ui, ln ki = μk + vi. Now the trick performing the connection between the mean of pi and the mean of its logarithm, . As far as the mean of pi does not depend on the type of the household, one may compare the mean of the log for the employees and the self-employed:
. How one can use this fact? Let us put the error terms decomposition into the expenditure function. Then we obtain the following decomposition of permanent income
.
This decomposition can be used for the expenditure function.
Then, . The dependent variable is the household expenditures on some particular item. In authors model food expenditures will be considered. The idea of this quite simple model is to obtain income differences for the self- employed. If this equation is estimated separately for employees and self- employed then the intercepts differ as far as μkse − μkee is not the same at each group. This constant term may give information on the size of black economy.
To estimate this relationship the following type of regression model was used:
, where
is a dummy variable taking value “1” if the individual is self-employed, and zero if he is employee. This model can be straightforward estimated by the method of least squares, accounting for the heteroscedasticity of error term ξij. But how can we exactly compute the level of income under-reporting with the help of this model?
According with the theoretical income decomposition for the expenditure function the coefficient γj must be equal to the term . The estimated coefficient equals:
.
The income decomposition enables us to perform the reduced-form regressions for income. Therefore the observable income can be decomposed in the following form: . Due to the income decomposition, we obtain that
. From the expression
we have
, then
.
We get the lower bound for mean under-reporting if ; the upper bound of mean under-reporting is obtained when
is minimized. Having the income variance decomposition and assuming that the error terms u and v are not correlated we can determine the bounds for the level of income under-reporting. They are as follows:
With the help of this decomposition the interval for the level of income under-reporting can be obtained, since we have estimated the model of expenditures and computed the income variations.
To perform the system of equations estimation it is needed to separate the consumption between durable and nondurable goods. The cost functions of consumption are defined: , where
denote the sub-cost functions. Using this function one can depict household expenditure on the ith good:
The budget share of good i in the expenditures on nondurable goods, .
The authors impose the unit cost of nondurables . It has a quadratic logarithmic form:
Using this function by differentiating one can obtain Hiksian shares of the demand denoted above. This can be parameterized with the following function
.
Given the cost function we can see that the expression is directly linked to the level of income of a household through the indirect utility function, so authors make linear decomposition of this expression as a function of
where
is the true household income. As the result Hiksian demand shares can be written as:
where the parameters are a function of Hiksian demand shares parameters, the price index is dropped, since the prices are fixed at the level pi = 1, ri = 1 for all i. The label h denotes a household, the label i denotes a good in the consumer bundle. This is the theoretical foundation for the Engel curve, since the consumption share depends on income as a quadratic function. The quadratic form of the Engel curve means that since the income of a household increases it tends to spend more expenditure share on luxury goods and less expenditure share on necessities.
The advantage of this model is that there is no need to arbitrary impose the type of a household. This can be seen through the following income decomposition: , where θk- kth component of income.
The share of income earned by a household from a certain income source is computed, this is denoted by . The total real income of a household equals
. Dividing both part of the equation by the observable income:
. This helps to rewrite the Engel curve equation:
(1) The model is more complex than one considered by Pissarides and Weber (Citation1989). But it can be linked to the model of Weber if one can impose a certain threshold in the share of household’s self-employment income:
The equation for the commodity i according to Pissarides and Weber looks like:
This equation is estimated for the category of goods for which the income is reported the most correctly. This category is food expenditures.
Actually in the article the following model is estimated, almost similar to Pissarides and Weber:
The problem is that the expenditure on the left-hand side is actually varies along with not only the total income, but with the type of the household. Thus reflecting the preference heterogeneity:
The single equation approach does not distinguish these effects, that is why it is limited. The system approach can cope with this difficulty and is performed by the authors.
Estimating the size of informal economy in Russian Federation we are not computing the value of household production since we do not know the amount of time used on a certain activity. But there is the information on the household production of the agricultural goods. The money income from the goods sold is actually included in the household total income. The information of goods consumed is added to the goods consumption data to form full expenditures.
On the first stage it is possible to estimate a single food expenditure equation and to see whether an income decomposition and the black economy coefficient can be obtained. To say in advance, there are some problems concerning both the income decomposition and the estimation of this coefficient. Therefore, the more complicated econometrician estimation methods should be used.
3. RLMS database description
Russian Longitudinal Monitoring Survey is the only annual nongovernment monitoring of social-economic characteristics of the population of Russian Federation and the health conditions (NRU-HSE, Citation2012).
The key peculiarity of RLMS is the wide-spread base of socioeconomic variables. The variables include the income and expenditure structure, material welfare, investment, occupation, migration, health conditions, structure of food consumption, education. The cross-sectional data is combined with the panel.
Our attention is devoted to the study of households of cross-sectional analyses. The analyses is made on representative sample for the household in the 21st wave. The 21st wave of RLMS household budget survey has been conducted from October 2012 to December 2012.
The following individual variables are used: family status, occupational status, level of education, level of life satisfaction, presence of some stomach deseases, desire to find another job, presence of children in the household, number of children in the household, ability of a household to improve the living conditions, ability of a household to have a vacation with all members of the family, ability of a household to pay for a child study in the University, presence of some other job at one member of the household.
The comparison of individual characteristics of the households with no income from self-employment and with high level of self-employment income can be seen in the Table .
Table 1. Individual characteristics descriptive statistics (%)
Considering the family status self-employed are usually single than married. They are more involved in the non-qualified labor, both for the head and other members. They have lower level of education: both higher education (33.55 vs. 39.05%) and secondary special education (37.74 vs. 42.49%). They report a bit more higher level of life satisfaction (17.10 vs. 15.29%). The greater part of them does wish other job (39.57 vs. 29.71%). But they do not in general indicate that they have other job (maybe they conceal their shadow part of income, or simply do not have other job for which to be paid). The characteristics concerning the households are as follows: place of living, living conditions, some variables concerning land use, educational questions.
There can be made no conclusion that self-employed have a greater amount of durable goods and therefore that their wealth is higher. Maybe that is due to the fact that the ownership of these goods are not reported in the interview.
Despite this, some conclusions can be made. The self-employed tend to be more settle in the village (33.2 vs. 24.8% and 21.2% non_se), and also have more share of people which sell their products grown (5.7 vs. 2.2% and 1.1% non_se). Less part of self-employed have phone (49.2 vs. 63.4% and 59.3% non_se) Therefore, maybe some part of their income may be the agricultural income from the selling of products. Also as we have mentioned in the literature review the agricultural goods consumption shall be included is household foods product consumption to provide unbiased value of food consumption. This is the point to correct our model.
4. Income decomposition
An important part of our study is to see how income is decomposed between the different sources among the households. First of all, the total income of the household consists of three parts: (1) wage income free of taxes; (2) the part such as other income usually fixed income; (3) income from self-employment. The last one is actually computed as a difference between total income of a household, the wage income and the income from all other sources. So the formula by which the income is built is looking as follows:
The other income of a household includes: pension; scholarship; unemployment benefit; income from equity sold; income from rent of equity; capital income in the form of the interest; capital income in the form of the dividend; insurance premium; aliments; money from the debt reimbursement; subsidies from the appartment payment. Actually the inclusion in this form the income from equity sold does not prove to be reasonable, because it is not a permanent source of income and therefore may be misleading.
Speaking about the income from capital (to the capital income we must denote the income from rent of equity, capital income in the form of interest and capital income in the form of dividend) we notice that there is very low rate of response (only 150 people have indicated that they have got income in some of the forms). This can be explain twofold: (1) most of respondents conceal the real amount of capital income because of the fact that they do not want to give any information about the total amount of capital owned; (2) the capital forms of income are not so popular in our country with comparison to the households in the western countries. We must say that other income computed using the information on capital income is under-reported. Therefore, the self-employment income as it is defined must include some forms of capital income.
We exclude income from equity sold from the items including in “other income”. The wage income, other income and total income provide the basis for the computing of self-employment income. The description of household income decomposition can be seen in Table .
Table 2. Descriptive statistics of income decomposition
According to the descriptive statistics table, the mean value of wage income is the greatest among all the mean values of various income sources: households who get wage report that they earn on the average 33,700 rubles, whereas the mean for other income accounts for 13,478 rubles, self employment income is on average 9,405 rubles, and one must take into account the fact that this mean is only above those, who happen to have positive amount of income (near 45% of the households). So on average, the income from self-employment is much less than the wage income.
Coming to the variations of different components of household income we must notice that the assumptions proposed by Weber are fulfilled: self-employment part of income is much more relative variant. What does it mean? Although the variance of wage income is more than the variance of income from self-employment, the relative variance, or the variance related to the mean, is much greater for those who are self-employed (2.33 vs. 0.89). On the other hand, the relative variance of other income, which is defined above and consists of the sum of pensions, scholarships and so on, is the least (0.71).
For those households who have self-employment income one can perform a histogram of the income share distribution (condition if the share > 0)—Figure .
Figure 1. The density of self-employment share of income distribution (self-employment income >0).
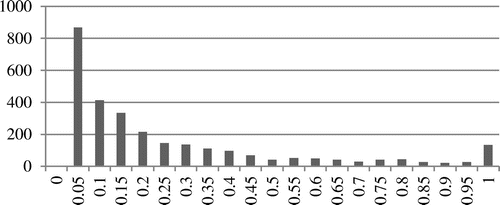
We can see that the distribution of the share of the self-employment income in the total income of household is skewed towards 1. It means that even if a household has some self-employment income, the majority of the households is still having it as a minor source of income.
Now we must determine the criteria, by which the household is self-employed. Following Webber, the criteria is such that the share of income from self-employment is greater than some threshold value. In our model this value is defined with the help of histogram of income share distribution. Let us say that this value is 0.2 (in the paper authors take the value of 0.25).
Here there are the descriptive statistics of income decomposition for households with self-employment income (Table ). Households with high self-employment income have mean higher total income and slightly less mean other income. We have seen earlier that self-employment income has higher coefficient of relative volatility than wage income. Surprisingly this is not true for our types of households with positive income from self-employment. Wage income tends to have the same volatility as income from self-employment, but even higher relative volatility for those who are self-employed. But total income for self-employed part of sample is anyway more volatile (in absolute and relative terms). To sum up, the hypothesis of income variance holds but only for the total income variance (except for the variance in wage income).
Table 3. Income decomposition descriptive statistics for the households with positive income from self-employment, grouped by the share of self-employment income in total income
Concluding with the descriptive statistics analyses we must say that the income of Russian households does not necessarily come with the British households income behavior. Especially it can be seen that wages may be as much volatile as self-employment income. This fact says that maybe some new estimation methods should be implemented to estimate the size of black economy. The sample has been divided into three groups: non self-employed, people with low share of self employment income and people with high share of self-employment income (or self-employed).
5. Expenditure decomposition
As far as we know from the theory, the household expenditure can be decomposed into the expenditure on durable and nondurable goods. The items we are interested in are food expenditures, clothes expenditures, service expenditures (all of them form the expenditures on nondurable goods). The durable goods expenditures are also needed and include expenditures on household appliances (see Table ).
Table 4. Descriptive statistics for household expenses, including the consumption of household-produced goods
For households with positive income from self-employment, there is a high degree of heterogeneity in expenditures. All expenditures for the self-employed are higher for all categories than the average for the entire sample (excluding expenditures on food), and higher than expenditures by households with a low proportion of income from self-employment. On the other hand, total income for the self-employed is also significantly higher (whereas the average household incomes from other parts of the sample is not significantly different). The question for the research is whether the differences in expenditures are attributable to stated income or is there some portion unaccounted for which is part of the shadow economy?
Household consumption includes goods produced for a household’s own consumption, and it is higher for self-employed households. This is more closely associated with the significant number of self-employed in farming households, for which this type of consumption is most characteristic rather than concealed income. Cash expenditures on food for the self-employed households and the others do not vary greatly.
6. The one equation model estimation
At the first stage of econometric estimation we shall estimate the single equation of expenditures on a selected expenditure category (food), as far as the expenditures on food are reported the most correctly. The model is estimated in logarithms; the estimated specification is linear according to classical theoretical model. This model allows to apply the OLS estimation. The functional form of food equation is as follows:
As the result of food equation estimation the variable corresponding to the type of a household proved to be not significant at 10% level. The possible explanation for this is that the differences in product consumption are fully attributed to the differences in the household characteristics, the impact of income is weak as far as the income elasticity is very low—the household tends to increase consumption up to a certain degree as far as the income increases.
This means that it is impossible to estimate the size of informal economy on the base of food equation. However, it is possible to implement the single equation approach with different categories of household expenditures. The idea of the choice of the expenditure category is the same: the expenditures should be reported correctly, and be the function of total income of a household, but not of the structure of income (thus we can estimate the single equation correctly). That is why, the service expenditures cannot be used, which include transport and are related to the workplace; on the other hand the clothes expenditures meet both restrictions, and that is why they can indicate the level of household welfare.
For the basis sample to estimate clothes expenditure model the sample including all the households is used.
The general model (model of all households with positive expenditures on clothes—full model) includes all households from 21st wave of RLMS. The purpose of the research is to define how the estimate of shadow economy share varies dependent on the socioeconomic characteristics of an individual (the occupation of household members, family status and the classification of a household both on occupation and family status). According to this approach the following subsamples are obtained:
On the base of occupation status: (2) households, some member of which is qualified; (3) households none of the members is a qualified worker, but has a job, therefore is a nonqualified worker;
On the base of family status: (4) households, living in a couple; (5) lonely people;
On the base of both qualification and family status: (6) lonely qualified; (7) lonely and nonqualified; (8) couple and some of the couple members is a qualified worker; (9) couple and both of the couple members are nonqualified; (10) couple and the head of the household is qualified; (11) couple, but only woman is qualified; (12) couple and the head of household is nonqualified;
The question is what sample should be used to compute the size of informal economy. The first basic sample represents all the households, while the second one is the sample of households with positive income from self-employment. The second sample is important since it focuses on households with certain part of self-employment income and therefore for whom the status “self-employed” can be given. For each of the two basic samples the size of shadow economy shall be computed (which is according to the hypothesis of Pissarides & Weber, Citation1989).
In Table you can see the estimates of the size of informal economy for both samples.
Table 5. The informal economy size estimation for two samples—first (full) and second (people with positive income from self-employment)
The mean estimates of concealed income share grow when the size of informal economy is computed for the “short” sample of households with only positive income from self-employment. The amount of shadow economy estimated grows for the model as far as the share of self-employed people is greater. The mean share of income concealed depending on the base sample varies from 2.9 to 6.4%. For the lonely nonqualified the estimated value is close to 20%, which is more realistic estimate of the size of shadow economy.
7. The system of equations estimation
The obtained results of the estimation of single equation have four main drawbacks: (1) do not account for the nonlinearity; (2) do not account for the preference heterogeneity; (3) do not account for the wage under-report of a household; (4) impose the fixed type of a household—either “employee” or “self-employed”. The system of equations of consumer budget shares approach allows to estimate the more complicated model, which allows to take into account the effects of the substitution of goods in dependence on the household income and type of employment. However, in the paper the simplified mode of Engel budget shares has been estimated, with no preference heterogeneity term and linear specification. This helped to obtain efficient estimates of the coefficients.
The equation of the expenditures on the category “i” is written in the following form:
The system is estimated on the basis of current consumption, as well as it is reported more correctly then the consumption of durable goods. The following expenditure categories are used: food, clothes, service, healthcare and other expenditures. The system is estimated with the help of nonlinear least squares though the system of seemingly unrelated equations. The model is estimated in the full sample without the division on the types of the households due to social characteristics.
In the Table you can see the results of the system estimation.
Table 6. The estimation of the informal economy size on the base of the system of equations
According to the results of model estimation, both wage and the income from self-employment are concealed. The amount of estimated wage income concealed is 22%, while the amount of income from self-employment concealed is 41%. Total amount of shadow economy is 18.8%. Therefore, the estimation is made totally on the income decomposition, in contradiction to the single equation approach of Pissarides and Webber, as the result we have obtained the higher estimates of the size of shadow economy. The estimates are considerably higher than those obtained by Lyssiotou, Pashardes and Stengos for UK (2004) – 10,6%; by Fortin, Lacroix, Pinard (Citation2009) for Canada – from 4,6 to 5,7%.
8. Conclusion
To conclude, we must say that methods implemented by Pissarides to the British economy and the ones implemented by Gardes to the economy of Turkey have a limited application to the households of Russian Federation. Although the consumer budget share estimation seems to give the results closer to the reality due to the fact that both wage income and self-employment income tend to be under reported. The results of this system estimation are very similar to the estimates of informal economy in Turkey. Bur while estimating the size of informal economy it is necessary to mention the specific feature of Russian households statistics because of which these estimation methods have limited implementation to the database. A few of households in the sample tend to have positive income from self-employment. Thus, the methods using the share of self-employment income are linked to this narrow part of database. The methods of Webber treat black economy only through the self-employment income, while the estimation of the system of equations helps to obtain separate estimates of wage income and self-employment income underreports.
Additional information
Funding
Notes on contributors
Yaroslav Murashov
Yaroslav Murashov, postgraduate at NRU HSE, Topic of the thesis: estimation of the size of informal economy of Russian Federation on the base of household budget survey data. Education: bachelor degree, NRU HSE (2012); master degree, NRU HSE (2014); master degree, Paris1–Pantéon Sorbonne (2014); main field of study: quantitative economics. Career: economist at the Central Bank of Russian Federation (from 2015).
Tatiana Ratnikova
Tatiana Ratnikova is an associate professor of Economic Faculty (NRU HSE), senior Fellow in Laboratory of Russia Economic Macrostructure Modeling (NRU HSE). Academic degree: Candidate of Science - Keldysh Institute of Applied Mathematics of the Russian Academy of Sciences (1996). Prior education: NRU - Moscow Engineering Physics Institute (graduated in 1988, faculty: Theoretical and Experimental Physics, specialty: Theoretical Nuclear Physics). Research interests: Panel Data Analysis; FDI and Firm Productivity; Hedonistic Regression for Art Objects; Shadow Income of Household.
References
- Aktuna, G. A., Starzec, C., & Gardes, F. (2011). A new estimation of the size of informal economy using monetary and full expenditures in a complete demand system. Paris: Paris School of Economics University, Paris I Panthéon-Sorbonne.
- Fortin, B., Lacroix, G., & Pinard, D. (2009). Évaluation de l’économie souterraine au Québec Une approche micro-économétrique. Revue économique, 60, 1257–1274.10.3917/reco.605.1257
- Lyssiotou, P., Pashardes, P., & Stengos, T. (2004). Estimates of the black economy based on consumer demand approaches. The Economic Journal, 114, 622–640.10.1111/j.1468-0297.2004.00234.x
- NRU-HSE. (2012). Russia longitudinal monitoring survey. Moscow: RLMS-HSE.
- Pissarides, C., & Weber, G. (1989). An expenditure-based estimate of Britain’s black economy. Journal of Public Economics, 39, 17–32.10.1016/0047-2727(89)90052-2
