
 ?Mathematical formulae have been encoded as MathML and are displayed in this HTML version using MathJax in order to improve their display. Uncheck the box to turn MathJax off. This feature requires Javascript. Click on a formula to zoom.
Abstract
This paper explores the theory behind the rich and robust family of -stable distributions to estimate parameters from financial asset log-returns data. We discuss four-parameter estimation methods including the quantiles, logarithmic moments method, maximum likelihood (ML), and the empirical characteristics function (ECF) method. The contribution of the paper is two-fold: first, we discuss the above parametric approaches and investigate their performance through error analysis. Moreover, we argue that the ECF performs better than the ML over a wide range of shape parameter values,
including values closest to 0 and 2 and that the ECF has a better convergence rate than the ML. Secondly, we compare the t location-scale distribution to the general stable distribution and show that the former fails to capture skewness which might exist in the data. This is observed through applying the ECF to commodity futures log-returns data to obtain the skewness parameter.
Public Interest Statement
This paper is entitled parameter estimation for stable distribution with applications to commodity future log-returns. The paper is useful to individuals interested in investing their wealth in financial markets. It provides essential information on how historical asset prices can inform future market movements via parameter estimation. This is crucial to portfolio managers, speculators, and hedgers. It’s imperative that the most accurate estimation method is established. Market data distribution deviates from the normal distribution, it exhibits skews, high or low peaks, and fat or skinny tails. The current paper is geared towards establishing the best estimation method among known methods in economic and financial analysis for skewed data.
1. Introduction
The motivation for this paper derives from the fact that parameter estimation from historical data is an important analysis to financial market participants. It provides useful information for portfolio managers, speculators, and hedgers. It is therefore, imperative that the most accurate estimation method is established. It is a known fact that in general, market data deviates from the Gaussian distribution, its distribution is either skewed, high or low peaked, and/or with fat or skinny tails. The current paper is geared towards establishing a better parameter estimation method among the commonly known ECF, ML, quantile, and logarithm moments methods used in economic and financial analysis for skewed data assumed to flow stable distributions.
The application of stable distributions in finance is traced way back in the late 50s when Mandelbrot (Citation1959,Citation1962,Citation1963) developed a hypothesis that revolutionalized the way economists viewed and interpreted prices in speculative markets such as grains and securities markets. The hypothesis suggested that prices were not Gaussian as it had been previously believed by market participants based on Bachelier (Citation1900). Mandelbrot’s hypothesis was therefore, an extension of the widely embraced breakthrough of Bachelier (Citation1900).
In the following years Zolotarev (Citation1964) developed integral representations of stable laws and the results have been used to develop parameter estimation techniques for the stable laws. Fama (Citation1963) reviewed the validity of Mandelbrot’s hypothesis and came up with statistical tools suitable for dealing with speculative prices. Dumouchel (Citation1971) employs this class of distributions in statistical inference for long-tailed data. Graphical representation of their densities and the estimation of their parameters via interpolation appear in Holt and Crow (Citation1973) and in Koutrouvelis (Citation1980) using regression. Parameter estimation methods based on quantile methods are presented in Fama and Roll (Citation1971) for symmetric stable distributions but this approach faces a problem of discontinuity of the traditional location parameter in the asymmetrical cases when the exponent parameter passes unity. A remedy and generalization of the quantile approach is later introduced by McCulloch (Citation1986).
A different parameter estimation technique based on fractional lower order moments (FLOM) appears in Ma and Nikias (Citation1995) where the authors develop new methods for estimating parameters in impulsive signal environments. However, their methods only cover symmetric stable distributions. There was a need to extend the method to asymmetric systems. This came through by Kuruoğlu (Citation2001) where a generalized FLOM method is introduced. Generally, FLOM methods pose a challenge of having to estimate the Sinc function and this in turn affects the accuracy of the results. As a consequence a better estimation approach referred to as logarithmic moments method (LM) is proposed by Kuruoğlu (Citation2001) to avoid having to compute the Sinc.
The third estimation method utilizes the maximum likelihood (ML). It is known that the ML approach is widely favored in economic and financial applications due to its generality and asymptotic efficiency (see for instance, Yu, Citation2004). However, there are cases where the ML method can be unreliable especially when the likelihood function is not tractable, or its not bounded over the parameter space or does not have a closed form representation. For instance, in this current paper the densities considered do not have closed form expressions. However, since there is a one-to-one correspondence between the density function and its Fourier transform it could be worth exploiting the latter since it always exists and its bounded. This leads us to next estimation method.
The fourth estimation approach is the empirical characteristic function (ECF) method discussed in Yu (Citation2004). Although the likelihood function can be unbounded, its Fourier transform is always bounded and, while the likelihood function might not be tractable or could not be of a closed form, the Fourier transform could have a closed form expression. The Fourier transform of the density function is the characteristic function (CF), hence the name empirical characteristic function (ECF) method. In this paper we aim to show that this approach performs better than all the previously mentioned methods. A useful software package that can be used to estimate stable distributions is provided in Nolan (Citation1997). A more theoretical approach to statistical estimation of the parameters of stable laws is extensively discussed in Zolotarev (Citation1980). Readers interested in how to simulate stable process can refer to two excellent literatures of Weron and Weron (Citation1995) and Zolotarev (Citation1986).
This paper explores the theory behind the rich and robust family of -stable distributions to estimate parameters from financial asset log-returns data. We discuss four-parameter estimation methods including the quantiles, logarithmic moments method, ML, and the empirical characteristics function (ECF) method. The contribution of the paper is two-fold: first, we discuss the above parametric approaches and investigate their performance through error analysis. Moreover, we argue that the ECF performs better than the ML over a wide range of shape parameter values,
including values closest to 0 and 2 and that the ECF has a better convergence rate than the ML. Secondly, we compare the t location-scale distribution to the general stable distribution and show that the former fails to capture skewness which might exist in the data. This is observed through applying the ECF to commodity futures log-returns data to obtain the stable parameters.
The rest of the paper is organized as follows: in Section 2 we define a stable process and its construction from independent and identically distributed random variables based on a generalized central limit theorem and discuss its characterization. In Section 3 we study the density and distribution properties of stable processes through their characteristic functions. Section 4 explains how the four-parameter estimation methods discussed in this paper work and provides an analysis on their accuracy. In Section 5 we study and analyze some commodity data and show that the data deviates from the normal distribution hypothesis. We use the ECF to obtain the four stable parameters from the data and in addition, fit the data to various distributions to determine the closest shape of the data which turns out to be the t location-scale distribution for all our data. This distribution is suited for data that is highly peaked and heavily tailed with outliers. However, we propose stable distribution fitting to check for any existing tails. Section 6 concludes.
2. Stable processes
Stable also known as alpha-stable (or equivalently -stable) processes belong to a general class of Lévy distributions. They are limiting distributions with a definitive exponent parameter
that determines their shape.
2.1. Definition and construction
Definition 2.1
Let be independent and identically distributed random variables and suppose a random variable S defined by
(1)
(1)
where “” represents weak convergence in distribution,
is a positive constant and
is real. Then S is a stable process and the constants
and
need not to be finite.
Definition 2.1 allows modeling of a number of natural phenomenon beyond normality using stable distributions. The fact that and
do not necessarily have to be finite provides the generalized central limit theorem.
Definition 2.2
(Generalized Central Limit Theorem Rachev (Citation2003)) Suppose denotes a sequence of independent and identically distributed random variables and let sequences
and
. Then we can define a sequence
(2)
(2)
of sums such that their distribution functions weakly converge to some limiting distribution:
(3)
(3)
where H(x) is some limiting distribution.
The traditional central limit theorem assumes finite mean and finite variance
and defines the sequence of sums
(4)
(4)
such that the distribution functions of weakly converge to
:
(5)
(5)
where denotes the standard Gaussian distribution
(6)
(6)
Suppose the independent and identically distributed random variables equal to a positive constant c almost surely and the sequences
and
in (2) are defined by
and
, then
is also equal to c for all
almost surely. In this case the random variables
are mutually independent and as a result, the limiting distribution for the sums
belong to the stable family of distributions by definition. This is one reason why they are regarded as stable.
2.2. Parametrization
Definition 2.3
A stable distribution is a four-parameter family denoted by :
| (1) |
| ||||
| (2) |
| ||||
| (3) |
| ||||
| (4) |
| ||||
Suppose a random variable s follows a stable distribution then the random variable
has the same-shaped distribution as s but with the location parameter
and the scale parameter
. This is another reason why they are referred to as stable, the shape is maintained after any rescaling.
Densities of -stable distributions do not have closed-form representations except for the case of a Gaussian (
), Cauchy (
) and Inverse Gaussian or Pearson (
) distributions.
| (1) | Gaussian distribution | ||||
| (2) | Cauchy distribution: | ||||
| (3) | Levy distribution (Inverse-Gaussian or Pearson): | ||||
3. Density and distribution properties
3.1. Special case
Let denote a Lévy process. The characterization of
is deduced from the Lévy-Khintchine formula.
Definition 3.1
(Lévy-Khintchine & Applebaum, Citation2004) Let be a Lévy process. There exist
,
such that the characteristic function of X is given by
(7)
(7)
where is an indicator function and m is a
-finite measure satisfying the constraint
(8)
(8)
Definition 3.2
(The Lévy-Itô Decomposition Applebaum (Citation2004)) If is a Lévy process, there exist
, a Brownian motion
with variance
and an independent Poisson random measure N on
such that, for each
,
(9)
(9)
where(10)
(10)
The compensated compound Poisson random measure is defined by to preserve the martingale property. The Lévy measure
satisfies (8).
A stable distribution can be constructed by setting to zero in (7) or the second term on the right of (9) to zero and the Lévy measure in (8) to
(11)
(11)
This gives a pure jump Lévy process which is a simple example of a stable family of distributions. We discuss a general case in the following.
3.2. General case
In the following, will represent a stable process. Its characteristic function
is obtained using the definition of domain of attraction of stable random variables and the Lévy-Khinchine representation formula in Definition 3.1 (see Applebaum, Citation2004):
(12)
(12)
Alternative forms of parametrization are discussed in McCulloch (Citation1986) for easier numerical analysis. More discussion on this to follow in Section 3.4.
The density of is computed from (12) using the Fourier transform:
(13)
(13)
Figure shows density graphs for different exponent parameter values. The density is defined over the whole real line and for application purposes in finance log-returns data is usually used instead of raw asset prices to fit this family of distributions.
Figure 1. -stable densities for
.
![Figure 1. α-stable densities for α∈(0,2].](/cms/asset/1c8d81ea-3aa6-4c6a-86dc-65838fb490b2/oaef_a_1318813_f0001_oc.gif)
The drawback in approximating (13) is that elementary techniques such as expressing the integral in terms of simple functions or using infinite polynomial expressions of the density function are not sufficient for meaningful numerical analysis. Some authors propose a standard parameterized integral expression of the density given by (see Ament & O’Neal, Citation2016)(14)
(14)
However, this representation consists of an oscillating integrand which in turn leads to another alternative approach presented in Zolotarev (Citation1986) where the density of is given by
(15)
(15)
(16)
(16)
where .
3.3. Some properties of stable distribution functions
Firstly, recall that for any two admissible sets of parameters of stable distributions we can find two unique numbers and b such that
(17)
(17)
where(18)
(18)
The intuition is that a general stable distribution can be expressed in terms of a standard stable distribution. That is, we can write where
(19)
(19)
Secondly, suppose h, H and denote the respective probability, cumulative density and characteristic functions of a stable random variable, S, where
then it is readily seen that the following properties hold:
| (1) |
| ||||
| (2) |
| ||||
| (3) |
| ||||
3.4. Simulating  -stable random variables
The two excellent references for simulating stable processes are Zolotarev (Citation1986) and Chambers, Mallows, and Stuck (Citation1976).
Definition 3.3
Suppose is a stable process with parameters
, the characteristic function is given by
(20)
(20)
where(21)
(21)
(22)
(22)
Lemma 3.4
Let be a uniformly distributed random variable and let W be an independent exponential random variable with mean 1. Then
(23)
(23)
is a standard -stable process with parameters
.
Proof
See Zolotarev (Citation1986).
A stable random variable can be easily generated using Lemma 3.4. Programming languages such as R or MATLAB can be utilized to generate a uniformly distributed random variable U on the interval and an independent exponential random variable E with mean 1Footnote2. Then the stable random variable would be generated by computing
(24)
(24)
where and
.
3.5. Moments of stable processes
Statistical moments of stable distributions are finite only when
. Moreover, for
the variance is infinite, for
the mean does not exist and the mean is zero when
. This is not always the case for symmetric stable distributions where
.
3.5.1. Fractional lower order moments
The FLOM is an alternative for computing moments of -stable random variables especially in situations where the mean and/or variance are infinite. FLOM representation formulas are discussed in Ma and Nikias (Citation1995) for symmetric stable random data and its generalization to asymmetric stable random data in Kuruoğlu (Citation2001). In the latter, if
and
, then
where and
denotes the Gamma function. From the above representations, moments with negative values of p are attainable. This results into the logarithmic moments approach that provides an easier way of estimating stable distribtuion parameters compared to the FLOM.
3.5.2. Logarithmic moments
This approach is as a result of the challenges encountered when using the FLOM method which requires computing Gamma functions, the inversion of the sinc function and it only works for some p. The current method suggests computing derivatives with respect to the moment order p resulting in moments of the logarithms of the stable process. We illustrate in the following.
Lemma 3.5
Let S denote a symmetric stable random variable and let . Then
(25)
(25)
The moments follow readily for . i.e.
(26)
(26)
(27)
(27)
(28)
(28)
where and terms
are given by
,
,
derived from the polygamma function
(29)
(29)
Proof
3.6 The proof is provided in Kuruoğlu (Citation2001).
4. Parameter estimation of stable processes
The four common methods for estimating parameters of stable processes include: quantiles method (see Fama & Roll, Citation1971; McCulloch, Citation1986,Citation1996 ), the logarithmic moments method (see Kuruoğlu, Citation2001), the empirical characteristics method (see Yang, Citation2012), and the ML method (see Nolan, Citation2001). We investigate their accuracy in the following.
4.1. The quantiles method
The quantile method was pioneered by Fama and Roll (Citation1971) but was much more appreciated through McCulloch (Citation1986) after its extension to include asymmetric distributions and for cases where unlike the former approach that restricts it to
.
Suppose is a given data sample then the estimates for
and
are given by
and
where
(30)
(30)
The notation represents the qth quantile of sample
and,
and
are obtained by functions
and
given in Tables III and IV in McCulloch (Citation1986) through linear interpolation. Consequently, the scale parameter is given by
(31)
(31)
where is given by Table V in McCulloch (Citation1986). The consistent estimator
is then obtained through interpolation.
Finally the location parameter is estimated through a new parameter defined by
(32)
(32)
Moreover, is estimated by
(33)
(33)
where is obtained from Table VII (McCulloch, Citation1986) by linear interpolation. The location parameter is estimated consistently by
(34)
(34)
4.2. Empirical characteristic function method
Suppose a set of observable data follows a stable distribution. Then we can approximate the characteristic function of this data by applying a basic Monte Carlo approach based on the law of large numbers i.e.
(35)
(35)
We can express the characteristic function (12) in terms of the cosine and sine function from basic trigonometric principles, i.e.(36)
(36)
where
As a result, we observe that(37)
(37)
The estimated characteristic function relates to the model parameters by(38)
(38)
Solving this system leads to the estimation representation formulas for the stability and variance parameters:
The real and imaginary parts of the characteristic function (36) provide estimates for and
:
(39)
(39)
Suppose and choose another set of positive numbers
together with
and
then the estimates of the location and skewness parameters are given respectively by
(40)
(40)
(41)
(41)
Notice, it can be deduced from Equation (36) that
This provides an alternative way to envision the regression estimation method:
where and
is an error term. The stability parameter
and the scale parameter
can be estimated by selecting
; of real data (see Koutrouvelis, Citation1980, Table I). The estimates
and
are then used to estimate
and
using the following relation
where ,
and
is some random error. The proposed real data set for Q (see Koutrouvelis, Citation1980, Table II) is
.
4.3. Logarithmic moments method
This approach follows the theory discussed in Section 3.5.2. The key innovation with this method is that there is no need of computing Gamma functions and the sinc function as in the FLOM. Secondly, techniques of parameter estimation for symmetric stable random variables (i.e. ) can be applied to skewed stable random variables (i.e.
) and, techniques of parameter estimation for centered stable random variables (i.e.
) to non-centered ones (i.e.
) through centro-symmetrization. However, this comes at a cost of losing almost half of the sample data. Therefore to obtain better estimates one has to use large sample data sets.
4.3.1. Centro-symmetrization of stable random data sets
Let be a sequence of n independent stable random variables distributed according to
Then the distribution of a weighted sum of the above sequence with weights can be estimated using their characteristic function:
(42)
(42)
where the pth power of a number x is defined by
As a result, it is easy to obtain sequences of independent stable random variables with zero , zero
as well as both zero
and zero
for
. This yields the centred, deskewed, and symmetrized sequences:
(43)
(43)
(44)
(44)
(45)
(45)
4.3.2. Parameter estimation
Suppose is a data set assumed to be drawned from
. Then the exponent parameter
is estimated by setting
in (27), and the log moment
is estimated from the obverted data (45). That is,
(46)
(46)
The estimated is used to estimate
using (26) where
is estimated from the obverted data (44). That is,
(47)
(47)
From the definition of ,
can be estimated by
(48)
(48)
Centering (see (43)) requires to be multiplied by
to obtain
of the original data where the sign of
is determined by
where ,
,
is the maximum, median and minimum of the original data.
Next we estimate the scale parameter using (26) where
is estimated from the obverted data (43). That is
(49)
(49)
Again centering (see (43)) gives the parameter estimate of the original data by
.
Finally, the location parameter is estimated by
(50)
(50)
where is the median or mean of the obverted data ().
4.4. Maximum likelihood method
The ML method is the most favored parameter estimation method in economic and financial applications. The method relies on the density function which in the case of stable distributions poses a closed form representation problem. In this case we propose a numerical estimation of the density function. For a vector of independent identically distributed random variables assumed to follow a stable distribtion, the ML estimate of the parameter vector
is obtained by maximizing the log-likelihood function given by
(51)
(51)
where denotes a numerically estimated stable probability density function. It is shown for instance in Mittnik, Rachev, Doganoglu, and Chenyao (Citation1999) that the best algorithms to compute the ML is by using Fast Fourier Transforms (FFT) or by direct integration method as in Nolan (Citation2001). The ML algorithms require carefully chosen initial input parameters which in our case can be obtained for example, through the quantiles method described above. The FFT is faster for large data sets and the direct integral approach is suitable for smaller data sets since it can be evaluated at any arbitrary point.
In the following section, we analyze commodities and apply the empirical characteristic functions method to estimate the stable distribution parameters.
It is important to mention the restrictions on the parameters under which the different estimation methods operate.
4.5. Error analysis
In this section we simulate datasets from the stable family of distributions based on the theory in Chambers et al. (Citation1976) and Weron and Weron (Citation1995). Then use the above four methods to retrieve the stable parameters from the simulated data. Our focus is on the and
but the arguments extend to the other two parameters.
First, it is important to mention that all the four methods perform poorly close to the boundaries i.e. ,
and
. Moreover, literature shows that the methods operate efficiently under the parameter restrictions in Table .
Table 1. Estimation methods and their parameter restrictions
In addition, the MLE seems the most preferred and used estimation method. However, we observe in our analysis that this method fails for particular parameter ranges and it is not robust. For instance in estimating with respect to
, the MLE fails to converge and returns huge unrealistic errors. This is why we do not include it in Figure (a). Similarly, for
estimation with respect to
, the logarithm moments method returns either negative or very large
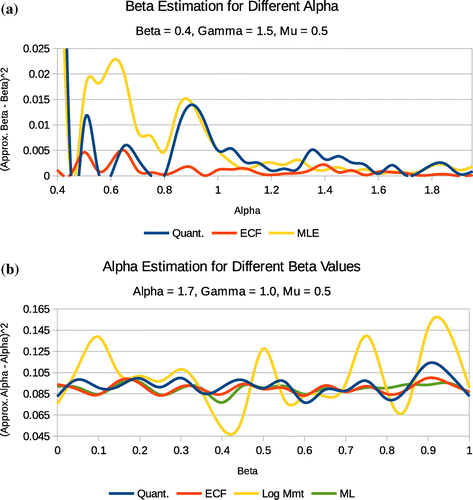
values which is expected according to the constraints in Table . We omit its graph in Figure (b). Meanwhile, we notice that in both cases, the quantile and ECF methods work well with the latter providing relatively the best estimates.
Figure 2. Method comparison for and
estimation.
The graphs in Figure show the error associated with estimating for different
values. Note that all the four methods work well and we still notice the ECF being relatively the most accurate and robust method. Recall that for
and
the estimation methods perform poorly. An example is Figure (a) (for
) which was the closest for which the ML would converge but for higher
values but far less than 2.0 (see for instance, Figure (a) for
) the methods performed relatively better except for the logarithm moments methods.
Figure 3. Method comparison for and
estimation.
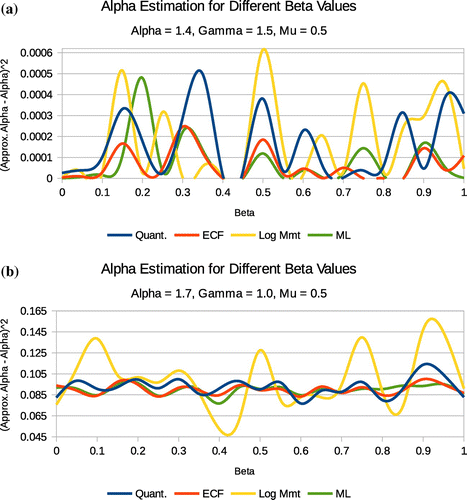
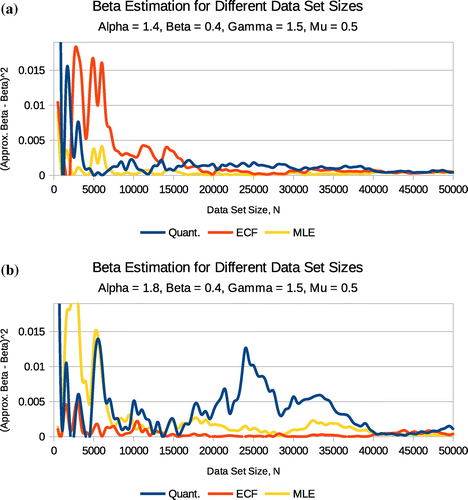
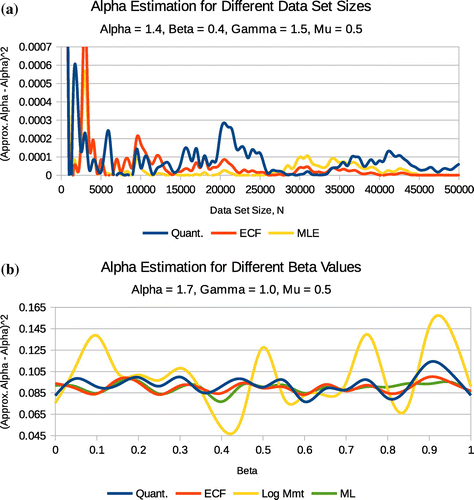
Figure 4. estimation for differing data set sizes and
values.
The graphs in Figure illustrate convergence of the quantile, ECF and the MLE in estimating and
. We simulated 50,000 points and divided it into 100 sets starting with a 500-sized set and increasing it by 500 to 50,000. The logarithm moments method performed extremely poorly and incomparable to the above three methods. It is not included in Figure (a) and (b). The ECF is seen to perform better than the quantile and ML methods with a relatively better convergence rate. Similary Figure shows the convergence rates for the quantile, ECF and ML estimation methods. The ECF still provides a better precision in both cases i.e. Figure (a) and (b).
Figure 5. estimation for differing data set sizes for
values.
In summary the empirical characteristic function method outperforms all the three other methods discussed in this paper in the following way:
| (1) | It is robust and can consistently estimate a wide range of | ||||
| (2) | It provides a better precision compared to the quantile, logarithm moments and MLE methods for a wide range of | ||||
| (3) | It has a better convergence rate. | ||||
The following section is devoted to extracting stable parameters from log-returns commodity futures data using the ECF method.
5. Commodity data
The data sets used here are obtained from Quandl Financial and Economic Data website. The sets differ in sizes and include settled prices of Corn Futures Continuous Contract C#1 from 1959-07-01 to 2017-02-10; Crude Oil Futures Continuous Contract C#1 from 1983-03-30 to 2017-02-10; Gasoline Futures Continuous Contract C#1 from 2005-10-03 to 2017-02-10; Gold Futures Continuous Contract C#1 from 1974-12-31 to 2017-02-10; Natural Gas Futures Continuous Contract C#1 from 1990-04-03 to 2017-02-10; Platinum Futures Continuous Contract C#1 from 1969-01-02 to 2017-02-10; Silver Futures Continuous Contract C#1 from 1963-06-13 to 2017-02-10; Soybeans Futures Continuous Contract C#1 from 1959-07-01 to 2017-02-10; Wheat Futures Continuous Contract C#1 from 1959-07-01 to 2017-02-10. To avoid multi-distributional effects, we work with log-returns of the data sets.
5.1. The t-location-scale distribution
The t-location-scale distribution is most suited for modeling data distributions with heavier tails, more prone to outliers than the Gaussian distribution. The distribution uses the following parameters
Table
The probability density function (pdf) of the t-location-scale distribution is given by
where denotes the gamma function. The mean of the t-location-scale distribution is given by
and it is defined for
and undefined otherwise. The variance is given by
The t-location-scale distribution approaches the Gaussian distribution as approaches infinity and smaller values of
yield heavier tails. This distribution does not take skewness into consideration and its three parameters are usually estimated using the ML estimation method.
Using algorithms by Sheppard (Citation2012) on our log-returns commodity futures data we obtained fittings in Figures –.
Table 2. t- location-scale distribution parameters extracted from the log-returns data
According to the values, the log-returns data exhibit some tails. To determine the nature of the details one would require to run some QQ plots but this can also be observed directly from the Figures –.
Figure 6. Energy: The data exhibits high peaks and skinny tails.
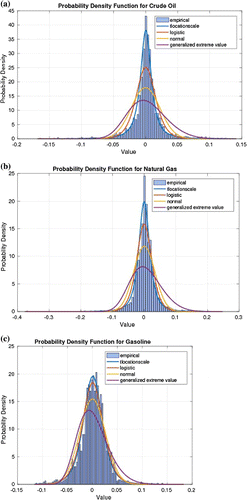
Figure 7. Grains: The data exhibits high peaks and skinny tails.
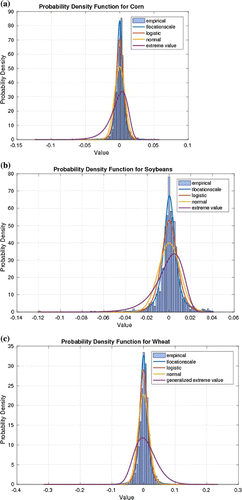
Figure 8. Metals: The data exhibits high peaks and skinny tails.
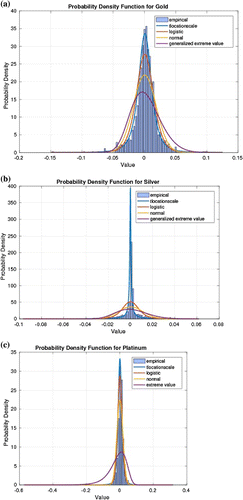
It is important to mention that QQ plots do not straight away provide conclusive evidence about the nature of the tails. More tests would still need to be made. For instance under the t-location scale it is not obvious to observe any skewness in the data. We however, view this effect when we fit the data to stable distribution (see Table ) as discussed in the following section.
5.2. Stable distribution fitting
On the other hand, by assuming stable distribution for our log-returns commodity futures data, we employed the ECF method and obtained the stable parameters in Table .
Table 3. Stable distribution parameters extracted from the log-returns data
Log-returns of commodity futures are not only high peaked but they also have left and right skinny tails with extreme outliers as observed from the QQ-plots for energy commodities (i.e. Crude oil, Natural gas and Gasoline) in Figure , the grains commodities in Figure and the precious metals in Figure .
Figure 9. Energy: In all, the left and right tails are skinny.
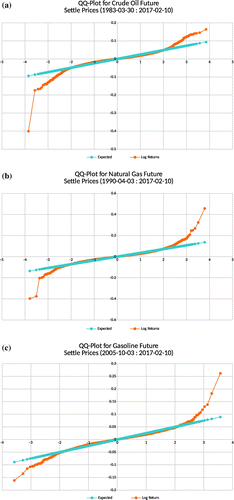
Figure 10. Grains: In all, the left and right tails are skinny.
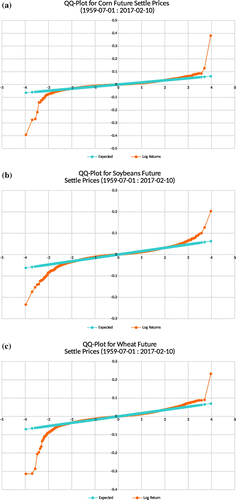
Figure 11. Metals: In all, the left and right tails are skinny.
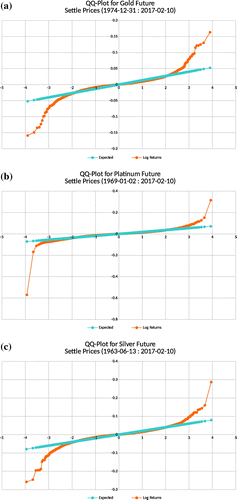
Table shows stable distribution parameters extracted from the log-returns data using the empirical characteristic function parameter estimation method. We notice that the data exhibit a bit of skewness which is not reflected in the t-location-scale distribution fitting.
6. Conclusion
First we showed that the ECF provides the best precision in estimating a wide range of and
parameters, it is robust and provides better convergence compared to the quantile, ML, and the logarithm moments. Secondly, we have illustrated that in general, the distribution of the commodity futures log-returns data is closest to a t-location-scale distribution due to its high peaks, skinny tails and extreme outliers. Moreover, by using the ECF estimation method we realize some minor skewness effects not captured in the t-location-scale fitting. We recommend the ECF as a suitable approach for estimating parameters of any skewed financial market data and could be used to obtain initial input parameters for future and better estimation techniques.
Cover image
Source: Original image from Parameter estimation for stable distributions with application to commodity futures log-returns by M. Kateregga, S. Mataramvura and D. Taylor.
Additional information
Funding
Notes on contributors
M. Kateregga
Mr Michael Kateregga is a finishing PhD student at the University of Cape Town in South Africa. His research is in the field of mathematical finance and his PhD thesis is entitled Stable Distributions with Applications in Finance. The current paper is a chapter in his thesis which is due for submission in August, 2017. Mr Kateregga is also a researcher at the African Collaboration for Quantitative Finance and Risk Research (ACQuFRR) which is the research section of the African Institute of Financial Markets and Risk Management (AIFMRM), which delivers postgraduate education and training in financial markets, risk management and quantitative finance. Mr Kateregga also works with the African Institute for Mathematical Sciences (AIMS) in South Africa as a Research Assistant.
Notes
1 Note that characteristic functions always exist.
2 These are easily obtained from in-built functions in MATLAB
References
- Ament, S., & O’Neal, M. (2016). Accurate and efficient numerical calculation of stable densities via optimized quadrature and asymptotics. , arXiv: 1607.04247v1
- Applebaum, D. (2004). Lévy processes and stochastic calculus. Cambridge Studies in Advanced Mathematics. Cambridge: Cambridge University Press.
- Bachelier, L. (1900). Théorie de la spéculation. Annales scientifiques de l’É.N.S. 3e série, 17, 21–86.
- Chambers, J. M., Mallows, C. L., & Stuck, B. W. (1976). A method for simulating stable random variables. Journal of the American Statistical Association, 71, 340–344.
- Dumouchel, W. H. (1971). Stable distributions in statistical inference. The Journal of the American Statistical Association, 78, 469–477.
- Fama, E. F. (1963). Mandelbrot and the stable paretian hypothesis. The Journal of Business, 36, 420–429.
- Fama, E. F., & Roll, R. (1968). Some properties of symmetric stable distributions. Journal of the American Statistical Association, 63, 817–836.
- Fama, E. F., & Roll, R. (1971). Parameter estimates for symmetric stable distributions. Journal of the American Statistical Association, 66, 331–338.
- Holt, D. R., & Crow, E. L. (1973). Tables and graphs of the stable probability density function. Journal of Research of the National Bureau of Standards. Section D, 77, 143–198.
- Koutrouvelis, I. A. (1980). Regression-type estimation of the parameters of stable laws. Journal of the American Statistical Association, 75, 918–928.
- Kuruoğlu, E. E. (2001). Density parameter estimation of skewed alpha-stable distributions. IEEE Transactions on signal processing, 49, 2192–2201.
- Mandelbrot, B. (1959). Variables et processus stochastiques de pareto-Lévy et la répartition des revenus. Comptes Rendus de l’Académie des Sciences, 249, 2153–2155.
- Mandelbrot, B. (1962). Paretian distributions and income maximization. The Quarterly Journal of Economics, 76, 57–85.
- Mandelbrot, B. (1963). The variation of certain speculative prices. The Journal of Business, 36, 394–419.
- Ma, X. Y., & Nikias, C. L. (1995). Parameter estimation and blind channel identification in impulsive signal environments. IEEE Transactions on signal processing, 43, 2884–2897.
- McCulloch, J. H. (1986). Simple consistent estimators of stable distribution parameters. Communications in Statistics - Simulation and Computation, 15, 1109–1136.
- McCulloch, J. H. (1996). 13 financial applications of stable distributions. Statistical Methods in Finance, 14, 393–425.
- Mittnik, S., Rachev, S. T., Doganoglu, T., & Chenyao, D. (1999). Maximum likelihood estimation of stable paretian models. Mathematical and Computer Modelling, 9, 275–293.
- Nolan, J. P. (1997). Numerical calculation of stable densities and distribution functions. Communications in Statistics, Stochastic Models, 13, 795–774.
- Nolan, J. P. (2001). Maximum likelihood estimation and diagnostics for stable distributions (pp. 379–400). Boston, MA: Birkhäuser Boston.
- Rachev, S. (2003). Handbook of heavy tailed distributions in finance: Handbooks in finance. Handbooks in Finance. Amsterdam: Elsevier Science.
- Sheppard, M. (2012). Fit all valid parametric probability distributions to data. ALLFITDIST Matlab code (Technical Report). Kennesaw State: Kennesaw State University Department of Mathematics.
- Weron, A. & Weron, R. (1995). Computer simulation of Levy alpha-stable variables and processes. Lecture Notes in Physics, 457, 379–392.
- Yang, Y. (2012). Option pricing with non-gaussian distribution-numerical approach (Technical Report). New York, NY: Stony Brook University, Department of Applied Mathematics and Statistics.
- Yu, J. (2004). Empirical characteristic function estimation and its applications. Econometric Reviews, 23, 93–123.
- Zolotarev, V. M. (1964). On the representation of stable laws by integrals. Trudy Matematicheskogo Instituta imeni VA Steklova, 71, 46–50.
- Zolotarev, V. M. (1980). Statistical estimates of the parameters of stable laws. Banach Center Publications, 6, 359–376.
- Zolotarev, V. (1986). One-dimensional Stable Distributions. Translations of mathematical monographs. Providence, RI: American Mathematical Society.
