
 ?Mathematical formulae have been encoded as MathML and are displayed in this HTML version using MathJax in order to improve their display. Uncheck the box to turn MathJax off. This feature requires Javascript. Click on a formula to zoom.
Abstract
Purpose: This study examines how, and to what extent the trading of the cross-listed China-backed ADRs on the New York Stock Exchange (NYSE) contributes to the information flow and price discovery for the corresponding cross-listed stocks on the Shanghai Stock exchange (SSE). Design/methodology/approach: The study utilizes the information share, Granger causality test, Vector error correction model, Permanent–Temporary Gonzalo–Granger (PT/GG) method and Bivariate DCC-EGARCH model to examine the price discovery dynamics across the cross-listed stocks. Findings: The Granger causality tests show that there is two-way transmission on feedback between the Chinese and US markets. The effects from NYSE to SSE are larger than the other way round. The Bivariate DCC-EGARCH model test results indicate the volatility spill over from NYSE is larger from the SSE. Practical implications: Results suggest that in contrast to previous studies that showed very little contribution to price discovery by Chinese ADRs on the NYSE, the present study indicates that the contribution to price-discovery of Chinese ADRs on NYSE has increased relative to the past, suggesting the importance of changing time frames and economic situations. Originality/value: The study differentiates between long-term and short-term price discovery effects and finds that home country bias persists in the long term and in the short term the information from the Cross-listed China-backed ADRs on the New York Stock Exchange (NYSE) affects price discovery for SSE stocks.
Public Interest Statement
This paper contributes to the extant literature on price discovery in several ways. In contrast to prior studies, this paper suggests that over the years as economic conditions underwent a change both in China and the US, the contribution to price discovery of Chinese ADRs listed on the NYSE has relatively improved. The study also extends the study of Su and Chong (Citation2007) in explaining price discovery dynamics from the short-term and long-term perspectives. Our findings are also consistent with the work of Frijns, Gilbert, and Tourani-Rad (Citation2010) and Eun and Sabherwal (Citation2003). This study uses the data of Chinese ADRs cross-listed on the NYSE and corresponding stocks on the Shanghai Stock Exchange.
1. Introduction
The rapid development of world economic integration and financial liberalization has provided companies with an opportunity to list their shares on multiple stock exchanges i.e. cross-listing. Consequently, measuring the relative success of cross-listed companies has engaged attention of researchers especially with regard to the influence of information on stock prices (price discovery) and similarly whether financial markets are co-integrated. When an exchange dominates in terms of price discovery, it suggests that this is the exchange where traders and investors prefer to execute their trade (Frijns et al., Citation2010). In an efficient market, the price of an asset should be the same regardless of its listing location. This principle is enforced by the “no-arbitrage” argument. In financial economics, the law of one price ensures that two or more non-stationary economic series have similar movement in the long-run. This equilibrium phenomenon in the long run is known as co-integration (Qadan & Yagil, Citation2012). To be specific, if the financial markets of different regions are co-integrated and a stock is listed in those markets simultaneously, there should not be any disparity in terms of its price and price movements (Koumkwa & Susmel, Citation2005).
It is interesting to investigate the price discovery of the Chinese markets and international stock markets because the patterns of information transmission observed among the developed markets may not hold for the Chinese stock markets. This is due to its short history and some unique features. These features relate to ownership types of security suppliers, the mix of market investors and the trading mechanisms.
First, the securities of the Chinese stock markets are mainly supplied by the state owned enterprises (SOEs). However, the tradable shares only account for a small proportion of total outstanding shares of SOEs. This results in the scarce supply of securities due to a small number of SOEs in China (Chen, Han, Li, & Wu, Citation2013). Second, the individual and retail investors have a larger proportion of the market than the institutional investors. Hence, they are a major force driving stock market movements (Ng & Wu, Citation2007; Yang, Yang, & Zhou, Citation2012). Finally, a special trading rule applies in the Chinese stock markets that those who trade stocks in one trading day are not allowed to do another trade until the next trading day. Hence, there is no possibility of intra-day trading. Also, short selling transactions are difficult to implement due to high transaction costs and the lack of security lenders (Xie & Mo, Citation2014).
Prior investigation of how the Chinese stock markets interact with leading world markets has produced inconclusive results. Some studies found that there are no significant information linkages between Chinese and developed stock markets (Li, Citation2007; Long, Tsui, & Zhang, Citation2014). In contrast, others suggest that international markets can affect the pricing behaviour of the Chinese stock markets and vice versa (Allen, Amram, & McAleer, Citation2013; Chow, Liu, & Niu, Citation2011; Guo, Han, Liu, & Ryu, Citation2013).
Using a sample of nine companies, this study examines how, and to what extent the trading of the China-backed ADRs cross-listed on the New York Stock Exchange (NYSE) contribute to the information flow and price discovery for the corresponding cross-listed stocks in Shanghai Stock exchange (SSE). For the purpose, we examine the stock returns from January 2005 to December 2014 to examine how price discovery underwent change over time.Footnote1 We found that the returns of the two pairs that are cross-listed on NYSE and SSE stocks are co-integrated in the long-run across the two markets in most of the cases, indicating both an absence of arbitrage opportunities and long-term equilibrium. By examining the information share (Hasbrouck, Citation1995), permanent–temporary common factor (PT/GG) measure (Gonzalo & Granger, Citation1995), Granger causality and volatility spillovers, we find that the domestic market (SSE) plays a dominant role in price discovery (where information is impounded into prices) in the long run, therefore holding the home bias hypothesis that the home market generates the most useful information about price movement. The results from information share and PT/GG measure are similar. In contrast, the Granger causality and volatility spillovers show that the NYSE leads the SSE in the short run.
Our findings are in line with the literature (Chen, Li, & Wu, Citation2010). We, however, make a significant contribution by our finding that though SSE and NYSE both impact price discovery for cross-listed stocks, the home market price exercises the dominant influence in the long run. The result reverses in the short run. This finding complements evidence on the price discovery of Chinese ADRs cross-listed on the NYSE (Su & Chong, Citation2007). Furthermore, the present study indicates that the contribution for price-discovery of Chinese ADRs cross-listed on the NYSE has improved, suggesting the impact of changing time frames and economic situations on the relationship.
Our study employs a different methodological approach from two typical studies on this issue: Su and Chong (Citation2007) and Chen, Tourani-Rad, and Yi (Citation2016). However, our paper is similar but goes beyond their techniques as our paper considers the long-term and short-term perspectives. Moreover, Su and Chong (Citation2007) focus on the US and Hong Kong and explore issues pertaining to developed markets. Our paper on the other hand is about the US and China wherein the time zones differ along with the market environments. They belong to two different trading environments while the US belongs to a mature market and China is an emerging market. The findings of our study have implications for investors with regard to international diversification.
The study of Chen et al. (Citation2016) focuses on the event study for the effect of short selling on the price discovery of Chinese cross-listed firms on Hong Kong market. There are similarities in the case of time zone and regional characteristics. From the methodology point of view, the multiple regression model is employed by Chen et al. (Citation2016) in which they examine the causal relationship between the short selling and price discovery while our study considers the information transmission between the two markets to understand the dynamics of price discovery between the home and foreign market.
This paper employs a bivariate dynamic conditional correlation–exponential generalized autoregressive conditional heteroscedasticity (DCC-E-GARCH) model to specify the volatility spillovers between cross-listed stocks. The reasons for using the E-GARCH model to specify the univariate conditional variances are shown as follows. The positivity of the conditional variances is guaranteed due to the logarithmic setting. Thus, no restrictions need to be imposed for estimation of co-efficient. Compared to the GARCH and GJR—GARCH, the estimation efficiency is high (Koutmos & Tucker, Citation1996; Nelson, Citation1991). For the issue of volatility spillovers, the E-GARCH model can explain a large portion of the volatility dynamics. It is widely employed in the methodological framework of the volatility spillovers or information transmissions (Koutmos & Booth, Citation1995; Tse, Citation1999; Tse & Booth, Citation1996).
There is another advantage of E-GARCH model over the other GARCH type models, for the issues of volatility spillovers, the estimation results are not independent of the higher lag orders in the model (Tse, Citation1999). Therefore, for the reasons mentioned above, the E-GARCH model is considered as model with better explanatory power.
The study chose the DCC model to address the conditional correlation matrix because the DCC model is the best fitted model for the world stock markets and hence, provide best estimates as suggested by Emin (Citation2016).Footnote2
The rest of this paper is organized as follows. Section 2, reviews the literature, Section 3 discusses models and framework of Hasbrouck (Citation1995) and Gonzalo and Granger model, Section 4 describes the data. In Section 5, we present empirical results and Section 6 concludes.
2. Literature review
The literature examining price discovery is growing in a number of settings, particularly looking at the price discovery of stocks listed on multiple exchanges. Initially, studies examined the correspondence, particularly between the NYSE and the regional exchanges (Harris, McInish, & Wood, Citation2002; Hasbrouck, Citation1995). An interesting extension is Harris et al.(Citation2002), who looked at the relative contributions to price discovery coming from the NYSE and regional exchanges at three points in time: 1988, 1992 and 1995. These authors found that price discovery contributions change over time.
Coffee Jr. (Citation2002) explained the inter connection between the overseas exchange and the domestic exchange by the bonding hypothesis. They found that bonding existed for firms that cross-list their shares on the NYSE or the NASDAQ exchanges. This kind of cross-listing, however, happened in the stock exchanges that have higher requirements and listing cost than in the home country exchange. Doidge, Karolyi, and Stulz (Citation2004) suggest that a US listing reduces the extent to which controlling shareholders can engage in expropriation and that growth opportunities are more highly valued for firms that choose to cross-list in the US, particularly those from countries with poorer investor rights. The US stock markets become attractive for foreign companies to list their shares because of stricter listing requirements that impose good governance obligation. Reese and Weisbach (Citation2002) conducted research to find out if firms under a weak legal system are more likely to list their shares in the US market. By comparing a sample of 2038 cross-listed firms with 1051 firms listed only on the home country exchange, they found that the desire to protect shareholder rights appears to be an important reason why some non-US firms cross-list in the United States. When domestic only firms cross-listed in the US major market, their equity offering numbers increased dramatically.
Extant studies on price discovery suggest that the home market tends to lead price discovery for cross-listed stocks, and this can be attributed to several market characteristics. For instance, Lieberman, Ben-Zion, and Hauser (Citation1999) investigated the dominant–satellite relation of stocks listed on two international markets, Tel-Aviv and New York. They found that arbitrage opportunities are generally not available and that usually, the domestic market emerges as the dominant one and the foreign market as the satellite one, particularly for international firms with a large volume stock-holding. Eun and Sabherwal (Citation2003) examine price discovery for Canadian stocks that are also listed on the NYSE, AMEX, or NASDAQ in the US, and find that generally Canada leads in terms of price discovery. They further found that the US share of price discovery is directly related to the US share of trading, and inversely related to the ratio of bid–ask spreads.
Luo, Sun, and Mweene (Citation2005) explored these issues in a Chinese context. They used the co-integration theory and the Permanent–transitory (PT) models to analyse the price discovery mechanism and evolvement of the A and the B shares in the Shanghai Stock Exchange and the Shenzhen Stock Exchange markets. Their results show that the B shares have improved informational flow between the A shares and the B shares in the Shanghai Stock Exchange than that of the Shenzhen Stock Exchange. At the same time, the results also show that the A shares play a dominant role in price discovery in China’s emerging stock markets.
Pascual, Pascual-Fuster, and Climent (Citation2006) studied the price discovery process of the Spanish stocks listed on the Spanish Stock Exchange and cross-listed on the NYSE. They found that the home market leads in terms of price discovery which is attributable to its own trading activity. Frijns et al. (Citation2010) examined the price discovery of bilaterally cross-listed stocks in the Australian and New Zealand exchanges, and found that in both cases the home market is dominant in terms of price discovery. However, they also observe that as firms grow larger and their cost of trading in Australia declines, the Australian market becomes more informative. Ferguson (Citation2015) finds that investor utilization of information of firms cross-listed in both US and major market countries hinges on the extent to which information processing frictions of those firms are. News from the firms’ home market is relied upon to make trading decisions when the firms possess greater information processing frictions, whereas those with fewer information processing frictions utilize news from both US and home market.
Chen et al. (Citation2016), investigated the impact of short selling and margin trading on the price discovery and price informativeness of cross-listed firms, using a sample of Chinese firms listed on the China and Hong Kong stock exchanges. Their sample consisted of 67 Chinese cross-listed firms on A-share and H-share markets out of which 18 firms are allowed to be sold short/ traded on margin since March 2010. Using the adverse selection component of Lin, Sanger, and Booth (Citation1995), their findings indicate that for the group of Chinese cross-listed firms that are not allowed to be sold short or bought on margin, the home (A-share) market contributes more to the price discovery process over time. While for the group of cross-listed firms that are eligible for short selling and margin trading, the authors observe no significant difference in the contribution of either A- or H-share markets to the price discovery. The contribution of home market for these firms is even lower around the announcement of major events.
Su and Chong (Citation2007) studied the price-discovery process for the stocks cross-listed on the New York Stock Exchange (NYSE) and the Stock Exchange of Hong Kong (SEHK). Their findings suggest that the stock prices of these two exchanges are co-integrated and mutually adjusting, and that the SEHK makes more contributions than the NYSE to the price-discovery process.
3. Methodology
This section describes the estimation of the price discovery which we apply in this paper. Hasbrouck (Citation1995) information share and Gonzalo and Granger’s (Citation1995) Permanent–Temporary methods are utilized to model the price discovery process in the long run. We also employ the Ganger causality test to examine the return spillovers in the short term. Volatility spillovers are examined by a bivariate DCC-EGARCH model.
3.1. Vector error correction model
Based upon Engle and Granger (Citation1987), the representation of the vector error correction model in general terms can be shown as(1)
(1)
where β’ Yt-1 is the error correction term, α is a matrix of error correction coefficients which imply the adjustment speed to the deviations from the long-run equilibrium. Ai contains coefficients for short-term adjustment. αβ’Yt-1 describes the dynamic equilibrium relationship for price time series in long term. α is an important coefficient matrix that we use to analyse which market leads the price discovery process in the long run. For a bivariate case, α contains two coefficients, and
, for market 1 and market 2. If α1is small and
is large, it implies that market 1 leads market 2 in the long run. Market 2 leads market 1 if the other way around.
According to Hasbrouck’s (Citation1995) information share, we transform the VECM in Equation (1) into an integrated form
(2)
(2)
where is a matrix polynomial, L present the lag operator. Equation (2) can be rearranged to
(3)
(3)
where is the impact matrix. It presents the sum of all moving average coefficients.
et is the long-term impact for a new information to every market price. Based on Equation (3), Hasbrouck (Citation1995) information share can be derived.
3.2 Hasbrouck information shares
The impact matrix has the same rows (Baillie, Booth, Tse, & Zabotina, Citation2002; De Jong, Citation2002; Hasbrouck, Citation1995). The new information will contribute the same to all the prices in long term. In Hasbrouck definition, ψet is the permanent impact for price change. This part forms the common efficient price for all the prices. The proportion of contribution of market j to the variance of ψet is defined as
(4)
(4)
where var (ψet) . Equation (4) applies when
is a diagonal matrix, that is, there are no correlations between markets.
When is not diagonal, we apply the Cholesky factorization method to decompose
. So we obtain
(5)
(5)
where M is the lower triangular Cholesky factorization. is the j element of vector
. However, there is a problem when using Cholesky factorization. Different variable order results in different information share estimates for one market. Hence, we need to take into account different variable orders to obtain the upper and lower bounds for information share of each market. For a bivariate case, we have
According to Baillie et al. (Citation2002), we can compute the upper bound and lower bounds as follows(6)
(6)
(7)
(7)
where σ1 and σ2 are the standard deviations of the first and second markets, respectively. ρ is the correlation coefficient between the two markets. Equation (6) computes the upper bound of IS of the first market while Equation (7) gives the lower bound of IS of the same market.
3.3 Permanent–Temporary Gonzalo–Granger (PT/GG) method
The fundamental theory for the PT/GG model is that the unit-root series vector Yt has two components. One is a permanent common factor ft and the other is a short-term stationary factor Zt which does not have permanent impact. Then we have(8)
(8)
where A is a coefficient matrix, ft is a linear function of Yt. The transitory component Zt does not Granger causes ft . Equation (8) can be rearranged to(9)
(9)
where α⊥ is an orthogonal matrix to the error–correction coefficient matrix α. β⊥ is an orthogonal matrix to the co-integrating matrix β. α⊥ and β⊥ is normalized hence it will make the sum of vector equal to 1. α⊥ can be used to measure the contribution of each market to the price discovery process. For two different markets, market 1 and market 2, the PT/GG measure can be represented as
(10)
(10)
where α1 and α2 are the error correction coefficients for market 1 and market 2, respectively. The first element of Equation (10) is the contribution of market 1 to price discovery whereas the second is the contribution of market 2 to price discovery.
3.4. Granger causality test
Based on Equation (1), the Granger causality between the SSE and NYSE for a particular cross-listed stock in both exchanges can be tested by joint equality to zero of coefficients in Equation (1). The detailed procedure is shown below.
Suppose the dimension of series vector ΔYt equals to 2 and price series of the stock traded in SSE locates at the first in the vector; then we have the following null hypotheses established for the Granger causality based on Equation (1):
| 1. | For the Granger causality from SSE to NYSE | ||||
| 2. | For the Granger causality from NYSE to SSE | ||||
where αi(i = 1, 2) and are coefficients of matrix α and Ak in Equation (1), respectively. p is the lag order of the underlying VAR in Equation (1), which is selected by the AIC. Note that p may vary across the sampled cross-listed stocks. If either of the hypotheses above is rejected, the Granger causality exists.
3.5. Bivariate DCC-EGARCH model
To specify the error term structure of Equation (1), we adopt the bivariate Dynamic Conditional Correlation (DCC) Generalised Autoregressive Conditional Heteroscedasticity (GARCH) model proposed by Engle (Citation2002). The DCC GARCH specification may yield a better approximation to a variety of time-varying correlation processes and more accurate estimates of the conditional–variance matrix compared to other forms of bivariate GARCH specification (Engle, Citation2002; Tse & Tsui, Citation2002). The bivariate DCC GARCH (1, 1) model explaining the conditional covariance matrix of et is specified as follows.
Following Equation (1),
(11)
(11)
where is information set up to time t-1. The residual vector et is assumed to follow a student’s t distribution and v is the degree of freedom of the distribution. Ht is the conditional covariance matrix of et. Then we have
(12)
(12)
where
(13)
(13)
and
(14)
(14)
Here Dt is a 2×2 diagonal matrix consisting of the individual time-varying variances of residuals. denotes a diagonal matrix. The individual conditional variances in Dt are modelled in an exponential GARCH (EGARCH) model developed by Nelson (Citation1991), which is shown as
(15)
(15)
and(16)
(16)
h11,t and h22,t are the conditional variances of returns of a cross-listed stock traded in SSE and NYSE, respectively. In Equations (15) and (16), the autoregressive behaviour of variances is captured by parameters α2, β2, α4 and β4 where α2 and β2 reflect the effects of the arrivals of new shocks while α4 and β4 reflect the persistence of old news. Being notably, parameters α3 and β3 control asymmetry of volatility where the effect on volatility of past negative shocks is bigger than that of past positive ones. Negative signs of both parameters are expected for the existence of such asymmetry. Moreover, we examine volatility spillovers between SSE and NYSE for a cross-listed stock in Equations (15) and (16) via coefficients α5 and β5. α5 and β5 estimate spillovers from NYSE to SSE and that from SSE to NYSE, respectively. Finally, for the conditional variances to be stationary, α4 and β4 should be smaller than unity. The EGARCH model benefits modelling on the conditional heteroscedastic processes as it ensures the positivity of volatility estimation without constrains on parameters.
Recalling Equation (14), Rt is a 2 × 2 symmetric matrix comprised of conditional correlation and unity. Qt is a 2 × 2 matrix consisting of conditional variance–covariance of the standardized residuals. Qt follows a ARMA (1,1) process that can be represented as(17)
(17)
and
(18)
(18)
where is a 2 × 1 vector of standardized residuals denoted by
.
is a 2 × 2 unconditional variance–covariance matrix of
. In Equation (17), q11,t and q22,t denote the conditional variances of standardized disturbances
and
at time t, respectively. q12,t = q21,t is the conditional covariance between
and
at time t. a and b are scalar parameters. The positive semi-definiteness of Qt can be guaranteed given
and a + b < 1. a measures whether the correlation is conditional on past values in the short term while b examines whether the time-varying nature of correlation is persistent.
Parameter estimates of the bivariate DCC EGARCH specification can be obtained by maximizing the log-likelihood function for a bivariate Student’s t distribution. The contribution of each observation at time t to the log-likelihood can be expressed in general terms as
(19)
(19)
where is the Gamma function.
is the aforementioned degree of freedom for the Student’s t distribution controlling the heavy tails of the bell shape. v is restricted to be larger than 2 to make sure the existence of the covariance matrix. Ht is a conditional variance–covariance matrix defined in Equation (12) and
is a parameter vector containing all the coefficients of the DCC GARCH model.
Estimates for the parameter vector can be obtained by maximizing the log-likelihood over the sample period, which is expressed as
(20)
(20)
where T is the sample size.
4 Data
In this paper, we focus on the securities that are cross-listed on Shanghai and Shenzhen stock exchange and New York stock exchange. In our sample, there are nine firms (Aluminium Corp. of China Ltd. (ACH), China Eastern Airlines Corporation Limited (CEA), China Life Insurance Company Limited (LFC), China Petroleum & Chemical Corporation (SNP), China Southern Airlines Company Limited (ZNH), Guangshen Railway Co. Ltd. (GSH), Huaneng Power International Inc. (HNP), PetroChina Company Ltd. (PTR), Sinopec Shanghai Petrochemical Company Limited (SHI), Yanzhou Coal Mining Co. Ltd. (YZC). These nine firms stock trade in both Chinese stock exchange and American stock exchange.
Established in 1990, the Shanghai stock exchange has become one of the most important financial markets in China, playing an important role for the local economy. It is also becoming one of the largest capital markets in the world. By the end of 2015, there were totally 1081 companies listed in Shanghai with the total market capitalization hitting 29.52 trillion RMB. The total annual turnover in 2015 was 133.10 trillion RMB and the average daily turnover reached 545.59 billion RMB. The total capital raised in the equities market in 2015 was around 871.30 billion RMB. Compared to its counterpart in Shenzhen, the Shanghai stock exchange is more important for the Chinese capital market since it has more listed companies, provides more tradable shares and generates higher liquidity.Footnote3 Given these facts, we choose the stocks listed in the Shanghai stock exchange instead of Shenzhen for investigating their interaction with cross-listed counterparts in the New York stock exchange.
We have two reasons why nine cross-listed stocks are chosen for the study. First, following Su and Chong (Citation2007), we select the stocks that have long enough sample path in both Shanghai and New York stock exchanges. Our criterion is that the sample path should be minimally10 years. Second, the chosen stocks are all issued by the State-Own Enterprises (SOEs) in China, which are expected to have large trading volume, high turnover, and high liquidity in the market. This is because the SOEs are major suppliers for tradable shares in the Shanghai stock exchange (Chen et al., Citation2013). In addition, the SOEs have the largest market capitalization in the Chinese stock markets, imposing a substantial influence on the local economy. Hence, how their stocks interact with counterparts overseas is a major focus of this paper.Footnote4
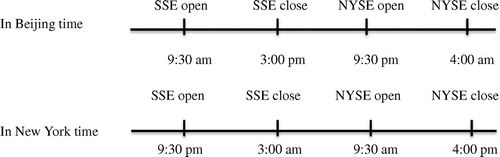
Figure shows the trading hours in NYSE and Shanghai and Shenzhen stock exchange. We can see from the figure that SSE trading hour is 12 h ahead of NYSE. SSE open at 9:30 am and close at 3 pm in Beijing time. NYSE trading hours is from 9:30 am to 4:00 pm in local time, but there is no overlapping hours between SSE and NYSE trading hours. In Beijing time NYSE open from 9:30 pm to 4:00 am and hence, there is no overlapping trading period between Shanghai and Shenzhen Stock Exchange and NYSE. The paper obtains daily price, bid price, ask price and daily volume directly from DataStream. The exchange rate between RMB and USD is extracted from Oanda Corporation though website and the data are collected from 1 January 2005 to 31 December 2014 and excludes the days where there is no trading activity.
Figure 1. Trading hours for SSE and NYSE.
In Table , we report the summary statistics for the nine cross-listed stocks in our sample. We compute the average price, average daily volume and average bid–ask spread from daily data we selected. For the average daily volume, we can see that for 10 companies’ stock in SSE has much higher daily trading activity than NYSE. China Petroleum & Chemical Corporation is the most liquid company because it has 88,769.65 average daily trading volumes on SSE. China Eastern Airlines Corporation Limited is the least liquid company compare to these nine companies on NYSE. It has only average 37.68 shares trading per day. Average daily trading volume may also connect with average bid–ask spread. As can be seen from the table, for nine cross-listed stocks on SSE has much more narrow spread than stock on NYSE. So from this summary statistics, we can understand that SSE has the greater trading activity for the nine cross-listed stocks.
Table 1. Summary statistics of the Chinese cross-listed stocks in NYSE and SSE
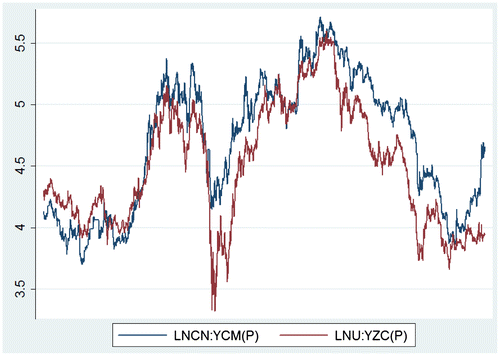
Figures –, present a price plots for all nine cross-listed stock in NYSE and SSE. In Figure , we draw a price plot for Aluminium Corp. of China Ltd and convert the stock price in NYSE to Chinese Yuan. It indicates that prices in SSE and NYSE for Aluminium Corp. of China Ltd are moving in the same direction and possible co-integrated. From above results, it gives us some impression that cross-listed stocks in the home market dominate. However, the study undertakes formal analysis to understand the price discovery effects on the cross-listed stocks of SSE and NYSE.
Figure 2. Price plot for Aluminium Corporation of China Ltd. (ACH).
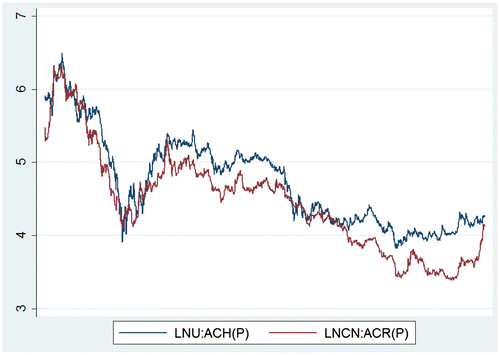
Figure 3. Price plot for China Eastern Airlines Corporation Limited.
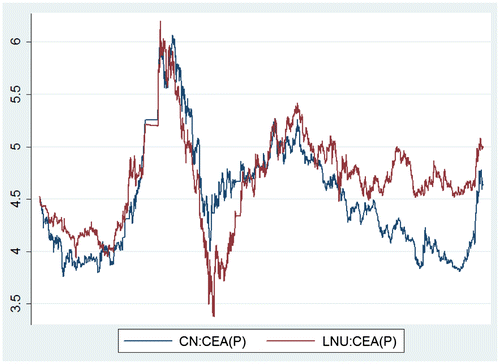
Figure 4. Price plot for China Life Insurance Company Limited.
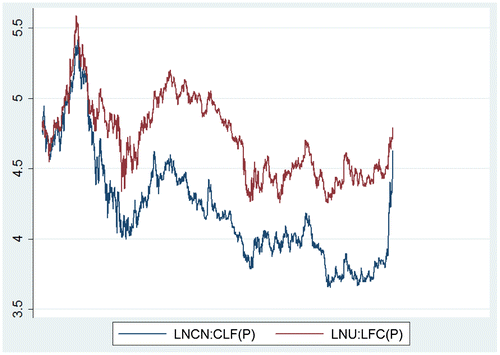
Figure 5. Price plot for China Petroleum & Chemical Corporation.
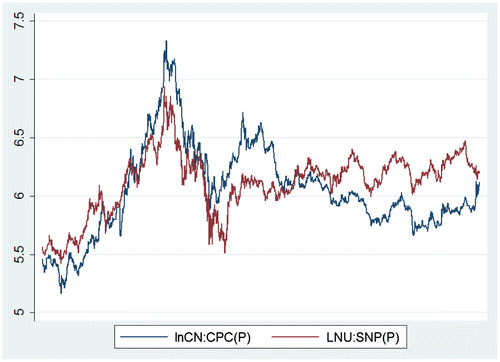
Figure 6. Price plot for China Southern Airlines Company Limited.
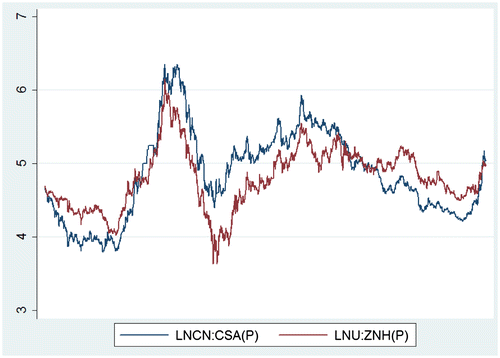
Figure 7. Price plot for Guangshen Railway Co. Ltd.
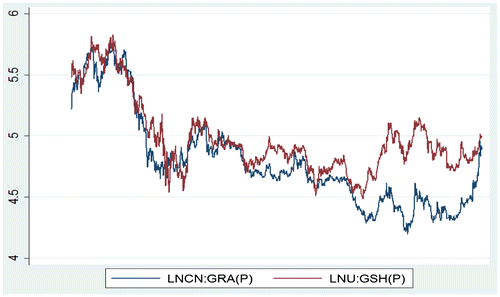
Figure 8. Price plot for Huaneng Power International Inc.
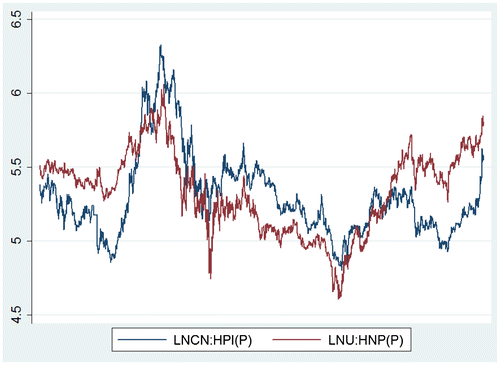
Figure 9. Price plot for Sinopec Shanghai Petrochemical Company Limited (SHI).
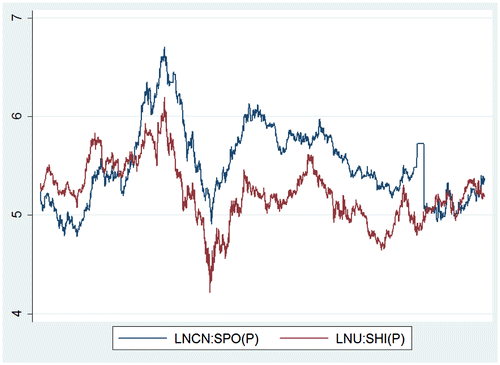
Figure 10. Price plot for Yanzhou Coal Mining Co. Ltd. (YZC).
5. Empirical results
This section presents the results of stationarity and co-integration tests of the two cross-listed stock prices on SSE and NYSE. Results of error correction coefficient, Hasbrouck information share and PT/GG measure are reported for the co-integrated stocks cross-listed on SSE and NYSE. For those stocks that are not co-integrated, the Granger Causality test is employed. Finally, the bivariate DCC-EGARCH model is estimated to capture the volatility spillovers between the cross-listed stocks of SSE and NYSE.
To check the stationarity of the cross-listed stock price series, the study performs Augmented Dickey–Fuller (ADF) unit root test (Citation1981). The null hypothesis for ADF test is that the time series has one unit root and hence, not stationary. The test statistics favours the non-rejection of the null hypothesis at 1% level of significance for the price series but rejection for the retune series. Hence all the cross-listed stock prices are integrated at order 1.
Further, the Table , suggests that the cross-listed stocks on SSE and NYSE have the same number of unit roots and indicates the possibility of co-integration between them. The co-integration is tested by the Johansen co-integration test and the results are presented in Table .
Table 2. Unit root tests
Table 3. Johansen co-integration test
It is evident from the Table , that the null hypothesis of no co-integration cannot be rejected in majority of the cases as the Trace statistics are lower than the critical values at 5% level. The exception is the Aluminium Corporation of China limited (ACCL) in which the Trace statistics are higher than the critical values and favours the rejection of the null hypothesis of no co-integration. The null hypothesis of one co-integration equation between the cross-listed stock prices for ACCL is not rejected at the 5% level, indicating the existence of co-integration.
The study, therefore, uses a vector error correction model (VECM) to estimate the error correction coefficients, Hasbrouck information share and PT/GG measure for ACCL to measure the price discovery of the cross-listed stocks. For the remaining eight, the study employs a vector autoregressive (VAR) model to test the Granger Causality between cross-listed stocks on SSE and NYSE. As such we examine the long-run lead–lag relationship of cross-listed stocks of ACCL and the short-run one of cross-listed stocks of the other companies. The results are presented in Tables and , respectively.
Table 4. The error correction coefficients, information share and common factor measure of Aluminium Corporation of China Limited
Table 5. Granger causality on VARs
It is evident from the Panel A of the Table , that the estimates of error correction coefficients of the cross-listed stocks on SSE and NYSE for ACCL are significant at the conventional levels. The magnitude of the error correction coefficient of the SSE is lower than the NYSE listed one. This implies that there is a two-way lead–lag relationship between SSE and the NYSE in the long term and the effect of SSE on NYSE is stronger than the other way round. Panel B and C, further reveals that, the SSE market contributes more to the price discovery process than the NYSE, in terms of higher estimates of information share lower and upper bounds as well as the PT/GG measure. Overall, Table suggests that the ACCL stock listed in SSE leads the NYSE in the long run.
Table reports, the Gonzalo–Granger estimation results for all of the cross-listed stocks in both SSE and the NYSE with the exception of the Aluminium Corporation of China Ltd. For the Huaneng Power International and Sinopec Shanghai Petrochemical, the cross-listed stocks on the NYSE Granger cause those in SSE, but not vice versa. This implies that in the cases of these two stocks, the NYSE leads SSE in the short term. For the remaining six stocks, Table suggests a two-way Granger causality between SSE and the NYSE. The Granger causality from NYSE to SSE is stronger than the other way around. Moreover, only checking the Granger causality of returns for the short-term lead–lag relationship is not enough to examine the price discovery process in the short term for the cross-listed stocks. Therefore, the study considers DCC-EGARCH model to capture the volatility spillovers in cross-listed stocks of the NYSE and SSE.
The study employs a bivariate DCC-EGARCH model to estimate the volatility spillovers between the cross-listed stocks of the NYSE and SSE because the results from the Granger causality results as shown in Table are less clear. The results of the bivariate DCC-EGARCH are presented in the Table .
Table 6. Bivariate DCC-EGARCH model
Briefly, the results indicate that there are two-way volatility spillovers for all of the cross-listed stocks. With the exception of Aluminium Corporation of China Ltd. and Huaneng Power International where the strength of spillovers from NYSE to SSE is almost the same as the other way around, the strength of volatility spillovers from NYSE to SSE for the remaining seven companies is almost double of the other way around. The result of the DCC-EGARCH model strongly suggests that information transmits from NYSE to SSE in the short run for the cross-listed stocks that trade at both sides.
6. Discussion and conclusions
International cross-listing has become increasingly common in recent years. A number of firms have cross-listed their shares on foreign exchanges. This has raised several interesting questions, such as the motivation and rationale of international cross-listing, and the effect of the cross-listing on the domestic stock performance. Using a sample of nine companies, this study examines how, and to what extent the trading of the cross-listed China-backed ADRs on the New York Stock Exchange (NYSE) contributes to the information flow and price discovery for the corresponding cross-listed stocks in Shanghai Stock exchange (SSE). The study period includes the stock return observations from January 2005 to December 2014. The study considers the vector error correction model, Hasbrouck information share, Gonzalo–Granger permanent–temporary (PT/GG) measure, Granger causality and bivariate DCC-EGARCH model to examine the price discovery dynamics across the cross-listed stocks.
This paper finds that only the cross-listed stocks of Aluminium Corporation of China Ltd. are co-integrated between SSE and the NYSE. The cross-listed stocks of the rest of the companies are not co-integrated. Hence we examine price discovery in the short and long terms, respectively. With respect to the Aluminium Corporation of China Ltd., the stocks listed in SSE have higher IS and PT/GG measures than their counterparts on the NYSE do. This indicates that SSE contributes more to price discovery in the long run than the NYSE does. For the remaining eight companies, we find there are two-way Granger causalities of cross-listed stocks between SSE and the NYSE. The strength of the causalities from the NYSE to SSE is larger than the other way around. The exceptions are Huaneng Power International and Sinopec Shanghai Petrochemical where the causalities solely run from NYSE to SSE. It is implied that the cross-listed stocks on the NYSE lead their counterparts in SSE in the short run.
In addition to price discovery in the pricing level, we examine volatility spillovers of the cross-listed stocks between the NYSE and SSE. The result of the bivariate DCC-EGARCH model suggests that there are two-way spillovers between the two markets. The spillovers from the NYSE to SSE are stronger than the other way around except Aluminium Corporation of China Ltd. and Huaneng Power International. The result implies that information flow is stronger from the NYSE to SSE than the reverse way in the short run.
Results of this study are in contrast to the previous studies that showed very little contribution for price discovery by Chinese ADRs on the NYSE. The present study indicates that the contribution for price-discovery of Chinese ADRs on the NYSE improved relatively than before, suggesting the implications of changing time frames and economic situations. Our results extend Su and Chong (Citation2007) in explaining price discovery dynamics from the short-term and long-term perspectives. Our findings on the long-term price discovery process are consistent with Frijns et al. (Citation2010) where the home market is dominant. Further, our findings on the price discovery process in the short run are consistent with Eun and Sabherwal (Citation2003) which suggest the dominance of foreign market over home one. This study can be extended in a few ways. For the NYSE and SSE, there is no overlapping for trading time. Therefore, results of the study should be explained with caution due to non-synchronous closing price. The future research could try to estimate the information share using after-hours trading data. Another way is using overlapped trading data. It means we might change the NYSE to other stock exchanges that have overlapped trading hours with SSE.
Additional information
Funding
Notes on contributors
Geeta Duppati
Geeta Duppati (PhD) is a senior lecturer in School of Accounting, Finance and Economics, Waikato Management School, Hamilton. Her current research interests are primarily concerned with corporate governance, asset pricing, corporate social responsibility, foreign investment and mergers and acquisitions. She has several publications in the area and is involved in professional development work with large corporates in India.
Yang (Greg) Hou
Yang (Greg) Hou is a senior lecturer at School of Accounting, Economics and Finance, Waikato Management School, University of Waikato, New Zealand. Yang’s research interest is asset pricing, applied financial econometrics, risk analysis and management, derivatives markets and volatility models.
Frank Scrimgeour
Frank Scrimgeour is head of School of Accounting, Economics and Finance and a professor of Economics at the Waikato Management School, University of Waikato. He has contributed numerous research publications pertaining to the economics of agriculture and agribusiness, the economics of the environment, the economics of regional development and Māori development, and financial economics and governance.
Notes
1. Even if the trading hours of the Chinese and US stock markets don’t overlap, the information transmission between the two markets occurs through the cross-border trading activities of international investors which are mainly comprised of Qualified Domestic Institutional Investors (QDIIs) and Qualified Foreign Institutional Investors (QFIIs) in both markets. The activities follow the theoretical models proposed by Hamao, Masulis, and Ng (Citation1990), Engle, Ito, and Lin (Citation1990), and Lin, Engle, and Ito (Citation1994) that the qualified investors are able to put orders in both domestic and foreign markets even though one of them is closed. The effects of their overnight trading will be taken into account after the market starts to trade. The information transmission between the Chinese and US stock markets has been investigated by Li (Citation2007), Lin, Menkveld, and Yang (Citation2009), Moon and Yu (Citation2010), Chow et al. (Citation2011), Long et al. (Citation2014), among others.
2. The asymmetric DCC model has also been applied for the sample and the results are qualitatively similar to the results on volatility spillovers of the DCC models. In addition, the AIC and SIC of the Asymmetric DCC model is higher than DCC model. This suggests inferior of fitness of data for the former model relative to the later. The results of the A-DCC model are not reported but are available upon request.
3. Refer to http://www.sse.com.cn.
4. Please note that the stocks of Petro China Company limited are excluded from our sample of cross-listed stocks because we have a small sample path for this company which is less than ten years and it did not fit into our criteria of trading volume and results showed that price series are stationary. Hence, we regarded the prices of this company as outliers to our sample. Therefore, their exclusion has no effect on our results.
References
- Allen, D. E., Amram, R., & McAleer, M. (2013). Volatility spillovers from the Chinese stock market to economic neighbours. Mathematics and Computers in Simulation, 94, 238–257.10.1016/j.matcom.2013.01.001
- Harris, F. B., McInish, T. H., & Wood, R. A. (2002). Security price adjustment across exchanges: An investigation of common factor components for Dow stocks. Journal of Financial Markets, 5, 277–308.10.1016/S1386-4181(01)00017-9
- Baillie, R. T., Booth, G. G., Tse, Y., & Zabotina, T. (2002). Price discovery and common factor models. Journal of Financial Markets, 5(3), 309–321.10.1016/S1386-4181(02)00027-7
- Chen, H. Q., Han, Q., Li, Y. X., & Wu, K. (2013). Does index futures trading reduce volatility in the Chinese stock market? A panel data evaluation approach. Journal of Futures Markets, 33(12), 1167–1190.
- Chen, J., Tourani-Rad, A., & Yi, R. H. (2016). Short sales and price discovery of Chinese cross-listed firms. International Journal of Managerial Finance, 12(4), 408–421.10.1108/IJMF-02-2015-0025
- Chen, K. C., Li, G., & Wu, L. (2010). Price discovery for segmented us-listed Chinese stocks: Location or market quality? Journal of Business Finance & Accounting, 37, 242–269.10.1111/jbfa.2010.37.issue-1-2
- Chow, G. C., Liu, C., & Niu, L. (2011). Co-movements of Shanghai and New York stock prices by time-varying regressions. Journal of Comparative Economics, 39, 577–583.10.1016/j.jce.2011.06.001
- Coffee, J. C., Jr (2002). Racing towards the top? The impact of cross-listings and stock market competition on international corporate governance. Columbia Law Review, 102(7), 1757–1831.
- Dickey, D., & Fuller, W. (1981). Likelihood ratio statistics for autoregressive time series with a unit root. Econometrica, 83–106.
- Doidge, C., Karolyi, G. A., & Stulz, R. (2004). Why are foreign firms listed in the U.S. worth more? Journal of Financial Economics, 71(2), 205–238.10.1016/S0304-405X(03)00183-1
- Emin, D. (2016). Effects of global incidents on dynamic correlations of emerging European countries. Eurasian Journal of Economics and Finance, 4(1), 1–23.10.15604/ejef
- Engle, R., & Granger, C. (1987). Co-integration and error correction: Representation, estimation, and testing. Econometrica, 55(2), 251–276. doi:10.2307/1913236
- Engle, R. F. (2002). Dynamic conditional correlation: A simple class of multivariate GARCH models. Journal of Business and Economic Statistics, 20, 339–350.10.1198/073500102288618487
- Engle, R. F., Ito, T., & Lin, W. -L. (1990). Meteor shower or heat waves? Heteroskedastic intra-daily volatility in the foreign exchange market, Econometrica, 58(3), 525–542.
- Eun, C. S., & Sabherwal, S. (2003). Cross-border listings and price discovery: Evidence from U.S.-listed Canadian stocks. The Journal of Finance, 58(2), 549–575.10.1111/1540-6261.00537
- Ferguson, N. J. (2015). Investor Information Processing and Trading Volume. Asia-Pacific Journal of Financial Studies, 44(2), 322–351.10.1111/ajfs.2015.44.issue-2
- Frijns, B., Gilbert, A., & Tourani-Rad, A. (2010). The dynamics of price discovery for cross-listed shares: Evidence from Australia and New Zealand. Journal of Banking and Finance, 34, 498–508.10.1016/j.jbankfin.2009.08.014
- Gonzalo, J., & Granger, C. (1995). Estimation of common long-memory components in cointegrated systems. Journal of Business & Economic Statistics, 13, 27–36.
- Guo, B., Han, Q., Liu, M., & Ryu, D. (2013). A tale of two index futures: The intraday price discovery and volatility transmission processes between the china financial futures exchange and the singapore exchange. Emerging Markets Finance and Trade, 49(s4), 197–212.10.2753/REE1540-496X4905S414
- Hamao, Y., Masulis, R. W., & Ng, V. (1990). Correlations in price changes and volatility across international stock markets. Review of Financial Studies., 3(2), 281–307.10.1093/rfs/3.2.281
- Hasbrouck, J. (1995). One security, many Markets: Determining the contributions to price discovery. The Journal of Finance, 50(4), 1175–1199.10.1111/j.1540-6261.1995.tb04054.x
- De Jong, F. (2002). Measures of contributions to price discovery: A comparison. Journal of Financial Markets, 5, 323–327.10.1016/S1386-4181(02)00028-9
- Koumkwa, S., & Susmel, R. (2005). Arbitrage and convergence: Evidence from Mexican ADRs. Journal of Applied Economics, 11(2), 399–425.
- Koutmos, G., & Booth, G. G. (1995). Asymmetric volatility transmission in international stock markets. Journal of International Money and Finance, 14, 747–762.10.1016/0261-5606(95)00031-3
- Koutmos, G., & Tucker, M. (1996). Temporal relationships and dynamic interactions between spot and futures stock markets. Journal of Futures Markets, 16, 55–69.10.1002/(ISSN)1096-9934
- Li, H. (2007). International linkages of the Chinese stock exchanges: A multivariate GARCH analysis. Applied Financial Economics, 17, 285–297.10.1080/09603100600675557
- Lieberman, O., Ben-Zion, U., & Hauser, S. (1999). A characterization of the price behavior of international dual stocks: An error correction approach. Journal of International Money and Finance, 18, 289–304.10.1016/S0261-5606(99)00003-0
- Lin, W. L., Engle, R. F., & Ito, T. (1994). Do bulls and bears move across borders? International transmission of stock returns and volatility Review of Financial Studies, 7(3), 507–538.10.1093/rfs/7.3.507
- Lin, J., Sanger, G., & Booth, G. (1995). Trade size and the components of the bid-ask spread. Review of Financial Studies, 8(3), 48–57.
- Lin, K. P., Menkveld, A. J., & Yang, Z. (2009). Chinese and world equity markets: A review of the volatilities and correlations in the first fifteen years. China Economic Review, 20, 29–45.10.1016/j.chieco.2008.11.003
- Long, L., Tsui, A. K., & Zhang, Z. (2014). Conditional heteroscedasticity with leverage effect in stock returns: Evidence from the Chinese stock market. Economic Modelling, 37, 89–102.10.1016/j.econmod.2013.11.002
- Luo, B., Sun, L., & Mweene, R. (2005). The evolvement and relevant factors of price discovery: A case study of cross-listed stocks in China. Expert Systems with Applications, 29(2), 463–471.10.1016/j.eswa.2005.04.042
- Moon, G.-H., & Yu, W. C. (2010). Volatility spillovers between the US and China stock markets: Structural break test with symmetric and asymmetric GARCH approaches. Global Economic Review, 39(2), 129–149.10.1080/1226508X.2010.483834
- Nelson, D. (1991). Conditional heteroskedasticity in asset returns: A new approach. Econometrica, 59, 347–370.10.2307/2938260
- Ng, L., & Wu, F. (2007). The trading behavior of institutions and individuals in Chinese equity markets. Journal of Banking and Finance, 31, 2695–2710.10.1016/j.jbankfin.2006.10.029
- Pascual, R., Pascual-Fuster, B., & Climent, F. (2006). Cross-listing, price discovery and the informativeness of the trading process. Journal of Financial Markets, 9(2), 144–161.10.1016/j.finmar.2006.01.002
- Qadan, M., & Yagil, J. (2012). Main or satellite? Testing causality-in-mean and variance for dually listed stocks. International, Journal of Finance and Economics, 17, 279–289.10.1002/ijfe.v17.3
- Reese, W. A., & Weisbach, M. S. (2002). Protection of minority shareholder interests, cross-listings in the United States, and subsequent equity offerings. Journal of Financial Economics, 66, 65–104.10.1016/S0304-405X(02)00151-4
- Su, Q., & Chong, T. T.-L. (2007). Determining the contributions to price discovery for Chinese cross-listed stocks. Pacific-Basin Finance Journal, 15(2), 140–153.10.1016/j.pacfin.2006.07.002
- Tse, Y. K. (1999). Price discovery and volatility spillovers in the DJIA index and futures markets. Journal of Futures Markets, 19(8), 911–930.10.1002/(ISSN)1096-9934
- Tse, Y., & Booth, G. G. (1996). Common volatility and volatility spillovers between U.S. and Eurodollar interest rates: Evidence from the futures market. Journal of Economics and Business, 48, 299–312.10.1016/0148-6195(96)00016-1
- Tse, Y. K., & Tsui, A. K. C. (2002). A multivariate generalized autoregressive conditional heteroscedasticity model with time-varying correlations. Journal of Business & Economic Statistics, 20(3), 351–362. doi:10.1198/073500102288618496
- Xie, S. Q., & Mo, T. P. (2014). Index futures trading and stock market volatility in China: A difference-in-difference approach. Journal of Futures Markets, 34(3), 282–297.10.1002/fut.21650
- Yang, J., Yang, Z., & Zhou, Y. G. (2012). Intraday price discovery and volatility transmission in stock index and stock index futures markets: Evidence from China. Journal of Futures Markets, 32(2), 99–121.10.1002/fut.v32.2
