?Mathematical formulae have been encoded as MathML and are displayed in this HTML version using MathJax in order to improve their display. Uncheck the box to turn MathJax off. This feature requires Javascript. Click on a formula to zoom.
Abstract
Rice is an important source for foreign exchange earnings for Pakistan’s economy, keeping this fact in mind, this study is to calculate competitiveness of rice export of Pakistan in international market compared to largest exporter countries and this article is the first empirical attempt using a panel-gravity approach by employing PPML technique and to find out potential countries for Pakistani rice export to 144 countries over the period 2003–2016. The outcomes of this study revealed that as compared to other major exporters of rice in the international market, Pakistan had high competitive and comparative advantage in the exportation and production of rice. We confirm the positive relationship between rice export of Pakistan and the main components of the gravity model, GDP of Pakistan and trading partner, the difference in income, common border, and WTO membership and an inverse relationship with distance, exchange rates and trade agreement. The results for rice export potential suggest Pakistan still has plenty of rice export potential with 109 countries and as such Pakistan can possibly reduce and gain foreign exchange earnings to reduce the trade deficit by targeting these countries. So as to utilize the potential benefits of rice exports, policy makers need to reinforce the competitiveness in rice sector of Pakistan.
PUBLIC INTEREST STATEMENT
The paper explores the competitiveness of Pakistani rice in the world market and export potential with the global world. The study revealed that Pakistan had high competitive and comparative advantage in the exportation and production of rice as compared to other major exporters of rice in the international market. The authors used panel gravity model to show that Pakistan has the potential of increasing rice exports to 109 countries. The contribution of the paper is to find the rice export potentials of Pakistan and to determine the competitiveness of Pakistani rice in the world market.
1. Introduction
Rice is one of the most important food grains in the world, accounting for more than 20% of global calories consumed and 31% in low-income countries. Therefore, policies that concern rice prices, production, and trade have a large impact on the poor. In Pakistan, agriculture constitutes the largest sector of the economy. Majority of the population, directly or indirectly are depending on this sector. Agriculture sector’s contribution in Pakistan total gross domestic product (GDP) about 24% and accounts for half of the employed labour force and is the major source of foreign exchange earnings. Generally, agriculture production is divided into two types, food crops and cash crops. Farmers cultivated food corps for their own usage and cash crops cultivated for commercial purpose. Similarly, rice is the second staple food after wheat and it is contributing 3.2% to agriculture and 0.6% in 2016 clearly dropped if compared with previous year’s 0.91% in 2013.
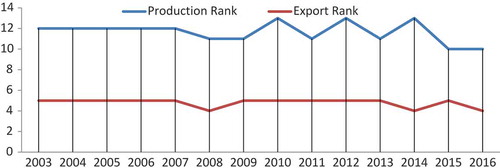
Rice is a staple food for approximately half of the world’s population and has the third uppermost world-wide production as an agriculture commodity, subsequent to sugar cane and maize. Rice production and consumption is concentrated in the Asian region with China, India, Thailand and Indonesia are among the largest producers and consumers. Rice cultivation is well-suited to countries with low labour costs and high rainfall, as it is labour-intensive to cultivate and requires ample water. Pakistan is the world’s 10th largest producer of rice, following China, India, Indonesia, Bangladesh, Viet Nam, Myanmar, Thailand, Philippines and Brazil and it is the 4th largest exporter following India, Thailand and USA (FAO, Citation2017; ITC, Citation2017) see Figure . Since 2003 to 2016 Pakistan produces an average of 7.89 million tones rice every year and it contributed about 9.2% to world rice export (FAO, Citation2017; ITC, Citation2017). Most of the rice varieties are grown in the land of two provinces Punjab and Sindh, where millions of the farmers depend on its cultivation, as it is their major source of income.
Figure 1. Production and exports rank of Pakistani rice compared to other countries.
Source: Authors’ calculation based on FAO, 2017
The purpose of this study was to analyse the competitive position of Pakistan in World rice export and to find out new markets for Pakistan by employing gravity model of trade. There are many countries in the world where Pakistan’s rice exports are zero or very few, so we will highlight those countries from where Pakistan can earn considerable foreign exchange and develop his agricultural sector and create more job opportunities. There are very few studies on Pakistani rice competitiveness in the international market. Abdullah et al. (Citation2015) only incorporate RCA while calculating Pakistani rice competitiveness and they did not mention the potential markets for Pakistani rice. This study first calculated RCA of Pakistani rice and then calculates potential markets for Pakistani rice by using panel-gravity approach. The gravity model turns out to be in greatly accepted approach as it deals with all kinds of trade flows Anderson (Citation2016), Anderson and Yotov (Citation2016). There are 144 countries in our gravity model over the time period 2003–2016. There are many countries where Pakistan rice export is zero that may cause heteroskedasticity in trade data, to deal with this issue study uses Poisson Pseudo Maximum Likelihood (PPML) estimator by Silva and Tenreyro (Citation2006, Citation2011)). They argued that it performs splendidly in the presence of heteroskedasticity and zero trade observation. Therefore, this study leads to make new research results for policymakers and rice industry of Pakistan.
Its remainder proceeds as follows, Section 2 briefly explained the literature related to our study and on gravity model theoretical to an empirical approach. The model specification, data sources and methodological aspects are introduced in Section 3. While Section 4 reports and discusses estimation results from RCA, RCA# and gravity model by using PPML estimation technique and the potential markets for Pakistani rice exports. Finally, Section 5 winds up with conclusions with policy implications.
2. Review of literature
There are very few studies on rice competitiveness and potential markets especially in case of Pakistan. To measure the export competitiveness of 10 major rice exporters of the world, we employed Balassa’s (Citation1965) and Vollrath’s (Citation1991) Revealed Comparative Advantage (RCA) competitive index. A plenty of researchers such as (Balassa, Citation1989; Batra & Khan, Citation2005; Chen, Citation1995; Hinloopen & Van, Citation2001; Irshad and Xin, Citation2015a; Irshad, Xin, Hao, & Arshad, Citation2017; Irshad and Xin, Citation2017a ; Laursen, Citation1998) have employed these indicators to estimate the export competitiveness and comparative advantages for diverse data sets commodities among countries. Bender and Li (Citation2002) have examined the RCA indices between economies in East Asia, Southeast Asia and Latin America over the period 1981–1997. There evidence strongly suggests that even though the strong export performance knowledgeable by East Asian economies, they are trailing their comparative advantage to the lower-tier economies in Southeast Asian and Latin America. Akhtar, Sharif, and Shah (Citation2009) have examined the global competitiveness of Pakistan’s fruit exports by employing RCA index. Their results revealed that Pakistan has a huge comparative advantage in fruit exports. Abdullah et al. (Citation2015) examined the Pakistani rice export competitiveness over the period 2000–11compared with another major exporter of rice to the world. Their results revealed that as compared to other major exporters of rice in the world, Pakistan had a highly competitive and comparative advantage in the production and exportation of rice.
The first eminent study exploring trade flows goes back to Jan Tinbergen’s article “Shaping the world economy: propositions for an international economic policy” long ago in 1962. He believed that based on Newton’s gravity law, which is stated as the trade between two countries can be a function of their economic sizes and distance between them Tinbergen (Citation1962). Tinbergen’s theoretical foundation of this model was ameliorated by Linnemann (Citation1966), Anderson (Citation1979), Bergstrand (Citation1989), Deardorff (Citation1998), Anderson and Wincoop (Citation2003) and Guttmann and Richards (Citation2004). By the time, scholars originated the empirical econometric approaches of the gravity model by using several actual and mannequin or dummy variables with regards to trade flows of various economies. For example, Byers, Talan, and Lesser (Citation2000) applied a thrifty gravity model for three Baltic countries of Estonia, Latvia and Lithuania after the collapse of the Soviet Union. Their results affirmed that the trade flows of these nations were not merely reduced, but also shifted to the members of the former Soviet Union. Porojan (Citation2001) attempted to discover the trade flows–spatial effects nexus through the gravity model for the European Union (EU) and some of her potential members. Baier et al. (Citation2002) explain the endogeneity of international trade flows and free trade agreements by employing gravity approach. Evenett and Keller (Citation2002) theoretically explain the success of gravity equation and they have proved that gravity is the best approach to modelling trade-related flows. In another study, Martinez-Zarzaso (Citation2003) evaluated the effects of preferential agreements on the bilateral trade flows among 47 countries in several economic blocs and areas during 1980–1999. Papazoglou (Citation2007) endeavoured to discover potential trade flows for Greece to the EU member states by employing a gravity model. In his conclusion, he stated that actual export of Greece fall short of potential ones, while the opposite is true for Greek imports. Xuegang, Zhaoping, and Xuling (Citation2008) used the three explanatory variables GDP, GDP per capita and Shanghai Cooperation Organization (SCO) to construct a gravity model for Xinjiang’s bilateral trade. Their outcome illustrated that all the three variables distress the Xinjiang’s bilateral trade. Ekanayake, Mukherjee, and Veeramacheneni (Citation2010) examined the trade diversion effects of the regional trade agreements in Asia on intra-regional trade flows by using a gravity model and annual data for 19 Asian countries during 1980–2009. The findings represented the negative sign of ECO and positive signs of ASEAN, BA and SAARC RTAs. Another industrial sector level study by Chen and Novy (Citation2011) applied a gravity model to find out the trade integration across manufacturing industries in EU countries. They accomplished that substantial technical barriers to trade in specific industries are the most important trade barriers. Yang and Martinez-Zarzoso (Citation2014) applied a gravity model to analyse the ASEAN–China free trade agreement (ACFTA) over the period 1995 to 2010. They conclude that the ACFTA leads to significant trade creation and a positive relationship between exports and ACFTA is also confirmed in the case of both agricultural and manufactured goods. Tang, Zhang, and Findlay (Citation2014) investigated the features of traded services in China by using the modified gravity model. They found that the law of comparative advantage does apply to China ‘services trade. A study by Thorbecke (Citation2015) estimated a gravity model to find whether China’s exports to the USA are an outlier. The results of the assessment indicate that these exports have been more than predicted in every year since 2005. Irshad and Xin (Citation2017b) employed gravity for examined South Korea’s international trade over the period 2001–16 by using dissimilar estimation techniques. Their results showed that the trade pattern of South Korea exports and imports relies on GDP, trade openness and regional trade agreements and bilateral exchange rates while negatively influence by transportation cost and geographically landlocked countries. Another research by Irshad, Xin, Shahriar, and Ali (2018) and Irshad, Xin, Shahriar, and Arshad (2018) examined China’s trade pattern with OPEC member counties over the year 1990–2016 by employing gravity model. The results confirmed that China’s bilateral trade with OPEC members positively impacts on GDP, GDP per capita, trade openness in China and WTO member countries in OPEC, while negatively influence on trade cost and supports Linder Hypothesis. In our study, we have employed two kinds of competitiveness indices and the gravity model of trade for estimation Pakistan’s rice competitiveness and the potential markets for Pakistan in global world.
3. Data and methodology
For this study, first, we calculate RCA and RCA# for the period from 2003 to 2016 for 10 major rice exporting countries was extracted from Food and Agriculture Organization of United Nations and International Trade Center (ITC). These 10 countries were selected on the basis of exports volume of rice in 2016. To measure the export competitiveness of 10 major rice exporters in the global market, we used Balasa’s (Citation1965) and Vollrath’s (Citation1991) RCA competitive index. By following Akhtar et al. (Citation2009) and Abdullah et al. (Citation2015), in this study, we used two measures named as RCA and RCA#. In order to measure the competitiveness, Balassa (Citation1965) had developed RCA measure. Afterwards, to avoid double counting problem and to measure the international competitiveness, Vollrath (Citation1991) developed RCA’s improved and comprehensive version RCA#. Bender and Li (Citation2002) had also used this sophisticated measure for international competitiveness. Akhtar et al. (Citation2009) and Abdullah et al. (Citation2015) have defined RCA and RCA# as:
In above equation (1), is the relative competitive advantage of product i in county j in the year t,
is for total world export of product i in year t, similarly
stands for total volume of exports in country j in year t, and last one is
is the total volume of world exports in year t. The RCA index for measuring a comparative advantage (disadvantage) in the export of commodity i by country j if it’s RCA recorded greater or less than one.
Similarly, measured the relative export advantage, where
are the total exports of the country minus the exports of rice. Likewise
and
were world rice exports and total rice exports minus rice exports of country j, correspondingly. Consequently
Could be defined as the logarithm of the relative export advantage
. A positive value indicates a comparative/competitive advantage, while a negative value point towards a comparative/competitive disadvantage.
The second part of this paper covers Pakistan’s rice exports to 144 countries over the years 2003–2016 for gravity estimation. Since last many decades, gravity model lingered very authoritative tool for examining global trade. It’s encouraged by Newton’s law of gravity. Trade between countries is directly proportional to their economic size while inversely proportional to trade costs. Gross Domestic Product (GDP) is extensively used as a proxy for economic size to magnetize trade among countries. On the other hand, direct distance as crow flies taken as a proxy for transportation cost as a resistance to trade. Many researchers use augmented gravity model with different other variables to estimate different determinants of trade and develop its explanatory power. Several potential inadequacies in the specification of gravity model were commented by successive researchers including potential endogeneity dilemma (Lee & Swagel, Citation1997; Trefler, Citation1993), zero trade values dilemma (Hallak, Citation2006; Helpman, Melitz, & Rubinstein, Citation2008) and heteroskedasticity problems by Hurd (Citation1979). Clarification to endogeneity dilemma was suggested by (Baier & Bergstrand, Citation2007; Magee, Citation2003) by introducing dissimilar types of fixed effects while estimating gravity model. Silva and Tenreyro (Citation2006) anticipated Poisson Pseudo Maximum Likelihood (PPML) estimator for gravity model and argued that it performs splendidly in the presence of heteroskedasticity in trade data. Later on, Silva and Tenreyro (Citation2011) provided evidence that PPML estimator also has consistence results in the presence of zero trade observation.
The initial structure of the gravity model which was initiated by Tinbergen (Citation1962) has the following composition:
Where the export volume of country i to j () has a relationship with the GNP in county i (
) and in country j (
); meanwhile, the distance between countries i and j (
) is taken as a proxy for transportation cost. “ln”is the natural logarithm and
is the stochastic error term. The standard gravity model once estimated provides with relatively good results. However, the real world situation is not so simple to be represented by such a few factors. Over the years, numerous scholars have developed the above basic form by using other real or dummy variables.
In our case, we have included specific variables in equation (4) then the gravity equation can be written as:
Where Pakistan rice export to country j in year t,
are the Gross Domestic Product (GDP) of Pakistan and partner country in specific year. Similarly,
distance between Pakistan and partner country as proxy for transportation cost.
Absolute per capita GDP differential is using to measure the Linder and H-O hypothesis. The coefficient have a positive sign, countries have the H-O bilateral trade pattern, while the negative sign of this variable can appear under the Linder hypothesis.
means bilateral exchange rates of Pakistan and the partner country. The exchange rate has an effect on the trade surplus (or deficit), which in turn affects the exchange rate, and so on. In general, however, a weaker domestic currency stimulates exports and makes imports more expensive. Conversely, a strong domestic currency hampers exports and makes imports cheaper Investopedia (Citation2017).
a dummy variable for common border. If both countries shares common border then it takes value of 1 otherwise 0.
also a dummy variable to access the effect of World Trade Organization (WTO) proxy for International Trade Treaty (ITT) on Pakistan rice exportation to the global world. It takes value 1 if both countries are the member of WTO at the specific year otherwise 0. To get the impact of trade agreements we have taken one more dummy variable
. If Pakistan and trading partner involved in any trade agreement then it takes value 1 otherwise 0, as a proxy for political and economic relations. “ln”is the natural logarithm,
coefficients to be estimated and
is the stochastic error term.
denotes time fixed effects. Table explains all the variables with their expected signs and data sources.
Table 1. Description of variables
Equation (5) is valid only in case where and problematic when
because log of zero is not defined. Normally, there are many cases where two countries have zero trade for a specific period of time. Recently, many studies advocated not to use log-linear model and preferred to choose poison models [Burger, Burger, Van Oort, and Linders (Citation2009); Lateef et al. (2017); Sun and Reed (Citation2010); Silva and Tenreyro (Citation2006); Westerlund and Wilhelmsson (Citation2011)].
So, we have specified our model as follows:
In order to cope up endogeneity problem, we have estimated the equation (6) with time fixed effects; it will also help to control different other macroeconomic factors like global economics boom or recessions Silva and Tenreyro (Citation2011); Lateef et al. (2017).
In our model, there are many countries where Pakistan appeared with zero rice export. Our main purpose is to calculate gravity model and the potential markets for Pakistani rice. The coefficients estimated from the gravity model are used to calculate the predicted rice exports of Pakistan, and then these predicted rice exports are compared to the actual rice exports to see whether or not the export potential for Pakistan exist. Equation (7) provides the methodology used to determine these potentials.
Where stands for rice export potential of Pakistan in partner country. The plus one (+ 1) and minus one (−1) in equation (7) are used standardize the export potential. Accordingly the reported potentials will be between minus one (−1) and plus one (+ 1) where a positive index value (0, 1) demonstrates a higher rice trade than what is predicted by the model and that the exports of rice have reached or exceeded the potential level whereas a negative index value (−1, 0) reveals the opposite scenario Mohmand et al., (Citation2015). In another method to calculate Pakistan’s rice exports, we will use the absolute difference between the potential and actual level of trade
to forecast the future trade direction or potential in new markets Gul and Yasin (Citation2011). A positive value implies the possibility of trade expansion in the future while a negative value shows that Pakistan has exceeded its rice export potential with particular country. By using differentiation indicators, we can categorize those countries with which Pakistan has potential for the expansion of rice exports or otherwise.
4. Results and discussions
4.1. RCA estimations
We shall discuss all the results in this section. We have calculated RCA for Pakistani rice exports with the world and compare it with top 10 major rice exporting countries from equation (1). Likewise, for RCA# we have estimated equation (2) to get a relative export advantage for Pakistani rice in the world market. Finally, we have calculated gravity equation with the PPML time fixed effects command to get potential markets for Pakistani rice.
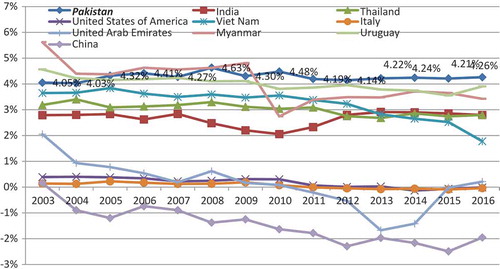
Figure contained the information about percentage contribution in financial terms of each country over the time in overall rice exports of the world. Pakistan’s rice contribution in world rice exports more in 2008 and 2010 as compared to other focus years. Pakistan did not formulate any serious attempt to increase its percentage share in overall the rice exports. The average share of Pakistani rice in world market 9.2% over the time 2003–2016, following by Thailand 24.1%, India 19.26%, Viet Nam 12.52% and USA 10.55%, respectively. Thailand had a major contribution to overall world’s rice exports. India’s growth rate in rice exports also increased over time but the USA has mixed kinds of results and its contribution to rice exports decreased since 2011.
Figure 2. Percentage contribution in overall world’s rice exports (in terms of Dollar value).
Source: Authors’ compilation based on UN Comtrade and FAO.
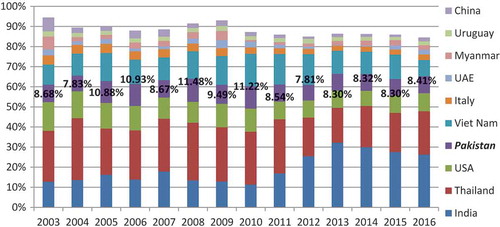
The share of Italy had decreased in rice exports. Myanmar, China and Uruguay also appeared with decreasing trends throughout the study period (Figure ).
Figures and contained the information about competitiveness indicator (RCA and RCA#) of major rice exporters in the world. It is witnessed that the competitiveness of Pakistani rice has the ability to compete major rice exporter in the world. Thailand and India were the largest Asian exporters of rice with 47.82% of the world market share in 2016, while Pakistan ranked 5th with 9.2% share to the world total rice export, but having the greatest share to rice export does not mean that Thailand and India have the greatest competitive advantage. Pakistan ranked at the top with an average value of RCA 66.4% and RCA# 4.27% over the year 2003–2016. The highly acceptable Pakistani Basmati rice was itself a brand image of Pakistan throughout the world and it was being exported to around 70 countries in the world Abdullah et al. (Citation2015).
Figure 3. Competitiveness indicators (RCA) of Pakistan compared with major rice exporters.
Source: Authors’ calculation
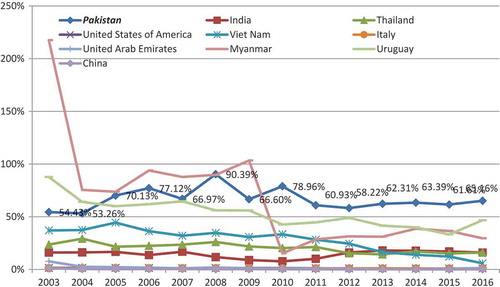
Figure 4. Competitiveness indicators (RCA#) of Pakistan compared with Major rice exporters.
Source: Authors’ calculation.
The aroma and the length of the Pakistani rice give an exceptional competitive edge to Pakistan in rice trade. Even though Pakistan had the highest competitive advantage over other major players of the world in rice export, but the competitiveness of Pakistani rice showed variation in different years of world export patterns because Pakistani producers and exporters were facing the burdens of high tax rate, production cost, high prices and electricity shortage. Lacking Research and Development (R&D) was also one of the major reasons behind the decline in rice exports competitiveness of Pakistan.
4.2. Gravity estimations
4.2.1. Panel cross-section dependence test
Cross-section dependence in macro panel data has acknowledged a lot of consideration in the emerging panel time series literature over the past decades. This kind of correlation possibly will occur from worldwide common shocks with heterogeneous impact across countries, such as the oil crises in the 1970s or the global financial crisis from 2008 onwards. Alternatively, it can be the result of local spillover effects between countries or regions (Eberhardt & Francis, Citation2010; Moscone & Elisa, Citation2009). Before estimating gravity equation, CD test should be tested to observe whether the sample data are cross-sectionally dependent or independent. Otherwise, based on the assumptions (Breusch & Pagan, Citation1980; Pesaran, Citation2004), the results of our gravity equation would be prejudiced and incompatible. In accordance with the time and cross sections in our gravity equation, Pesaran’s (Citation2004) residual CD test is calculated anchored in the pairwise correlation coefficients in this fashion:
We have calculated CD test only for time-variant variables in our gravity equation because of CD test unable to define in case of time-invariant variables (Rasoulinezhad, Citation2017; Rasoulinezhad & Kang, Citation2016; Irshad, Xin, Shahriar, & Ali, 2018; Irshad, Xin, Shahriar, & Arshad, 2018). There are zero values in our dependent variable and we have dropped dummies because it is not defineable in CD test however we calculate it with the whole sample. Based on the result of Pesran’s (Citation2004) CD test, shown in Table , the null hypothesis (no CD in residuals) can be strongly rejected at the 5% level. It implies that all the panel time series have strong evidence for cross-sectional dependence.
Table 2. Results of Pesran’s (Citation2004) CD test
4.2.2. Gravity results and discussion
After confirming the cross-sectional dependency in our variables, the regression outcomes for gravity equation (6) are presented in Table . To control for multicollinearity dilemma as suggested in previous literature, we are breaking the gravity equation into three different groups to treat GDP and income variables separately. However, there is no big difference to calculate income variables separately or together as shown in Table . All the models are showing expected signs and highly significance results however in this we only discuss and focusing at Model-VI because it is our benchmark model and later we calculate potential based on coefficients estimated by Model-VI.
Table 3. Gravity results with PPML and time-fixed effects, (2003–2016)
Table 4. Rice export potentials of Pakistan
In order to cope up endogeneity dilemma, we have estimated the equation (5) with time fixed effects; it will also facilitate to control different another macroeconomic factor like a global economic boom or recessions Yang and Martinez-Zarzoso (Citation2014). Our gravity model contains Pakistan’s rice exports to 144 trading partners over the periods 2003 to 2016. Many countries with zero trade and to deal with zero trade observations we have used PPML method as suggested by Silva and Tenreyro (Citation2006). The similar method was also used by other researchers specifically for agricultural trade (Fadeyi, Bhata, et al., Citation2014; Sun & Reed, Citation2010). Table represents the estimation results which show that most of the variables appeared with expected signs and significant level. Higher GDP of importer must have a positive and statistically significant effect on trade because it depicts higher demand potential of importing country. Conversely, higher GDP of exporter indicates higher production potential that may lead to higher exports. Our results found this is true for rice exports of Pakistan at 1% increase in GDP Pakistan and trading partners which leads to 2.21% [exp(0.7942)] and 1.13% [exp(0.1222)] increase in rice export of Pakistan, respectively. It shows the positive significant relationship between Pakistani rice export and income of partner country which indicates that, if we put other things remains constant, bigger countries in terms of GDP (China, USA, EU, UK etc.) will import more rice from Pakistan.
In case of distance as a proxy for transportation cost, the negative sign of its coefficient represents that geographical distance has a negative impact on Pakistani rice exports. The distance variable suggests that as the distance between the countries increases by 1%, the rice exports of Pakistan decreases 0.46% [exp (−0.7707)]. It explains that Pakistan has more rice trade with countries for which transportation costs are lower as compared to countries for which transportation costs are higher. Moreover, the effect of absolute per capita differential (APYD) on Pakistani rice export is positive and significant. A 1% increase in APYD leads to a 1.15% increase in rice exports from Pakistan to trading partners. This result is in line with the Heckscher–Ohlin theory which argues that nations would trade more if their factor endowment is different. Additionally, our result does not support Linder’s (Citation1961) hypothesis which predicts a negative sign of APYD and believes on the impact of income similarities of countries on trade flow. A higher exchange rate normally has a positive impact on exports. But in our case, we have found negative and significant sign of this variable. A 1% appreciation in exchange rate of Pakistan with trading partner country leads to 1.06% decrease in rice export of Pakistan. There are many studies who found the negative relationship between exchange rate and exports of Pakistan (Chowdhury, Citation1993; Kemal & Qadir, Citation2005; Irshad, Xin, Shahriar, & Ali, 2018; Irshad, Xin, Shahriar, & Arshad, 2018). The volatility and animations in exchange rate reduces the exports value or can say precariousness in exchange rate reduces exports by reducing profit expectations in case of Pakistan. In case of contiguity dummy variable for common border is found to be positive and significant effect on Pakistani rice exports. Pakistan shares border with China, India, Afghanistan and Iran and China is the largest trading partner of Pakistan since many years and Afghanistan also shares acceptable trade with Pakistan. Our results proved that 1% increase in neighbouring country leads to 2.23% increase in rice export of Pakistan. It is extensively believed that the international trade organization, WTO, increases trading systems and encourages trade Irshad, Xin, Ayaz, and Ali (Citation2016). The dummy variable for WTO has appeared with positive and significant effect on Pakistani rice exports. A 1% increase in WTO member country which leads to 1.4% increases in Pakistani rice export. Trade agreements among nations have become increasingly prevalent since last couple of decades; the world witnessed a surge of trade agreement Irshad, Xin, and Hao (Citation2014). However for Pakistan interestingly, the variable trade agreement is inversely related with rice export of Pakistan. It is because Pakistan generally exports his rice to those countries where he doesn’t have any kind of trade agreement. It is also mean that country having trade agreement with Pakistan have not impact in rice export from Pakistan. Sometime, free trade agreement and trade liberalization policies may also negatively impact home industry of a country. Productive implementation of FTA would lead to reduction or elimination of tariffs that could have negative impact on agricultural sector and rice industry of Pakistan. We have noticed that most of the explanatory variables in line with the gravity model theory and represent positive relationship with the rice exports of Pakistan. (Irshad and Xin, Citation2015a; Irshad & Xin, Citation2016) suggested, In sequence to compete globally, industry of Pakistan needs to have standard quality product, competitive prices, good quality and packaging according international labelling and packing rules, export acts as the motivating power for a fast developing economy and be able to formulate an important player in the world market.
4.3. Trade potential estimations
The coefficients estimated from the gravity model equation (6) are used to calculate the predicted exports of Pakistan, and then these predicted exports are compared to the actual exports to see whether or not rice export potential for Pakistan exist. For the benefit of utilizing less space, we divide the entire time span (2003–2016) into three sub-periodsFootnote1 to calculate the average values of predicted and actual rice export of Pakistan. Here, we only discuss the results of the most recent period 2013–16.
Table provides the rice export potential of Pakistan with the 144 sample countries. The favourable results suggest that Pakistan still has the potential of increasing rice exports with 109 countries. The highest potential lies with countries of India, Iran, Nepal, Korea and Japan whereas actual rice export has exceeded with countries Kenya, UAE, China, Saudi Arabia and Oman. In fact, these results show that Pakistan is currently focusing on rice export with countries of exhausted potentials. China, Kenya, UAE, Afghanistan and Mozambique are a few of the countries with which rice export of Pakistan is the highest, amounting to almost 44% in the year 2016, yet the results reveal that rice export potential with these countries has exhausted. Hence, although the rice exports of Pakistan are flowing towards developed and the countries already exhausted the real trade potential of Pakistan lies with developing countries and comparatively less distance which is highly unrealized.
5. Conclusion and policy implications
The goal of this article was to investigate the competitiveness of Pakistani rice in the world market and export potential with the global world. Rice is an important source for foreign exchange earnings for the economy of Pakistan, keeping in mind of this fact, the competitiveness of Pakistan’s rice with ten major exporters was examined by applying revealed a competitive advantage. The analysis was carried out for 144 importing countries of Pakistani rice in the period 2003–2016 with the use of panel gravity modelling by employing PPML estimator which is proven method for conducting an empirical analysis of international trade. The coefficients estimated from the gravity model were used to calculate the predicted rice export potentials for Pakistan with 144 sample countries.
The results of revealed competitive advantage RCA and RCA# proved that as compared to other major exporters of rice in the world, Pakistan had high competitive and comparative advantage in the exportation of rice the average value of RCA is 66.4% and RCA# 4.27% over the year 2003–2016. The comparison of the movements in comparative advantage indices for Pakistan with the major world rice competitors/exporters demonstrated that Pakistan haunted comparatively high comparative and competitive advantages in rice exportation and production. Pakistan ranked at the top in competitiveness among the major rice exporters. In order to utilize the potential benefits of rice exports, we need to fortify the competitiveness in rice sector of Pakistan. The second objective of this research is to highlight the countries with which rice export potential for Pakistan exists and highlighted the important factors affecting the trade environment of Pakistan by using gravity model. This article was the first empirical attempt to testify whether the gravity model is suitable to explain the trade pattern in case of rice export of Pakistan and to predict trade potentials. To this end, this study mainly investigated the impacts of GDP of Pakistan and trading partner, differences GDP per capita, distance, bilateral exchange rates, contiguity, WTO and trade agreements on rice export from Pakistan. Gravity results proved the H-O theory (factor endowments) when the difference in income has a positive influence on rice exportation of Pakistan. With regards to bilateral exchange rates, we found a negative influence on rice export on Pakistan. In other words, appreciation of Pakistani currency against the trading partners’ currencies will decrease the rice exportation of Pakistan. Our results from gravity estimation show that the coefficients of all the variables used in the model are in line with the theory of gravity model, with the exception of the trade agreement variable, which is no impact of the trade agreement on rice export of Pakistan with countries having a trade agreement with Pakistan.
The results from potential estimations suggest that Pakistan still has the potential of increasing rice exports with 109 countries. The highest potential lies with countries of India, Iran, Nepal, Korea and Japan whereas actual rice export has exceeded with countries Kenya, UAE, China, Saudi Arabia and Oman. In fact, these results show that Pakistan is currently focusing on rice export with countries of exhausted potentials. The rice export potentials of Pakistan are bright as Pakistan still has potentials for improving its earnings and to reduce its chronic trade deficit. While Pakistani producers and exporters were facing the high tax rate, production cost, low infrastructure and electricity shortage. Elevated production cost and lofty prices were the main obstacles to rice export from Pakistan. Electric power outages were creating an increase in the cost of rice production in Pakistan. Compared to regional countries high discount rates including India, Bangladesh and Sri Lanka were another cause of the drop in competitiveness and export. Deficient in Research and Development (R&D) was also one of the chief motives behind the decline in rice exports competitiveness of Pakistan Irshad, Xin, and Arshad (Citation2015). Consequently, there is an imperative demand to consider all the troubles and obstacles encountered to rice export from Pakistan, so as to guard the rice exports from extreme international antagonism, the research instituted should advocate WTO regulations to assist rice exports and supplementary investment should be made in rice research and at the technical training institutes. The focus should be made on investment in better storage amenities, nuisance diminution, and acquiesce development and in the improvement of rice verities which were water effective. Attempts should also be made on marketing activities, so as to utilize the potential profit in the world’s rice market. Our results show that Pakistan had high competitive and comparative advantage in the exportation of rice and Pakistan still has the potential of increasing rice exports with 109 countries so that government of Pakistan must take a step to draw a policy to further improvement in the rice sector of Pakistan.
Taken as a whole, it can be noted that following other factors influencing rice export of Pakistan to world market such as geopolitical concerns, tariffs and pricing, import substitution policy, the authors recommend future research studies with larger data about these factors giving better results are fewer errors. However, from the point of our view, this research, proves useful and has some interesting findings, which can help exporters and policymakers to achieve a better view of rice export of Pakistan to the international market.
Additional information
Funding
Notes on contributors

Muhammad Saqib Irshad
Muhammad Saqib Irshad is a Pakistani national, doing PhD in Tianjin University of Finance and Economics in major International Economics and Trade. His research mainly focused on Pakistan and China’s international trade, One Belt and One Road initiative and China-Pakistan economic corridor. He earned Master degree also from China, Northeast Normal University in major International Trade. He won scholarship for his master and PhD degree from China Government (China Scholarship Council).
Qi Xin
Prof. Qi Xin is the head of department of international education in Tianjin University of Finance and Economics. Her primary research fields include International trade and economics and Intellectual property rights.
Hamza Arshad
Hamza Arshad is a Pakistani national, doing master in Tianjin University of Finance and Economics in major International trade. His research mainly focused on China’s belt & road initiative.
Notes
1. Total time span (2003–16) divided into three sub-groups such as, (2003–07), (2008–2012), (2013–16).
Related Research Data
References
- Abdullah, M., Li, J., Ghazanfar, S., Ahmed, J., Khan, I., & Ishaq, M. N. (2015). Where Pakistan stands among top rice exporting countries, an analysis of competitiveness. Journal of Northeast Agricultural University, 22(2), 80–86. doi:10.1016/S1006-8104(15)30036-2
- Akhtar, W., Sharif, M., & Shah, H. (2009). Competitiveness of Pakistani fruits in the world market. The Lahore Journal of Economics, 14(2), 125–133.
- Anderson, J. E. (1979). Theoretical foundation for the gravity equation. American Economic Review, 69(1), 106–116.
- Anderson, J. E., (2016, August 17). The gravity model of economic interaction. Boston College and NBER. Retrieved from https://www2.bc.edu/james-anderson/GravityModel.pdf
- Anderson, J. E., & Wincoop, E. V. (2003). Gravity with gravitas: A solution to the border puzzle. The American Economic Review, 93(1), 170–192. doi:10.1257/000282803321455214
- Anderson, J. E., & Yotov, Y. V. (2016). Terms of trade and global efficiency effects of free trade agreements, 1990-2002. Journal of International Economics, 98, 279–298. doi:10.1016/j.jinteco.2015.10.006
- Baier, S. L., & Bergstrand, J. H. (2007). Do free trade agreements actually increase members’ international trade? Journal of International Economics, 71, 72–95. doi:10.1016/j.jinteco.2006.02.005
- Balassa, B. (1965). Trade liberalization and revealed comparative advantage. The Manchester School of Economics and Social Studies, 33(2), 92–123. doi:10.1111/j.1467-9957.1965.tb00050.x
- Balassa, B. (1989). Comparative advantage, trade policy and economic development (pp. 25–27). London: Harvester Wheat Sheaf.
- Batra, A., & Khan, Z. (2005). Revealed comparative advantage: An analysis for India and China (pp. 167–168). Indian: Indian Council for Research on International Economic Relations.
- Bender, S., & Li, K. W. (2002). The changing trade and revealed comparative advantages of Asian and Latin American manufacture exports (pp. 841–843). Yale University, Economic Growth Center.
- Bergstrand, J. H. (1989). The generalized gravity equation, monopolistic competition, and the factor-proportions theory in international trade. Review of Economics and Statistics, 71(1), 143–153. doi:10.2307/1928061
- Breusch, T. S., & Pagan, A. R. (1980). The lagrange multiplier test and its applications to model specification in econometrics. Review of Econometric Studies, 47(1), 239–253. doi:10.2307/2297111
- Burger, Burger, M., Van Oort, F., & Linders, G.-J. (2009). On the specification of the gravity model of trade: Zeros, excess zeros and zero-inflated estimation. Spatial Economic Analysis, 4, 167–190. doi:10.1080/17421770902834327
- Byers, D. A., Talan, B. I., & Lesser, B. (2000). New borders and trade flows: A gravity model analysis of the Baltic states. Open Economies Review, 11(1), 73–91. doi:10.1023/A:1008305213791
- Chen, J. (1995). An empirical test of competitiveness among major rice exporting countries (pp. 48–49). Department Of Agriculture Economics, Michigan State University.
- Chen, N. A, & Novy, D. (2011). Gravity, trade integration, and heterogeneity across industries. Journal of International Economics, 85(2), 206–221.
- Chowdhury, A. R. (1993). Does exchange rate volatility depress trade flows? Evidence from error-correction models. Review of Economics and Statistics, 75, 700–706. doi:10.2307/2110025
- Deardorff, A. V. (1998). Determinants of bilateral trade: Does gravity work in a neoclassical world?. In The regionalization of the world economy (pp. 7–32). Chicago, IL: University of Chicago Press.
- Eberhardt, M., & Teal, F. (2010). "Aggregation versus Heterogeneity in cross-country growth empirics," CSAE working paper series 2010-32, Centre for the study of African economies, University of Oxford.
- Ekanayake, E. M., Mukherjee, A., & Veeramacheneni, B. (2010). Trade blocks and the gravity model: A study of economic integration among Asian developing countries. Journal of Economic Integration, 25(4), 627–643. doi:10.11130/jei.2010.25.4.627
- Evenett, S., & Keller, W. (2002, April). On theories explaining the success of the gravity equation. Journal of Political Economy, 110(2), 281–316. doi:10.1086/338746
- Fadeyi, O. A., Bahta, T. Y., Ogundeji, A. A., & Willemse, B. J. (2014). Impacts of the SADC free trade agreement on south african agricultural trade. Outlook on Agriculture, 43(1), 53–59. doi:10.5367/oa.2014.0154
- FAO, (2017). Food and Agriculture Organization of the United Nations database. Accessed on 25 November 2017 (http://www.fao.org/home/en/)
- Gul, N., & Yasin, H. M. (2011). The trade potential of Pakistan: An application of the gravity model. The Lahore Journal of Economics, 16(1), 23–62.
- Guttmann, S., & Richards, A. (2004). Trade openness: An Australian perspective. Discussion Paper No RDP 2004-11, Reserve Bank of Australia.
- Hallak, J. C. (2006). Product quality and the direction of trade. Journal of International Economics, 68, 238–265. doi:10.1016/j.jinteco.2005.04.001
- Helpman, E., Melitz, M., & Rubinstein, Y. (2008). Estimating Trade Flows: Trading Partners and Trading Volumes. The Quarterly Journal of Economics, 123, 441–487. doi:10.1162/qjec.2008.123.2.441
- Hinloopen, J., & Van, M. C. (2001). On the empirical distribution of the Balassa index. Weltwirtschaftliches Archiv, 137(1), 1–35. doi:10.1007/BF02707598
- Hurd, M. (1979). Estimation in truncated samples when there is heteroscedasticity. Journal of Econometrics, 11, 247–258. doi:10.1016/0304-4076(79)90039-3
- Investopedia. (2017). Interesting facts about imports and exports. Retrieved Decmeber 12, 2017 from https://www.investopedia.com/articles/investing/100813/interesting-facts-about-imports-and-exports.asp
- Irshad, M. S., & Xin, Q. (2015a). Pakistan-China free trade agreement (PCFTA) treaty model: Capabilities, prospects and disputes. Academic Research International, 6(3), 53–60.
- Irshad, M. S., & Xin, Q. (2015b). Rising trend in imports and exports of Pakistan’s FTA partners in recent years. Academic Research International, 6(4), 320–331.
- Irshad, M. S., & Xin, Q. (2016). Deltoid analysis of Pakistan-ASEAN-China free trade agreements and opportunities for Pakistan. Asian Economic and Financial Review, 6(5), 228–237. doi:10.18488/journal.aefr/2016.6.5/102.5.228.237
- Irshad, M. S., & Xin, Q. (2017a). Determinants of exports competitiveness: An empirical analysis through revealed comparative advantage of external sector of Pakistan. Asian Economic and Financial Review, 6(3), 623–633. doi:10.18488/journal.aefr.2017.76.623.633
- Irshad, M. S., & Xin, Q. (2017b). The gravity behind South Korea’s international trade: A panel data approach. The Myanmar Journal, 4(2), 76–89.
- Irshad, M. S., Xin, Q., & Arshad, H. (2015). One belt and one road: Does China-Pakistan economic corridor benefit for Pakistan’s economy? Journal of Economics and Sustainable Development, 6(24), 200–207.
- Irshad, M. S., Xin, Q., Ayaz, M., & Ali, F. (2016). The role of charismatic World Trade Organization and the expansion of free international trade. International Journal of Management Science and Business Administration, 2(3), 17–23. doi:10.18775/ijmsba.1849-5664-5419.2014.23.1002
- Irshad, M. S., Xin, Q., & Hao, H. (2014). Boon or Bane: Assessing the environment of China’s free trade agreements with other nations. International Journal of Business and Management Review, 2(5), 1–13.
- Irshad, M. S., Xin, Q., Hao, H., & Arshad, H. (2017). SWOT analysis of Pakistan-China free trade agreement: Pros and Cons. International Journal of Asian Social Science, 7(1), 45–53. doi:10.18488/journal.1
- Irshad, M. S., Xin, Q., Shahriar, S., & Arshad, H. (2018a). A panel data analysis of China’s trade pattern with OPEC members: A gravity model approach. Asian Economic and Financial Review, 8(1), 103–116. doi:10.18488/journal.aefr.2018.81.103.116
- Irshad, M. S., Xin, Q., Shahriar, S., & Ali, F. (2018b). South Korea’s potential export flow: A panel gravity approach. Asian Journal of Empirical Research, 8(4), 124–139.
- ITC, (2017). International Trade Centre, Trade Map database. https://www.trademap.org/Index.aspx
- Kemal, M. A., & Qadir, U. (2005). Real exchange rate, exports and imports movements: A trivarriate analysis. The Pakistan Development Review, 44(2), 177–195.
- Lateef, M., Tong, G., Abdullah, M., Mazhar, N.I, Ahmad, Z., & Usman, M.R. (2017). Finding impact of Pakistan-China free trade agreement (PCFTA) on agricultural exports of Pakistan-gravity model approach, International Journal of u- and e-Service, Science and Technology, 10(8), pp.81–90.
- Laursen, K. (1998). Revealed comparative advantage and the alternatives as measures of international specialization (pp. 98–130). Copenhagen Business School, Department of Industrial Economics and Strategy/ Aalborg University, Department of Business Studies.
- Lee, J.-W., & Swagel, P. (1997). Trade barriers and trade flows across countries and industries. Review of Economics and Statistics, 79, 372–382. doi:10.1162/003465300556968
- Linder, Staffan Burenstam (1961), An Essay on Trade and Transformation, Stockholm: Almqvist and Wiksell.
- Linnemann, H. (1966). An econometric study of international trade flows. Amsterdam: North-Holland Publication.
- Magee, C. S. (2003). Endogenous preferential trade agreements: An empirical analysis. Contributions in Economic Analysis & Policy, 2. doi:10.2202/1538-0645.1166
- Martinez-Zarzoso, I. (2003). Gravity model: An application to trade between regional blocs. Atlantic Economic Journal, 31(2), 174–187. doi:10.1007/BF02319869
- Mohmand, Y. T., Salmaan, A., Mughal, K. S., Imran, M., & Makarevic, N. (2015). Export potentials of Pakistan: Evidence from the gravity model of trade. European Journal of Economic Studies, 14(4), 212–220. doi:10.13187/es.2015.14.212
- Moscone, F., & Tosetti, E. (2009). “GMM estimation of spatial panels,” MPRA Paper 16327, University Library of Munich, Germany.
- Papazoglou, C. (2007). Greece’s potential trade flows: A gravity model approach. International Advances in Economic Research, 13(4), 403–414. doi:10.1007/s11294-007-9107-x
- Pesaran, M. H. (2004). General diagnostic tests for cross section dependence in panels (IZA Discussion Paper No. 1240). Retrieved from http://repec.iza.org/dp1240.pdf
- Porojan, A. (2001). Trade flows and spatial effects: The gravity model revisited. Open Economies Review, 12(3), 265–280. doi:10.1023/A:1011129422190
- Rasoulinezhad, E, & Kang, G. S. (2016). A panel data analysis of South Koreas trade with OPEC member countries: The gravity model approach. Iranian Economic Review, 20(2), 203–224.
- Rasoulinezhad, E. (2017). China’s foreign trade policy with OPEC member countries, Journal of Chinese Economic and Foreign Trade Studies, 10(1), pp. 61–81.
- Silva, J. S., & Tenreyro, S. (2006). The log of gravity. The Review of Economics and Statistics, 88, 641–658. doi:10.1162/rest.88.4.641
- Silva, J. S., & Tenreyro, S. (2011). Further simulation evidence on the performance of the Poisson pseudomaximum likelihood estimator. Economics Letters, 112, 220–222. doi:10.1016/j.econlet.2011.05.008
- Sun, L., & Reed, M. R. (2010). Impacts of free trade agreements on agricultural trade creation and trade diversion. American Journal of Agricultural Economics, 92, 1351–1363. doi:10.1093/ajae/aaq076
- Tang, Y., Zhang, Y., & Findlay, C. (2014). What explains China’s rising trade in services. The Chinese Economy, 46(6), 7–31. doi:10.2753/CES1097-1475460601
- Thorbecke, W. (2015). China–US trade: A global outlier. Journal of Asian Economics, 40, 47–58. doi:10.1016/j.asieco.2015.09.001
- Tinbergen, T. (1962). Shaping the world economy: Suggestions for an international economic policy. New York, NY: The Twentieth Century Fund.
- Trefler, D. (1993). Trade liberalization and the theory of endogenous protection: An econometric study of US import policy. Journal of Political Economy, 101, 138–160. doi:10.1086/261869
- Vollrath, T. L. (1991). A theoretical evaluation of alternative trade intensity measures of revealed comparative advantage. Weltwirtschaftliches Archiv, 127(2), 265–280. doi:10.1007/BF02707986
- Westerlund, J., & Wilhelmsson, F. (2011). Estimating the gravity model without gravity using panel data. Applied Economics, 43(6), 641–649. doi:10.1080/00036840802599784
- Xuegang, C., Zhaoping, Y., & Xuling, L. (2008). Empirical analysis of Xinjiang’s bilateral trade: Gravity model approach. Chinese Geographical Science, 18(1), 9–16. doi:10.1007/s11769-008-0009-5
- Yang, S., & Martinez-Zarzoso, I. (2014). A panel data analysis of trade creation and trade diversion effects: The case of ASEAN–China free trade area. China Economic Review, 29, 138–151. doi:10.1016/j.chieco.2014.04.002
Appendix
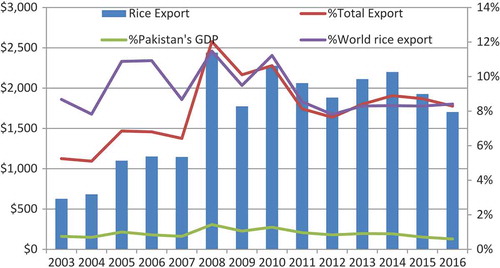
Figure A. Represents Pakistan’s rice exports and percentage share with total exports, GDP and world rice export.
Source: Authors’ compilation based on data UN COMTRADE and FAO, 2018.