
 ?Mathematical formulae have been encoded as MathML and are displayed in this HTML version using MathJax in order to improve their display. Uncheck the box to turn MathJax off. This feature requires Javascript. Click on a formula to zoom.
Abstract
This study investigates a comparative study on the threshold effects of inflation on financial sector development (FSD) between the Economic Community of West African States (ECOWAS) and the Southern Africa Development Community (SADC) for the period 1980–2011. Using a novel panel smooth transition regression, our results suggest evidence of the existence of a robust single threshold of inflation in both regions. Particularly, it indicates 17.9% and 14.5% of inflation for ECOWAS and SADC, respectively, suggesting that inflation above these thresholds presents detrimental effects for financial development in both regions. The study therefore concludes that price stability policies with inflation targeting framework should be the primary objective in monetary policy since high inflation is economically costly to financial development in the two regions.
PUBLIC INTEREST STATEMENT
This paper examines the role inflation plays in financial sector development in two economic communities of Sub-Saharan Africa: Economic Community of West African States (ECOWAS) and Southern Africa Development Community (SADC). The main objective is to determine comparatively what level of inflation is detrimental or good for financial sector development in the two economic communities. High inflation is considered detrimental to financial sector development whiles low inflation is seen as good. The question is, how high or low should the inflation rate be? The results indicate inflation thresholds of 17.9% for ECOWAS and 14.5% for SADC, respectively. It suggests that inflation above these values presents detrimental effects for financial sector development in both regions. The study therefore concludes that price stability policies should target inflation below these thresholds for the respective regions.
1. Introduction
The basic aim of financial sector policies is to induce growth and stability in the sector, as finance is an important potential channel in determining economic growth. This is a grave concern in Sub-Saharan Africa (SSA). Following the economic and financial sector reforms of the 1980s aimed to promote financial sector development (FSD), most countries in SSA demolished their post-independent repressive economic and financial sector regimes. The reforms resulted in the dismantling of credit controls, privatization of state-owned banks and liberalization of interest rate. To spur growth in the financial sector, policies mostly aimed at inducing competition, promoting efficiency and subsequent expansion of the sector were pursued. However, despite the measures taken during the reforms and after, the financial sector of SSA remains relatively thin and underdeveloped, with the exception of South Africa. From this perspective, we argue that, though the reform policies are essential, they need to be supported by stable macroeconomic conditions to induce commendable growth in the financial sector. An investigation, in particular, on the optimal level of inflation (price stability) essential for fostering financial sector development is thus needful.
Studies by Huybens and Smith (Citation1998) and Huybens and Smith (Citation1999) indicate that inflation has a detrimental effect on the ability of the financial sector to operate efficiently since it interferes with the development process of the sector. The above studies posit that increases in the rate of inflation erode returns on investment, which adversely affects credit market friction. This further impacts FSD negatively and, hence, long-run real activity. Studies by Boyd, Levine, and Smith (Citation2001), Ben-Naceur and Ghazouani (Citation2005), Detragiache, Gupta, and Tressel (Citation2006), Kablan (Citation2010), and many others provide empirical evidence in support of this theory.
However, other studies argue that there is existence of threshold effects of inflation on FSD, as in Azariadis and Smith (Citation1996) and Choi, Smith, and Boyd (Citation1996). These studies propose that some level of inflation is desirable for FSD up to certain threshold level. Beyond this threshold level, the detrimental effect of inflation on the FSD will be witnessed. Hence, it is important, especially for policymakers to understand the dynamic relationship between inflation and FSD in order to make sound and achievable policies that will speed up development in the sector. Consequently, exploring further the link between inflation and financial development in terms of the threshold effects is vital. As a precondition, policymakers should aim at low rates of inflation so as to avoid the detrimental effect of inflation in the process of financial development. The question then is: What is the optimal level of inflation rate that is required for FSD?
Our main objective is to determine the optimal (threshold) level of inflation suitable for FSD. We do this by considering a comparative study between ECOWAS and SADC. A comparative study is important for two reasons. Firstly, regional blocs are considered as the pillars of African economic community and are an increasingly dominant feature today.Footnote1 For this reason, the study reveals the peculiarities in each regional bloc and the extent to which inflation, as a macroeconomic policy variable, is beneficial for FSD in each bloc. The results provide guidelines for policy recommendations. Secondly, it is particularly insightful to separate and compare regional groups in SSA, since member states in each bloc pursue similar policy goals towards meeting some convergence criteriaFootnote2 set by the blocs. ECOWAS and SADC blocs were chosen for this study because they are one of the oldest trade blocs and make up almost two-thirds of SSA and most of the countries have reliable data to achieve our key objective.
Existing empirical studies on threshold effects of inflation on FSD are relatively uncommon, especially on SSA. One of such studies, Boyd et al. (Citation2001), determined the optimal level of inflation suitable for financial development for a combination of developed and developing countries. Even though the study deepens our understanding on the behaviour of inflation on finance, it had the following weaknesses. The study imposed an a prior threshold of inflation instead of endogenously estimating it. In addition, no formal test is done to establish the existence of non-linear relationships between inflation and finance. Other studies by Rousseau and Watchtel (Citation2002), Rousseau and Yilmazkuday (Citation2009), and Jude (Citation2010) did not examine the threshold of inflation directly on FSD but merely suggested an indirect effect of inflation on finance–economic growth relationship. Furthermore, they used only a single measure of financial development instead of a composite measure that broadly captures the basic functions of the financial sector. Finally, the data used in these cited studies are usually made up of both developed and developing economies and therefore the findings are generalised and may be unreliable for a purely African context.
Based on the identified gaps, we make three main contributions to the literature. Firstly, the study used a composite measure of FSD constructed using three measures of financial development indicators. Secondly, unlike some existing studies, we estimated the inflation threshold endogenously and also tested for remaining non-linearities using more robust and efficient Panel Smooth Transition Regression (PSTR) developed by González, Teräsvirta and Dijk (Citation2005) to capture the threshold level. The PSTR approach has an advantage of estimating the threshold value rather than imposing it exogenously. In addition, it allows for speed of transition from one regime to another depending on the threshold variable. The studies found are based on non-linear models that are inadequate to model non-linearities appropriately. In some cases, the threshold value was imposed and no formal test to establish the existence of such non-linearity was conducted (see Boyd et al. (Citation2001), Khan, Senhadji, and Smith (Citation2001), Aziakpono (Citation2004), Rousseau and Yilmazkuday (Citation2009), and Abbey (Citation2013)). To the best of our knowledge, the application of PSTR in a purely inflation–FSD relationship has yet to be examined. We note, however, that there are several applications in the inflation–growth nexus (see Thanh, Citation2015; Seleteng, Bittencourt, & van Eyden, Citation2013; Omay and Oznur, Citation2010; Ibarra & Trupkin, Citation2011). Lastly, the study is conducted on the direct effects of inflation threshold on FSD in the context of ECOWAS and SADC regional blocs in SSA.
Our results indicate a single threshold of 17.9% and 14.5% of inflation for ECOWAS and SADC, respectively. We also find statistically significant negative effects of inflation on FSD for inflation rates above the thresholds. These results suggest that countries in ECOWAS and SADC regions can prevent inflation from interfering with the efficient operation of the financial system in the two regions if only they can obtain and maintain inflation rates below their respective inflation thresholds.
A review of relevant literature follows in Section 2. In Section 3, we describe the methods and specify the theoretical and empirical models used. This includes a description of PSTR model, the transition functions, and the relevant test of non-linearities. The applicable data are presented in Section 4 with initial descriptive analysis. The analysis and discussion of results are found in Section 5 and Section 6 is the conclusion of the paper.
2. Literature review
2.1. Theory
The known theories on the threshold effect of inflation on financial development propose that a negative relationship between financial development and inflation is only noticed when inflation rate exceeds certain threshold, thereby suggesting a nonlinearity between finance and inflation (Azariadis & Smith, Citation1996). The models developed by Azariadis and Smith (Citation1996) and Choi et al. (Citation1996) argue that when inflation is suitably low, credit market frictions may be “nonbinding” which renders inflation incapable of distorting the flow of information in the financial market. With this, the effect of an increase in inflation is powerless in impeding the financial sector ability to allocate resources efficiently. The models explain that under this low inflation condition, coupled with sufficiently high real rates of returns on savings, adverse selection in the credit markets is not binding. This implies that credit rationing is not required to induce lenders to lend rather than borrow. This thus suggests that increases in inflation induce agents to substitute cash for investment in physical or human capital or both, which will stimulate long-run growth.
Moreover, the theories posit that when inflation increases excessively, real rates of returns on assets will be pushed down, resulting in credit market frictions becoming binding. If increases in inflation exceed the threshold level or critical value, subsequent increases in inflation will cause credit rationing to intensify. This is capable of distorting information flow and harms the efficient workings of the financial system. The transmission mechanism implies that lower rates of returns caused by increases in inflation will induce severity of adverse selection, which will necessitate widespread credit rationing in the economy. Hence, this effect results in reduction in financial system expansion. Thus, an important conclusion of these models is that threshold effects exist between inflation and financial development.
The theories further predict a second threshold effect of inflation on financial development. The contention is that if inflation exceeds the critical value, perfect foresight dynamics are related with endogenous oscillations in all variables, causing inflation to be highly correlated with inflation variability and assets return volatility.Footnote3 In addition, other models confirm a third threshold effect.Footnote4 When inflation reaches this critical value all the harm to the financial system development has already been done and further increases in inflation have no extra impact on FSD or growth.
2.2. Empirical studies
On the empirical literature relating inflation to financial development, contemporary empirical studies have mostly recorded a significant negative relationship. These studies include Haslag and Koo (Citation1999), BenNaceur and Ghazouani (Citation2005), Detragiache et al. (Citation2006), Zoli (Citation2007) and Kablan (Citation2010) among others. Studies on SSA include Aziakpono (Citation2004) on Southern Africa Custom Union (SACU), McDonald and Schumacher (Citation2007) and Andrianaivo and Yartey (Citation2010). All these studies documented evidence that increases in inflation reverse FSD.
2.2.1. Threshold analysis of inflation effect on FSD
Empirical literature on threshold effects of inflation has largely been devoted to explaining inflation–growth nexus and finance–growth nexus (see Schiavo and Vaona (Citation2007), Omay and Oznur Kan (Citation2010), Mignon and Villavicencio (Citation2011), Ibarra and Trupkin (Citation2011), Seleteng et al. (Citation2013), and Thanh (Citation2015)). These studies argue that the debilitating effects of inflation on economic growth are only observed after certain threshold levels.
Relatively few studies are directed to the determination of the direct effect of inflation on financial development relationship. On the nascent empirical literature directed at finding the threshold effects of inflation on finance–growth nexus, studies are usually a broad mixture of both developing and developed economies. These studies attempt to estimate the threshold value of inflation suitable for the financial sector to induce economic growth. Rousseau and Wachtel (Citation2002) used five-year averages of measures of financial development (M3 and M3 less M1 and total credit to GDP), inflation, and economic growth rates of 84 countries for the period 1960 to 1995. The study concluded that there is an inflation threshold for the finance–growth relationship that lies between 13% and 25%. This implies that, above these thresholds, the financial sector is powerless in inducing economic growth in these countries. Lee and Wong (Citation2005) obtained single threshold value of 7.25% in Taiwan and double thresholds of 2.5% and 9.66% in Japan. The study however employed a threshold autoregression (TAR) model.
Furthermore, Rousseau and Yilmazkuday (Citation2009) posit that higher levels of financial development, combined with low-inflation, are related to higher rates of economic growth, especially in lower income countries. However, financial development looses much of its explanatory power in the presence of high inflation. They found double threshold of inflation between 4% and 19%. Jude (Citation2010) used PSTR for a panel of 71 countries that include both developed and developing countries for the period 1960–2004 and found double threshold of inflation at 9.5% and 24% for finance–growth relationship beyond which the finance-growth coefficients are negatives. These findings are in line with the existing theory. The implication is that when inflation rates are high, financial intermediation becomes more difficult, since this high inflation exacerbates information asymmetry and, consequently, renders the FSD powerless to induce economic growth, if not retard it. Also, in line with the studies of Rousseau and Yilmazkuday (Citation2009) and Jude (Citation2010), Huang, Lin, Kim, and Yeh (Citation2010) applied Caner and Hansen (Citation2004) instrumental-variable threshold regression approachFootnote5 and found 7.3% and 7.7%, respectively, for policy variables alone and for full sample. The study used private credit as a measure of FSD and followed Rousseau and Wachtel (Citation2002) in using the period-averaged inflation as a candidate threshold variable.
Even though the above empirical studies develop our understanding on the threshold effects of inflation on financial development, these studies focused mainly on specific threshold value beyond which financial sector loses its growth-inducing power on economic growth. They however failed to inform us about the asymmetric effects of inflation directly on FSD.
Relatively few studies directly estimate the threshold effects of inflation on financial (sector) development and none appears in the context of SSA. The available studies attempted to determine at what threshold level does increase in inflation reverse FSD. Among the few known studies is the work of Boyd et al. (Citation2001). This study obtained a double-digit inflation threshold of 15% for FSD for a number of developing and developed countries. The study indicates that the relationship between finance and inflation is nonlinear for the 97 countries in their sample for the period 1960–1995. However, as indicated, the main weakness of the study is the imposition of threshold by a prior and also lack of test of existence of nonlinearity. This study presented results on three different measures of FSD, which include liquid liabilities, bank assets and private credit. Khan et al. (Citation2001) also used a sample of large cross-country of 168 developed and developing economies and found evidence of the existence of threshold of inflation between 3% and 6% a year. The findings depend on the specific measure of financial depth used. The measures are domestic credit to the private sector, summation of domestic credit and stock market capitalization and summation of the second indicator with private and public sector bonds market capitalization.Footnote6 Generalization of the threshold value for both developed and developing economies may be misleading since there are significant differences between these groups of countries.
Finally, Abbey (Citation2013) presents results on a single country and found inflation threshold rates between 11% and 16% per annum for inflation–finance relationship in Ghana. The study used the cointegration approach and the Granger causality testing procedure coupled with Conditional Least Squares technique to address the relationship between inflation and FSD. The study thus recommended price stability for inflation rates between 11%and 16% in support of financial development in Ghana. The study relied on the ratio of private sector credit to GDP and the market capitalization ratio separately as measures of FSD.
From the empirical literature reviews, we can highlight the following gaps: (i) that to the best of our knowledge, there is no study on the threshold effects of inflation on FSD in the context of comparing the two regional blocs of ECOWAS and SADC in SSA; (ii) that studies that attempted to examine the threshold effect of inflation directly on FSD exogenously imposed the threshold value a priori, which can be either too low or too high; and (iii) that all the studies reviewed used single measures of FSD, which are unlikely to capture broadly the FSD. Therefore, we make our contributions to the economics research literature by examining and comparing the threshold effects of inflation on FSD in the context of ECOWAS and SADC trade blocs in SSA. We create a composite measure of FSD and apply the PSTR that has the advantage of endogenously determining the threshold value.
3. Method and model specification
3.1. Specification of the panel smooth transition model
To capture the threshold effect of inflation on FSD, we follow the approach of González et al. (Citation2005) by specifying the PSTR model. The advantage of this model is that it can estimate the threshold parameter endogenously. This approach allows the relationship between inflation and finance to depend on the level of the threshold variable. The PSTR is a fixed-effect model with exogenous regressors and caters for heterogeneity problem in the model. According to González et al. (Citation2005), the model permits parameter heterogeneity by assuming that the regression coefficients are continuous function of an observable variable through a bounded function of this variable, called transition function, and fluctuates between regimes.
The PSTR has some advantages over other earlier approaches such as the panel threshold regression (PTR) of Hansen (Citation1999) that also estimates threshold effects. According to Hansen (Citation1999), the PTR model divides the observations into two or more regimes and these regimes are separated by different regression slopes. PTR approach requires that different groups of observations can clearly be distinguished from each other based on the value of the threshold variable with sharp or discontinuous “borders” or thresholds separating each group. In practice, this is more restrictive and may not always be feasible. Hence, an advantage of PSTR is a generalization of the PTR model and relaxes its restrictions. In particular, PSTR allows the regression coefficients to change gradually when moving from one group to another. This permits smooth transition from one regime to another, which is not possible in Hansen’s (Citation1999) PTR. A simple two-regime PSTR model with a single transition function is specified in EquationEquation (1)(1)
(1) but can be generalized to allow for more than two different transition functions as in EquationEquation (2)
(2)
(2) :
where i is individual country at time t and i = 1 … … … N; t = 1 … … … . T. is the error term. The variable
is a
-dimensional vector of regressors. We modelled inflation and FSD relationship using inflation rate (inflation), ratio of government expenditure to GDP (gov), financial openness (finop), trade openness (traop) and real GDP per capita (rgdppc) defined by
following studies by Boyd et al. (Citation2001) and Baltagi, Demetriades, and Siong (Citation2009). We extend the model to include communication infrastructure, which is the number of mobile and telephone lines per thousand people. This variable is expected to affect financial development positively as more access to communication infrastructure may lead to more access to information about the services and products of the financial system and, hence, lead to demand of such services and products. An important issue namely endogeneity problem that may lead to biased coefficients is addressed considering lags of the variables as in Baltagi et al. (Citation2009) and Jude (Citation2010). Also, the time series properties of the variables used were considered since in PSTR model the variables should be stationary. This was done using Levin et al. (Citation2002) and Im et al. (Citation2003) approaches and the results are reported in Table .
Table 1. Descriptive statistics
Table 2. Panel unit root tests
The is fixed country effects and
is the threshold variable which is the rate of inflation. The threshold parameter is
and j = 1 … r. γ is the slope parameter and denotes the smoothness of the transition from one regime to the other. The transition function is
which is a continuous function of the observable variable
. It is normalized to be bounded between 0 and 1, and these extreme values are associated with
and
In general, the value of
determines the value of
More precisely, the coefficient of inflation is equal to
if it is smaller than
and
if it is larger than
. In this study, the coefficient
can be positive or negative. If it is positive, it can be statistically significant or may be insignificant. If
< 0, we expect it to be statistically insignificant.
is expected to be negative and statistically significant.
The dependant variable is a scalar and an indicator of FSD (findex), which is a composite measure constructed using the following Equationequation (3)
(3)
(3) .
For and
are FSD indicators and sample mean of
respectively,
is the number of FSD indicators. EquationEquation (3)
(3)
(3) is instrumental because the measures of FSD face definitional problems. As one of the contribution of this study, a composite index is constructed to provide a broader measure of FSD. According to Levine (Citation1997), FSD is improvement in the quality of five key functions of the financial system. These functions are (i) producing information on investment and allocating capital, (ii) monitoring and exerting corporate governance, (iii) facilitating trading and management of risk, (iv) mobilizing and pooling of risk and (v) easing exchange of goods and services. Therefore, a measure of FSD should reflect at least the different functions of the financial system. Accordingly, Aziakpono (Citation2004) suggests that if the functional definition is accepted, then a single indicator cannot adequately measure FSD.
With this assessment, EquationEquation (3)(3)
(3) is estimated following Demirgüç-Kunt and Levine (Citation1996) and Allen and Ndikumana (Citation2000). We include three indicators commonly used in the literature (see Allen & Ndikumana, Citation2000; Aziakpono, Citation2004; Levine, Loayza, & Beck, Citation2000). These measures are bank private credit to GDP, liquid liabilities (M3 to GDP) and the ratio of domestic bank assets to the sum of domestic bank assets and central bank assets.
The transition function follows a logistic or exponential function. Thus, following the work of Granger and Terasvirta (Citation1993) for time series smooth transition autoregressive (STAR) models, González et al. (Citation2005) consider the following logistic specification function:
Where =
is a vector of m-dimensional location parameters and the restrictions
are imposed for identification purposes. According to Gonzalez et al. (Citation2005), it is usually sufficient in practice to consider m = 1 or m =2 as these values allow for commonly encountered types of variation in the parameters. If m = 1, the model implies two regimes with low and high values of
.
In general, if the transition variable is different from inflation, the sensitivity of FSD to inflation for the ith country at time t is defined as follows from EquationEquation (1)
(1)
(1) :
By definition of the transition function
, if
or
if
, since 0
.
Another advantage of the PSTR model is that the inflation-FSD coefficient may be different from estimated parameters of the extreme regions, i.e., . As demonstrated by EquationEquation 5
(5)
(5) , these parameters do not directly correspond to the direct impact of inflation on finance. Parameter
refers to the direct effects of inflation on FSD if the transition function
tends towards 0. On the contrary, the sum of
equals inflation-FSD coefficient only if the transition function
tends to 1. In between these two extremes, there are infinite number of inflation-FSD coefficients which are weighted average of the parameters
It is therefore important to observe that in the PSTR model, it is generally difficult to interpret directly the values of these parameters as in logit and probit models. It is generally preferable to interpret the signs of the coefficients as either an increase or decrease depending on the value of the transition variable. Therefore, a negative (or positive) sign of the parameter
means that an increase in the transition variable involves a decrease (or increase) of the inflation-FSD coefficient (Gonzalez et al., Citation2005).
3.2. Tests for linearity and number of transition functions
Following the procedure described by González et al. (Citation2005), we test linearity against the PSTR model and determine the number of r transition functions. This is important since PSTR is not identified if the data-generating process is linear. We follow Colletaz and Hurlin (Citation2006) and use the Wald, Fischer and Likelihood tests. Once the PSTR model is established, the next stage is to identify the number of transition functions. A sequential methodological test is used. For linearity test, the null hypothesis is: = 0 or
= 0. However, in these cases, the test is non-standard since the PSTR contains unidentified nuisance parameters under the null hypothesis and a possible answer is to replace the transition function
by its first-order Taylor expansion around
= 0 in EquationEquation (1)
(1)
(1) which leads to the following reparameterized auxiliary regression in EquationEquation (6)
(6)
(6) :
… .
are multiples of
,
is
+
and
is the remainder of the Taylor expansion. Hence, in this way testing the null hypothesis
= 0 in EquationEquation (1)
(1)
(1) is equivalent to testing
… .
= 0 in EquationEquation (6)
(6)
(6) .
A similar approach is adopted to test the number of transition functions in the model if linearity test is rejected. Hence, we test the null of no remaining non-linearity in the transition function. Suppose we want to test whether there is one transition function ( against at least two transition functions (
, then we have:
The null hypothesis of no remaining heterogeneity can be formulated around = 0 in EquationEquation (7)
(7)
(7) . Again this testing problem is complicated by the presence of nuisance parameter under the null hypothesis and this is avoided by replacing the transition function
by Taylor expansion around
= 0 in EquationEquation (7)
(7)
(7) leading to the auxiliary regression below:
Where are estimates under the null hypothesis. The testing of null hypothesis of no remaining non-linearity is defined as
= … =
in EquationEquation (8)
(8)
(8) . In summary, the testing procedure is as follows: Given PSTR model we test the null hypothesis that the model is linear. We proceed to two-regime PSTR if the null is rejected. With two-regime PSTR model, we test the null of no remaining non-linearity in the model and if it is rejected, we move to test three-regime model. The testing continues until we cannot reject the null of no remaining non-linearity. To avoid excessive large models, at each step in the sequential procedure, the significance level must be reduced by a constant factor
and we consider
= 0.5 following González et al. (Citation2005).
4. Description of data
We used annual data obtained from the World Bank’s Africa Development Indicators and Global Financial Development Database for the periods 1980–2011. The choice of the time period is due to the paucity of data of a section of the variables on the countries in the sample. Financial variables are obtained from the latter and the rest of the data from the former. Financial variables are stock variables whereas GDP measures are flow. Most studies ignored this problem. Global Financial Development Database solves this flow-stock problem by deflating these variables with the relevant consumer price indices.Footnote7 This gives rich and better measures of these indicators. The study used the “de jure” financial liberalization index obtained from Chinn and Ito Index. This is an index of capital accounts openness. It is constructed from four binary dummy variables that codify restrictions on cross-border financial flows. Even though this index sometimes overstates the measure of openness, the data is broadly available for most SSA countries. More so long period data on SSA countries are not readily available from alternative sources for a long period (see Table in the appendix for details of the data used).
As recommended by Hansen (Citation1999), the study used balanced panel. Data are available for only 12 countries in each bloc.Footnote8 However, PSTR is sensitive to extreme observations. As Zimbabwe, the Democratic Republic of Congo (DRC) and Ghana all experienced high inflationary periods, we excluded these countries from the calculation in order to avoid extreme observations, which can potentially distort the regression results.
The data indicates that Ghana has experienced high inflation rates, ranging from double to three digits, throughout the sample period 1980–2011. Year 2011 is the exception with mean of 30.1 and maximum of 122.9. These figures are conspicuously larger than the mean and maximum (8.9 and 80.8, respectively) for the 11 countries in ECOWAS as shown in Table . For the mean of DRC and Zimbabwe, the data indicate 1102.5 and 374.4, respectively. This greatly contrasts with the mean of the 10 other countries (17.93) in SADC. The maximum is 183.3 (see Table ) against the maximum of 23,773.1 for the 12 countries. These countries thus have significant influence, which is why they serve as outliers. As PSTR is sensitive to their inclusion, we report the results of the sample without these countries as our main results. However, Table in Appendix A provides results that indicate the effects of the outliers on the threshold values in each region. The descriptive statistics of the data used for the 11 countries in ECOWAS and the 10 countries in SADC is presented in Table .
Table provides summary statistics of the variables used in the study without Ghana, DRC and Zimbabwe. The mean inflation of ECOWAS is 8.9% and that of SADC is 17.9% for the period 1980–2011. The standard deviation suggests that the dispersion from the mean in ECOWAS is relatively smaller than that of SADC. The individual country averages are also shown below the Table indicating that on average DRC and Guinea Bissau has the highest inflation rate in SADC and ECOWAS, respectively. The other conditioning variables indicate that on average SADC performs relatively better than ECOWAS.
ECOWAS: Benin = 4.3, Burkina Faso = 4.0, Cape Verdi = 5.2, Cote d’voire = 5.1, Gambia = 9.5, Ghana = 30.1 (max =122.9), Guinea Bissau = 32.2 (max =80.8), Mali = 4.1, Niger = 3.4, Nigeria = 20.7, Senegal = 4.3, Togo = 4.9
SADC: Botswana = 10.0, DRC =1102.5, Lesotho = 10.5, Madagascar = 15.1, Malawi = 19.6, Mauritius = 8.02, Mozambique = 28.7, South Africa = 9.7, Swaziland = 10.5, Tanzania = 19.0, Zambia = 48.1 and Zimbabwe = 374.4
5. Analysis and discussion of results
5.1. Time series properties of data
The time series properties of the variables were determined as indicated in Table . The PSTR was therefore modelled based on these results presented in Table .
5.2. Test of linearity against non-linearity
To determine whether there is non-linearity between FSD and inflation in the 11 and 10 countries in ECOWAS and SADC, respectively, Table reports the linearity test. It supports the rejection of the null hypothesis that the model is linear for all the three tests at 1% significance level in both regions, indicating that the relationship between FSD and inflation is indeed nonlinear.
Table 3. Test of linearity against non-linearity for ECOWAS and SADC
5.3. Testing the number of regimes
In line with the procedure outlined by González et al. (Citation2005), we proceeded to test whether there is existence of remaining non-linearity after assuming two regimes model and the test results are reported in Table . The null hypothesis which states that the PSTR is adequately modelled by only one threshold cannot be rejected in the two regional blocs, implying that we have one threshold or two regimes that separate low and high inflation regimes, as indicated by the probability values of the various tests.
Table 4. Testing the number of regimes: Tests of no remaining non-linearity
5.4. PSTR model estimation results
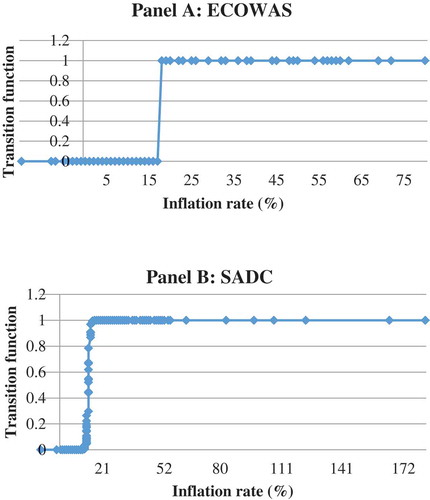
We report the estimated PSTR model parameters in Table . The results suggest evidence of a single threshold of inflation in both regions. The endogenously estimated threshold values reveal a relatively lower figure for SADC. Particularly, the threshold level of inflation above which inflation significantly slows down development in the financial sector is estimated at 17.9% for ECOWAS and 14.4% for SADC. The estimated thresholds show the inflationary rates at which the transition function reaches an inflexion point beyond which inflation will be detrimental to FSD. Hence, the significance of the results is that below 17.9% and 14.4% of inflationary rate, inflation may or may not influence the financial sector’s ability to expand and also to allocate resources efficiently in ECOWAS and SADC.Footnote9
Table 5. Estimated PSTR model
As expected, the inflation-FSD coefficient is not only negative in both regions beyond the threshold but statistically significant at 1% level, which is in line with the existing theory (Table ). This suggests that increases inflation above these thresholds present significant detrimental effects for FSD in both regions. Given one transition function, only the estimated signs of the coefficients can be interpreted, implying that beyond the estimated threshold when inflation increases, the link between FSD and inflation becomes more negative. Thus, above these thresholds, inflation may impair efficient information flow in the financial system and erode returns on assets. This is expected to interfere with the expansion of the financial sectors of the two regions. By implication, macroeconomic stability policies in the two regions should aim at rates below these thresholds since high inflation is economically costly for FSD.
Furthermore, the inflation-FSD coefficient at the lower regime or below the threshold () is positive but statistically insignificant in ECOWAS. This means increases in inflation below the threshold does not interfere with financial sector activities in that region, which is also in line with theory. In contrast, the inflation-FSD coefficient in SADC is positive and also statistically significant at 1% level. The implication of this result is that increases in inflation below the threshold support FSD and the link between inflation and FSD becomes more positive. This outcome is in line with English’s (Citation1999) argument that increases in inflation rate encourage households to substitute purchased transaction services for money balances and thereby induce FSD.
The difference in the results between the two regions may be explained by the influence of South Africa in the SADC region. Monetary policy of this country, which includes inflation targeting framework, affects countries such as Lesotho, Swaziland, Namibia and Botswana. Moreover, the financial sector of South Africa, especially, the banking industry has footprints all over the region, which may implement financial policies of South Africa in their destination. The results have certainly considerable meaning for the conduct of monetary policy. The study, therefore, argues that price stability policies with inflation targeting framework should be the primary objective in monetary policy since high inflation is economically costly to FSD of the two regions.
The findings that increases in inflation reverse FSD are in line with some existing studies on the effects of inflation on FSD including Aziakpono (Citation2004) on South Africa, Botswana, Namibia, Swaziland and Lesotho (SACU countries), McDonald and Schumacher (Citation2007), Andrianaivo and Yartey (Citation2010), Kablan (Citation2010) on SSA.
5.5. Estimated slope parameters
Figure shows the plot of the estimated transition function against inflation. The estimate of the slope for ECOWAS is such that the transition from lower regime inflation to higher regime is very rapid. The estimated slope is 443.9, which is relatively large as shown in Table . In contrast, the transition from lower regime to higher regime inflation is relatively smooth in SADC. The slope parameter for SADC is low (2.28), revealing that the change in the effect of inflation on finance is relatively smooth from a low inflation regime to a high inflation regime than ECOWAS. This means that the regression coefficients change gradually when transitioning from low regime to high regime inflation. The Panel A for ECOWAS indicates that the majority of the observations lie in either of one of the extreme regimes. In contrast, even though the majority of the observations lie in both regimes in SADC, some lie in-between these two extreme regimes as shown in Panel B.
Figure 1. Estimated transition function of ECOWAS and SADC
6. Control variables
The other variables in the model reported in the results in Table appear to be consistent with theory and expectations. At a low inflation regime, government expenditure (gov) is positive in both regions, but only statistically significant in ECOWAS (that is, at 1% statistically significant level). This suggests that increases in inflation result in increases in finance-government expenditure coefficient. This is intuitive because at lower inflation rate, increases in government consumption may serve as attractive avenue for the financial sector of the region to manage their liquidity. However, expectedly, beyond the threshold, increases in inflation in both regions will result in statistically significant negative coefficient of government expenditure. This implies that government expenditure affects FSD negatively at high inflation rate regime in both regions.
The implication of negative coefficient at high inflation regime in both regions is that it leads to reduction in FSD. This means that beyond the inflation threshold levels of these regions, there is a tendency that high-level government expenditure may result in diversion of productive resources from the financial sector, hence impeding FSD. Moreover, this may also indicate that increases in government spending at high inflation regime further fuel the high inflation, leading to erosion of real returns on assets.
The coefficients of the level of economic development measured by real GDP per capita are positive at both low and high inflation regimes in the two regions at 1% significant level with the exception of ECOWAS, where it is statistically significant at 10% level at high inflation regime. Intuitively, low inflation rate could be an incentive for the demand of financial products since returns on asset may be attractive. Therefore, increases in the threshold variable in the low inflation regime may still cause increases in demand for financial services by the real sector thus leading to FSD. This is because the increases in inflation may not be enough to erode returns on assets completely. In the high inflation regime, the expectation is that the coefficient should be negative to indicate that increases in inflation decrease real sector coefficient. However, the results indicate positive coefficient, thus revealing that increases in inflation result in increases in the coefficient of real GDP per capita. This means that, in both regions, there is demand for financial services as inflation increases at the high regime. Intuitively, this may mean that agents do not care much about the effects of inflation on returns to assets in the two regions. Furthermore, most Central Banks and Monetary Policy Committee of member states usually adjust interest rates in response to increases in inflation in order to maintain returns on asset and this could be another possible reason. However, this is a costly approach since high interest rates may lead to reduction in borrowing by the private sector.
Furthermore, both coefficients of trade and financial openness are positive at 1% significance level at high inflation regime in SADC. However, only trade openness is statistically significant at 5% in low inflation in the same region. This implies that in both low and high inflation regimes in SADC, more trade openness alone is related to FSD, but this is only true at high inflation regime with more financial openness. Since these are structural policy variables, more trade and financial openness separately may lead to inflows of capital that will induce FSD. This may suggest that at high inflation rate above the threshold, Rajan and Zingales’s (Citation2003) hypothesis that require simultaneous opening of both trade and financial sector may not be supported. Quite the contrary, this study shows that both trade and financial openness coefficient are statistically insignificant at low regime inflation and only the former is statistically significant at high inflation regime in ECOWAS at 1% statistically significant level.
Finally, access to communication infrastructure in both regions indicates statistically significant positive coefficient at low inflation regime at 1% and statistically significant negative coefficient at the high inflation regime at 1% significance level in SADC and 5% in ECOWAS. What this means is that low inflation regime is good for access to communication infrastructure to exert positive effect on FSD and the reverse is true at the high inflation regime. Intuitively, low inflation rate may make it less costly for access of information from the financial sector through communication infrastructure. However, at high inflation this may seem costly, resulting in negative coefficient of access communication on FSD.
6.1. Sensitivity analysis and robustness checks
In addition to the baseline regressors in EquationEquation 1(1)
(1) , we added gross domestic saving (% of GDP) as robustness checks and the results are reported in Table in Appendix B. This variable is shown to cause FSD as in Odhiambo (Citation2008). As indicated, our findings of nonlinearity are again supported by the linearity test which confirmed a single threshold in both regions as shown by Tables and B. The threshold values are similar to those obtained in the baseline equation, indicating 17.87% and 14.40% for ECOWAS and SADC, respectively. These findings are in contradiction to the argument of Omay and Oznur (Citation2010) who contend that the threshold value is decreasing significantly as new explanatory variables are added but in line with the study of Khan and Senhadji (Citation2001). The results in both regions indicate that, statistically, there is a significant negative coefficient of inflation above the threshold, revealing that high inflation is costly to FSD. The slope parameters again indicate relatively smooth transition from low regime to high regime for SADC (
=2.3), but rapid transition in ECOWAS (
=429.9), as indicated by the transition graphs of Figure in the Appendix B. Furthermore, we replaced domestic saving with exchange rate which is another important conditioning variable. The results suggest no significant difference with the baseline equation.Footnote10
On the control variables, the estimated coefficients are largely consistent with existing theory. It reveals that government spending is positive at lower inflation regime in both regions but only statistically significant in ECOWAS, indicating that increases in this policy variable raise FSD. However, it is significantly negative at higher inflation in both regions. This reveals its detrimental effect on finance at high inflation regime. The coefficient of the measure of economic development is both positive at low and high regime inflation showing that demand for financial services increases in both regimes in the two regions
Moreover, trade and financial openness are both positive at high regime in SADC with only the former indicating statistically significant positive coefficient in ECOWAS. Finally, access to communication infrastructure indicated statistically significant positive and negative coefficients in low and high regimes, respectively, for the two regions.
7. Conclusion and policy
FSD is an important potential channel for economic growth. Hence, several efforts are being made in sub-Saharan Africa to raise growth in the sector. One of the important policy variables that retard FSD is persistent inflation. Existing theories contend that the detrimental effect of inflation on FSD is only observed after certain inflationary level and thus threshold effects exist between inflation and FSD. In this study, we provided a comparative study between ECOWAS and SADC on the threshold effects of inflation on FSD using a novel Panel Smooth Transition Regression technique. In particular, the study examined the inflation level at which it is detrimental to FSD. Unlike previous studies that impose the threshold value exogenously, this approach has the advantage of endogenously determining the threshold value.
Our results suggest a robust single threshold of 17.9% and 14.5% of inflation for ECOWAS and SADC, respectively. The significance of the results is that below 17.9% and 14.5% of inflationary rate, inflation may not be detrimental to the development of financial sector and its ability to allocate resources efficiently in ECOWAS and SADC, respectively. However, above these thresholds, inflation may impair efficient information flow in the financial system and hence interfere with its development. The PSTR results supported this argument with statistically significant negative inflation–finance coefficient above the threshold in both regions, but with only statistically significant positive coefficient at the lower inflation regime in SADC. Therefore, paying attention to these low and high inflation phenomena will result in significant gain in the financial sector of both regions.
In terms of policy implications, the study argues that price stability policies with inflation targeting framework should be the primary objective for monetary policy since high inflation is economically costly to the FSD of the two regions. Countries such as Ghana and South Africa are already taking the lead by adopting this framework. The inflation targets of the two countries are below the estimated low regime threshold of inflation in this study. South Africa has adopted a flexible inflation-targeting regime where inflation band is set. Currently, the band is 3–6% which is in line with the lower inflation regime in this study. Ghana’s current medium-term inflation target band is set at 8% plus or minus 2%. Hence, inflation targeting monetary framework may be adopted by all member states in these two regions since they strive towards common macroeconomic goals in order to reach convergence criteria. This can be replicated in other regional blocs of SSA. The adoption of this policy framework should be coupled with measures to achieve the targets.
Acknowledgements
This paper was presented at the Second Annual Financial Economics Conference at the Reserve Bank of South Africa organised on the 27–28 November 2014, with financial support from the Economic Research Southern Africa (ERSA). Grant from the Africa Economic Research Consortium (AERC) is also hereby acknowledged. All views expressed in this paper are solely those of the author.
Additional information
Funding
Notes on contributors
Sulemana Mahawiya
Sulemana Mahawiya is a Carnegie Scholar who obtained his PhD in Economic from the University of Cape Town, South Africa. He is currently a full-time lecturer of economics at the Kumasi Technical University in Kumasi, Ghana. His research cuts across monetary economics, financial sector development, foreign banking development and inflows and economic growth and development. In his recent publications, he has examined the effects of foreign banking inflows on the banking sector stability in sub-Saharan Africa. In addition, he has studied the determinants of demand for money.
Notes
1. See the recent ideas and calls for the formation of a Tripartite Cooperation in Trade in SSA.
2. Some of which includes achieving a low inflation rate as well stable exchange rate and stable economic growth rate.
3. See Boyd et al. (Citation2001) for more details.
4. See Boyd and Smith (Citation1998) Huybens and Smith (Citation1998, Citation1999) for more details.
5. The study used the dataset of Levine et al. (Citation2000) to determine whether there are any inflationary thresholds in the finance-growth linkage.
6. The authors acknowledged that the last variable was only available for advanced countries.
7. This is done using this formula: , where
is the financial variable,
is the end of period consumer price index and
average annual CPI.
8. ECOWAS includes Benin, Burkina Faso, Cape Verdi, Cote d’voire, Gambia, Ghana, Guinea Bissau, Mali, Niger, Nigeria, Senegal and Togo.
9. For the sample of 12 countries in each region, the PSTR results indicate threshold of 23.6% and 21.3% for ECOWAS and SADC, respectively, in Table in Appendix A reflecting the impact of higher inflationary regimes in DRC and Zimbabwe and Ghana.
10. The details of the results are not reported here and will be provided upon request. The threshold and slope for SADC are 14.9% and 1.89, respectively, whereas it is 17.87% and 432.6 for ECOWAS.
Related Research Data
References
- Abbey, E. N. (2013). Inflation and financial development: Evidence. American Journal of Economics and Business Administration, 4(4), 227. doi:10.3844/ajebasp.2012.227.236.
- Allen, D. S., & Ndikumana, L. (2000). Financial intermediation and economic growth in Southern Africa. Journal of African Economies, 9(2), 132–21. doi:10.1093/jae/9.2.132.
- Andrianaivo, M., & Yartey, C., . A. (2010). Understanding the growth of African financial markets. African Development Review, 22(3), 394–418. doi:10.1111/afdr.2010.22.issue-3.
- Azariadis, C., & Smith, B. D. (1996). Private information, money, and growth: Indeterminacy, fluctuations, and the Mundell-Tobin effect. Journal of Economic Growth, 1(3), 309–332. doi:10.1007/BF00141041.
- Aziakpono, M. (2004). Determinants of financial intermediation in the SACU countries: Preliminary evidence from a panel data analysis. Journal for Studies in Economics and Econometrics, 28(3), 113–132.
- Baltagi, B. H., Demetriades, P. O., & Siong, H. L. (2009). Financial Development and openness: Evidence from panel data. Journal of Development Economics, 89, 285–296. doi:10.1016/j.jdeveco.2008.06.006.
- BenNaceur, S., & Ghazouani, S. (2005). does inflation impact on financial sector performance in the MENA region? Review of Middle East Economics and Finance, 3(3), 219–229. doi:10.1080/14753680500407225
- Boyd, J. H., Levine, R., & Smith, B. D. (2001). The impact of inflation on financial sector performance. Journal of Monetary Economics, 47(2), 221–248. doi:10.1016/S0304-3932(01)00049-6.
- Boyd, J. H., & Smith, B. D. (1998). Capital market imperfections in a monetary growth model. Economic Theory, 11, 241–271. doi:10.1007/s001990050187.
- Caner, M., & Hansen, B. E. (2004). Instrumental variable estimation of a threshold model. Econometric Theory, 20, 813–843. doi:10.1017/S0266466604205011.
- Choi, S., Smith, B. D., & Boyd, J. H. (1996). Inflation, financial markets, and capital formation. Federal Reserve Bank of St. Louis Review, 78, 9–35.
- Colletaz, G., & Hurlin, C. (2006). Threshold effects of the public capital productivity: An international panel smooth transition approach. Working Paper, 1/2006. LEO, Universite d’Orleans, Paris.
- Demirgüç-Kunt, A., & Levine, R. (1996). Stock market development and financial intermediaries: Stylized facts. The World Bank Economic Review, 10(2), 291–321. doi:10.1093/wber/10.2.291.
- Detragiache, E., Gupta, P., & Tressel, T. (2006). Finance in lower-income countries: An empirical exploration. IMF Working Paper 05/167. Washington: International Monetary Fund.
- English, W. B. (1999). Inflation and Financial Sector Size. Journal of Monetary Economics, 44, 379–400. doi:10.1016/S0304-3932(99)00033-1.
- González, A., Terasvirta, T., & Dijk, D. V. (2005). Panel smooth transition regression models. Series in Economics and Finance. Working Paper, 60. Stockholm School of Economics, Government Finance Statistics, Stockholm.
- Granger, C. W., & Terasvirta, T. (1993). Modelling non-linear economic relationships. Oxford, OUP Catalogue.
- Hansen, B. E. (1999). Threshold effects in non-dynamic panels: Estimation, testing, and inference. Journal of Econometrics, 93(2), 345–368. doi:10.1016/S0304-4076(99)00025-1.
- Haslag, J. H., & Koo, J. (1999). Financial repression, financial development and economic growth. Federal Reserve Bank of Dallas Working Papers 9902, Dallas, Federal Reserve Bank of Dallas.
- Huang, H.-C., Lin, S.-C., Kim, D.-H., & Yeh, -C.-C. (2010). Inflation and the finance–growth nexus. Economic Modelling, 27, 229–236. doi:10.1016/j.econmod.2009.09.003
- Huybens, E., & Smith, B. D. (1998). Financial market frictions, monetary policy, and capital accumulation in a small open economy. Journal of Economic Theory, 81(2), 353–400. doi:10.1006/jeth.1997.2372.
- Huybens, E., & Smith, B. D. (1999). Inflation, financial markets and long-run real activity. Journal of Monetary Economics, 43(2), 283–315. doi:10.1016/S0304-3932(98)00060-9.
- Ibarra, R., & Trupkin, D. R. (2011). The relationship between inflation and growth: A panel smooth transition regression approach for developed and developing countries. Working paper No. 2011006. Montevideo, Banco Central del Uruguay.
- Im, K. S., Pesaran, M. H., & Shin, Y. (2003). Testing for unit roots in heterogeneous panels. Journal Of Econometrics, 115(1), 53–74.
- Jude, E. C. (2010). Financial development and growth: A panel smooth regression approach. Journal of Economic Development, 35(1), 15. doi:10.35866/caujed.
- Kablan, S. (2010). Banking efficiency and financial development in sub-Saharan Africa. Washington: International Monetary Fund.
- Khan, M. S., & Senhadji, A. S. (2001). Threshold effects in the relationship between inflation and growth. IMF Staff Papers, 48(1), 1–21.
- Khan, M. S., Senhadji, A. S., & Smith, B. D. (2001). Inflation and financial depth. IMF Working Paper, WP/01/442001. Washington: International Monetary Fund.
- Lee, C., & Wong, S. Y. (2005). Inflationary threshold effects in the relationship between financial development and economic growth: Evidence from Taiwan and Japan. Journal of Economic Development, 30(1), 49.
- Levin, A., Lin, C. F., & Chu, C. S. J. (2002). Unit root tests in panel data: asymptotic and finite - sample properties. Journal Of Econometrics, 108(1), 1–24.
- Levine, R. (1997). Financial development and economic growth: Views and agenda. Journal of Economic Literature, 35, 688–726.
- Levine, R., Loayza, N., & Beck, T. (2000). Financial intermediation and economic growth: Causality and causes. Journal of Monetary Economics, 46, 31–77. doi:10.1016/S0304-3932(00)00017-9.
- McDonald, C. A., & Schumacher, L. (2007). Financial deepening in Sub-Saharan Africa: Empirical evidence on the role of creditor rights protection and information sharing. IMF Working Paper, WP/07/203, Washington: International Monetary Fund.
- Mignon, V., & Villavicencio, A. (2011). On the impact of inflation on output growth: Does the level of inflation matter? Journal of Macroeconomics, 33, 455–464. doi:10.1016/j.jmacro.2011.02.003
- Odhiambo, N. M. (2008). Financial depth, savings and economic growth in Kenya: A dynamic causal linkage. Economic Modelling, 25, 704–713. doi:10.1016/j.econmod.2007.10.009.
- Omay, T., & Oznur Kan, E. (2010). Re-examining the threshold effects in the inflation-growth nexus with cross-sectionally dependent non-linear panel: Evidence from six industrialized economies. Economic Modelling, 27, 996–1005. doi:10.1016/j.econmod.2010.04.011.
- Rajan, R. G., & Zingales, L. (2003). The great reversals: The politics of financial development in the twentieth century. Journal of Financial Economics, 69, 5–50. doi:10.1016/S0304-405X(03)00125-9.
- Rousseau, P. L., & Wachtel, P. (2002). Inflation thresholds and the finance–growth nexus. Journal of International Money and Finance, 21(6), 777–793. doi:10.1016/S0261-5606(02)00022-0.
- Rousseau, P. L., & Yilmazkuday, H. (2009). Inflation, financial development, and growth: A trilateral analysis. Economic Systems, 33(4), 310–324. doi:10.1016/j.ecosys.2009.06.002.
- Schiavo, S., & Vaona, A. (2007). Nonparametric and semiparametric evidence on the long run effects of inflation on growth. Economics Letters, 94, 452–458. doi:10.1016/j.econlet.2006.09.004.
- Seleteng, M., Bittencourt, M., & van Eyden, R. (2013). Non-linearities in inflation–growth nexus in the SADC region: A panel smooth transition regression approach. Economic Modelling, 30, 149–156. doi:10.1016/j.econmod.2012.09.028.
- Thanh, S. D. (2015). Threshold effects of inflation on growth in the ASEAN-5 countries: A panel smooth transition regression approach. Journal of Economics, Finance and Administrative Science, 20, 41–48. doi:10.1016/j.jefas.2015.01.003.
- Zoli, E. (2007). Financial development in emerging Europe: The unfinished agenda. IMF working Paper, Washington: International Monetary Fund.
Appendix A.
Results that include DRC Ghana and Zimbabwe
Table A1. Test of linearity against non-linearity
Table indicates that linearity is rejected at 1% significance levels in both regions. However, Table reveals the relationship is adequately modelled by a single threshold (two regimes), hence, rejecting double threshold at 1% and 5% significance level.
Table A2. Testing the number of regimes: tests of no remaining non-linearity
Table A3. PSTR results with DRC Ghana and Zimbabwe
Appendix B.
Sensitivity Analysis
The test of linearity suggests that the relationship is not linear from Table and hence we tested for no remaining nonlinearity and results in Table supports the existence of one threshold as indicated by the p-values
Table B1. Test of linearity against non-linearity-savings
Table B2. Testing the number of regimes: tests of no remaining non-linearity
The PSTR results are reported on Table which shows evidence of single threshold for the two regions similar to the baseline results.
Table B3. Sensitivity analysis of PSTR results with DRC Ghana and Zimbabwe
Figure B. Transition function of the two regions
Appendix C.
Table C1. Showing description of data and source