?Mathematical formulae have been encoded as MathML and are displayed in this HTML version using MathJax in order to improve their display. Uncheck the box to turn MathJax off. This feature requires Javascript. Click on a formula to zoom.
Abstract
This study investigates the reaction of stock returns to the inflation announcement using time series data from 2012 to 2018. To check the market efficiency or semi-strong efficiency of the Indian Stock Market for inflation announcement, we have used an event study methodology. We selected nine events based on consensus estimate and actual inflation number; we put events into subgroups based on over-estimation, under-estimation, and accurate estimation. We performed an event study on inflation-sensitive sectors such as Banking, Energy, Realty, Service, and FMCG. To check for the above objectives, we calculated Average Abnormal Return (AAR), Cumulative Abnormal Return (CAR), and Cumulative Average Abnormal Return (CAAR). The finding of the study suggests that there are considerable abnormal returns, which are a function of the sector and the regime. Some sectors are more sensitive to inflation announcements, and some regimes are again more sensitive to inflation announcements.
Keywords:
PUBLIC INTEREST STATEMENT
The paper studies the market reaction of stock market to inflation announcement across the inflation switching regime. We study the five sectors namely, banking, realty, energy, services, and housing and check which sector is more sensitive to inflation announcements. Out of 88 events we select 9 random events based on consensus estimate and actual inflation to test the stock market efficiency for inflation announcement. Using event study methodology we found that there are significant AAR and CAR which is function of the sector and regime. Hence, markets are not efficient in the short run. However, the inflation effect seemed to dying as India moved from WPI to CPI and later when it adopted IT.
1. Introduction
Numerous factors influence the stock markets, such as domestic and foreign news. Some news or announcements are firm-specific or affect a particular sector, whereas others affect the market as a whole like inflation, GDP growth, the repo rate, to name a few. Inflation is one of the macroeconomic factors that could influence the stock market (Corrado & Jordan, Citation2002;). Inflation is the increase in the price of goods and services over a period of time. An increase in prices decreases the purchasing power of money and the value of the financial asset. India is an economy that has lived with inflation throughout its history. India’s inflation was on the rise over the last decade; however, the numbers have started to change since 2010. The Indian economy is doing well post 2010, where it had a 10% inflation level, and now it is below 4%. Over the years, there have been numerous studies analyzing the effect of inflation and related macro-economic events on the financial market. Some studies, such as Fama and William Schwert (Citation1977), Schwert (Citation1981) and Fama (Citation1981) found a negative correlation between the stock market and inflation. However, some studies, such as Pearce and Roley (Citation1985) and Hardouvelis (Citation1988), found very little or no significant relationship between inflation and the stock market. For India, Chatrath et al. (Citation1997) found stock returns to be a perfect hedge for the expected component of inflation but showed a negative relationship for the unexpected component of inflation. Our paper attempts to study the market reaction of inflation announcement on stock prices and find out how the relationship holds for India, as there are very few studies on the emerging markets.
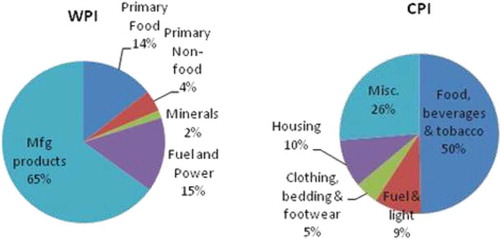
The Indian economy had moved from Wholesale price index (WPI) to Consumer price index (CPI) in 2014 and then went on to adopt inflation targeting in 2015. Wholesale price index (WPI) and the Consumer price index (CPI) are two sources of information to detect inflation. Consumer price index (CPI) is a measure that calculates inflation based on the weighted average of prices of goods and services, such as petrol, food, clothing, medical care, and cars. The wholesale price index (WPI) is an indicator of price changes in the wholesale market. It calculates the prices paid by the manufacturers and wholesalers in the market. The composition of both WPI and CPI is different, as shown in (Please refer to Appendix A); hence, both reports different inflation numbers. By inflation targeting, the central bank (RBI) sets a specific interest rate as the goal. It tries to achieve it through various measures such as interest rate, reserve requirement and changing the money supply. Since the service sector accounts for 60% GDP, it was necessary to look at CPI to get a better picture of the economy as the weight of services is more in CPI. CPI is also a better measure of monetary policy decisions and interest rate decisions. India adopted inflation targeting because it offers a framework to achieve a specific inflation rate credibly and sustainably. Inflation targeting also imposes discipline on monetary policies. From the past literature, we can see that there have been very few studies trying to study the short run response or impact of inflation announcement on stock prices in the inflation switching environment, i.e., from WPI to CPI, and then inflation targeting.
According to Fama (Citation1970), markets are efficient when stock prices reflect all available information. Ross, Westerfield, and Jaffe (Citation1999) argue that since stock prices reflect all the information, an investor or trader should only get a normal rate of return, and no abnormal return should be present. Markets are efficient when there is no abnormal return, and stock prices reflect all available information. Indian markets are efficient to inflation announcement if that announcement can’t be used to earn an abnormal return. It would be interesting to see if stock markets reflect the information content of the inflation announcement across the inflation switching regime. In this study, we have used an event study methodology to analyze the effect of inflation on stock prices using Nifty 50 as the market index. There are nine events in total, three during the Wholesale price index (WPI) regime, three during the Consumer price index (CPI) regime, and three when India adopted Inflation targeting. The objective of the study is to investigate the short-run effect of inflation announcement on stock prices for various sectors during the event window though stock market reaction. There are limited studies that investigate the impact of inflation on various sectors in an inflation switching environment, i.e., from Wholesale price index (WPI) to Consumer price index (CPI) and later to inflation targeting. We have selected five inflation-sensitive sectors, namely, Banking, Energy, Realty, FMCG, and Services. Our study has added to the existing literature by investigating the short-run response of daily stock prices on the Indian market to inflation announcements in an inflation switching environment across different sectors, within the framework of an emerging market like India. The rest of the paper is organized as follows; section 2 reviews the existing literature related to the impact of inflation on stock prices, section 3 describes the data and methodology used, section 4 details the results and analysis and section 5 gives the conclusion, limitation of our study and scope for future research.
2. Literature review
According to economic theory, the nominal return is the sum of expected inflation and real return. So, the stock return should be positively related to inflation, assuming inflation and real return are independent. Fisher (Citation1930) expected nominal return of stock to be equal to expected inflation plus the real rate of return. Fisher’s hypothesis also predicts a positive relationship between stock return and inflation. According to the Fisher Hypothesis, the stock market should act as a hedge against inflation. Another school of thought (Fama Proxy Hypothesis, Citation1981) says that the stock market is not affected by inflation. However, there has been empirical work showing changes in the expected inflation are negatively affecting the stock return. Nelson (Citation1976), Jaffe and Mandelker (Citation1976), Bodie (Citation1976), Fama and William Schwert (Citation1977), Modiglian and Cohn (Citation1979), Geske and Roll (Citation1983) and Kaul (Citation1987) supported the negative relationship between stock return and inflation. Several reasons put forth for this negative relationship was taxation-relationship, dividend price ratios, and price-earnings ratios, negative relationship between inflation and real economic activity, etc.
Díaz and Jareño (Citation2009) studied the short-run effect of inflation announcement on stock prices in various sectors. They used an event study methodology to investigate the relation between unanticipated inflation announcements and stock returns. There was no evidence of a significant relationship between abnormal return and inflation announcement. Adams, McQueen, and Wood (Citation2004) studied the intraday stock return for PPI and CPI and find that the news response is strong when the economy is strong and the news is bad. Schwert (Citation1981) examined the daily returns of Standard’s and Poor’s around the CPI announcement and observed negative market reaction for unanticipated inflation component in CPI. Jain (Citation1988) also found a negative effect on stock prices and trading volume using hourly data for the CPI announcement.
According to Knif, Kolari, and Pynnönen (Citation2008), stock market reaction can provide a different result for both positive and negative inflation shock depending on the state of the economy, i.e., the effect of inflation on stock returns depends on how investors perceive inflation in different economic state. Wei (Citation2009) further supported the study and found equity returns respond negatively to unexpected inflation during contraction than expansion.
Khil and Lee (Citation2000) checked for real stock return and inflation relationship for the U.S. and 10 Pacific Rim countries for the sample period from 1970 to 1997. They found a negative real stock return and inflation correlation for 9 Pacific Rim countries and the U.S. However, Malaysia showed a positive relationship between real stock return and inflation. The reason for checking pacific and the U.S. was because of the inflation rate. For example, the U.S. experiences mild inflation, whereas the Asian countries experience very high inflation. Pimentel and Choudhry (Citation2014) provide empirical evidence of the positive relationship between composite stock returns and inflation for Brazil during periods of high inflation.
Tiwari, Dar, Bhanja, Arouri, and Teulon (Citation2015) found stock returns and inflation to be positively related to CPI and independent for PPI (Producers Price Index). Overall, using both measures, they also found that in the long run, stocks could be used as a hedge against inflation in Pakistan. One of the more recent studies by Antonakakis et al. (Citation2017) examined the dynamic conditional correlation of stock prices and inflation in the U.S. over the period of 1791–2015. They observed the correlation between inflation and stock prices evolve heterogeneously over time. In particular, the correlation is significantly positive in the 1840s, 1860s, 1930s, and 2011 and significantly negative for other time periods.
The existing literature includes three groups of studies: short-run response of inflation announcement on stock returns, short-run relationship, and long-run relationship. To sum up, empirical literature provides a mixed conclusion on the relationship between inflation and stock returns. Further, it would be interesting to see the market reaction of inflation announcement in a country like India behaves, which has moved from WPI in 2014 to CPI and later adopted inflation targeting in 2016 for five years, which is supposed to end in 2021. It would also be interesting to check if the source of inflation number matter along with inflation targeting in determining the relationship between inflation and stock returns?
Our study adds to the existing literature by checking the short-run response of stock return to inflation announcement in the inflation switching environment across sectors. Here, we study the impact of inflation on various inflation-sensitive sectors like FMCG, bank, realty, services, etc. in a regime-switching environment to find out which sector is more sensitive to inflationary announcement when compared to others. We have used event study methodology, and the events were selected based on the actual inflation and forecasted inflation. Our paper has one more distinct feature in comparison to the existing work. We have also used several events as compared to the existing works where the study was based on only a few events. We selected the events based on consensus estimates and actual inflation.
3. Data and methodology
We have used an event study to understand the relationship between inflation & stock market returns. With an event study, one can find the effect of a particular event (MacKinlay, Citation1997). Event study has been widely used to check the stock price movement around an event (Ashley Citation1962; Ball & Brown, Citation1968; Barker, Citation1956; Dolley, Citation1933; Fama, Citation1981; Fama, Fisher, Jensen, & Roll, Citation1969; Myers & Bakay, Citation1948; Watts Citation1978). We have also followed the same approach and used the event study approach to measure the impact of inflation announcement on stock prices and thereby check market efficiency. By market efficiency, we mean, stock prices should reflect all available information that is publicly and privately available, which means there should be no abnormal returns.
For conducting the event study, we have used three sets of data. Firstly, we used the inflation announcements measured in terms of WPI and CPI (actual and forecast). The actual inflation number is the reported number, and the forecast is a consensus estimate based on the combined estimate of analysts covering the inflation data. The inflation announcement data is taken from https://in.investing.com/economic-calendar/indian-cpi-973. Secondly, we took the closing price of each stock from the respective sectoral indices (Banking NIFTY, Energy NIFTY, Realty NIFTY, Services NIFTY, and FMCG NIFTY). Thirdly, we used the closing price of the Nifty 50 index. In this study, we had a total of 88 sample events for inflation announcement, out of which we randomly selected nine events based on the over-estimation, under-estimation, and accurate. There is over-estimation when forecasted inflation is more than the actual inflation and under-estimation when actual inflation is more than the forecasted inflation. An event is accurate when actual inflation is equal to forecasted inflation.
The rationale behind this approach is that the unexpected component contains new information, which is not reflected in the stock prices. Over here, unexpected would mean over and underestimation, and hence it would be interesting to see the changes in stock prices around the event. The stock prices and Nifty 50 data are from the Prowess database. The events selected for the study are reported in Table (Please refer to Appendix B). The timeline used for the event study includes the event date (announcement date), test period or event window, and estimation window. As explained below, the event date is day 0, the estimation period which is ten days before the event date () is of 90 days from which we estimate “alpha” and “beta” as suggested by Brown and Warner (Citation1985) and our event window is of 10 days. Alpha is the intercept, and beta being the slope coefficient. Beta is also stock’s volatility as compared to the market (Panayides & Gong, Citation2002).
Table 1. Results of the empirical analysis
Table B1. Details of events undertaken for the study
To study the effect of inflation announcement on stock returns, we need to look at returns instead of share prices. Hence, we calculated the log-returns using the formula:
Where,
: is the closing price of the security on day t of security i
: is the closing price of the security on day t − 1 of security i
t: refers to time
: is the return on security i on day t
Now, we try to find out the expected return by using a simple OLS regression analysis, where the parameters are calculated from the estimation period, which is consistent with the market model approach (MacKinlay, Citation1997). Our main assumption to use the market model is that security returns are a linear function of the market movement. Market model (Strong, Citation1992) assumes that returns are generated using the following formula:
: is the expected return at time t of security i
are the parameters of the regression equation, where alpha (α) is the intercept, which is nothing but risk -free rate and beta (β) is slope measuring the sensitivity of stock with the market.
: is the daily return on a stock market index m, at time t
To find out if the stock market is efficient or not, we need to check for abnormal returns around the event date. The benchmark to calculate abnormal returns is the normal return, which is calculated from the estimation period. Abnormal return around the event date is the difference between the actual observed return and the calculated normal return, (, for each day of the event window (Seiler, Citation2004).
Therefore, the abnormal return (AR) of security would be:
: is the abnormal return of security i, at time t
: is the actual or observed return of security i, at time t
: is the expected return on security i, at time t calculated using the market model.
Here, the null hypothesis is: AR = 0
To better understand the effect of inflation announcement on stock returns, we also calculate the cumulative average abnormal return by accumulating the abnormal return over the event window (,) to see if the information is reflected earlier or later and check for buy and hold strategy by looking ACAR.
We then calculate the average Cumulative abnormal return (CAR) over the event window (
The significance of CAR and AAR is then tested using a t-stat.
Larger the t statistic, the less likely that the actual value of the parameter could be 0. That is to say, a significant t-statistic leads to rejecting the null hypothesis, and it also suggests the existence of positive or negative abnormal returns owing to inflationary announcements. In this paper, we see the impact of the inflation announcement on stock returns in the period from July 2011 to December 2018. The reason for selecting this period is that India moved from WPI to CPI in 2014 and then adopted inflation targeting in 2016. We study five sectors (Banking, Energy, Realty, Services, and FMCG) based on their sensitivity to inflation data and the weights they got when calculating the inflation number. We also check for the stock market reaction when India moved from WPI to CPI and later when it adopted inflation targeting.
4. Empirical results
When markets are efficient, there would be no abnormal return, and prices should reflect all the available information. Hence, it would be impossible to make abnormal returns by using past price and volume data, or by trading on publicly available information or insider information. It means markets are strong form efficient. If the event window contains no abnormal return, it means that inflation announcement news is already reflected in the stock prices, and there is no relationship between abnormal return and inflation announcement. However, if the prices reflect the inflation announcement news just around the event date, then it means that there are abnormal returns. It will be interesting to see if the abnormal return is positive or negative. According to economic literature, stock return should be positively related to inflation because equities act as a hedge against inflation. This is one of the main reasons why individuals invest in stocks. Empirical literature finds that inflation is negatively related to stock returns (Fama & William Schwert, Citation1977). We examine the impact of each event separately on each sectoral return. Further, we have divided the events into three groups WPI (wholesale price index), CPI (consumer price index), and IT (Inflation targeting). Also, based on consensus estimates in each group, we have accurate events (consensus is equal to actual inflation), overestimation (forecast is more than actual inflation), and underestimation (forecast is less than actual inflation).
The Table 1 present the AAR and CAR along with their t-statistics over the event window. Before we discuss the findings and results, it’s essential to know the notations used. The left side events correspond to WPI (Wholesale Price Index), and we have used W to represent it, the center corresponds to CPI (Consumer Price Index), and we represent the same by C, and the right side events fall under IT(Inflation targeting) regime. Accurate events are marked as A; Underestimation events are marked as U and Overestimation events are marked as O. For example, E.1A-W means the first event is accurate, and the source of inflation number is WPI.
4.1. Findings and discussion
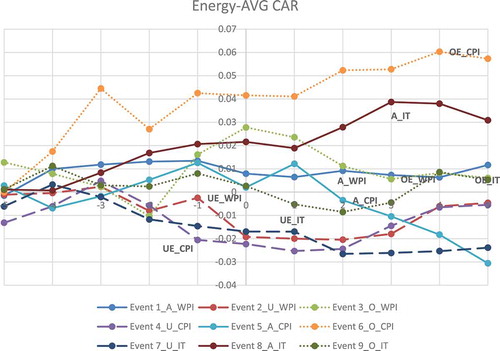
In the banking sector, out of 9 events, only 2 showed statistically significant ACAR(Average cumulative abnormal return) and AAR(Average abnormal return) on the event date. One was an underestimation, which is event 4, which is statistically significant at the 5% level, and the other one was event 6, which is statistically significant at the 10% level. Both events 4 and 6 are in the CPI regime. However, there are significant abnormal returns present on days before the announcement and after the announcement for most events. The effect of the inflation announcement seems to be dying as India moved from WPI to CPI and later to IT.Footnote1 Figure depicts the average cumulative abnormal return over the event window. As seen on the graph, there are abnormal returns, and the returns continue even after the announcement date. However, ACAR is most for WPI and CPI as compared to IT. Since the interest rate and inflation are linked, and the central bank uses the interest rate to control inflation, it is very evident that the banking sector would be affected by inflation. When looking at the results of the energy sector, we have a total of 3 events (2 Overestimation and 1 Underestimation), which have statistically significant ACAR and AAR on the event date. Two are in the WPI regime and one in CPI. Here, events 4(Underestimation) and 6(Overestimation) only show a strong presence of significant abnormal returns before and after the inflation announcement. We don’t see much AAR on the event date or in the event window, suggesting that the energy sector is not very sensitive to the inflation announcement. Overestimation events seem to be showing some returns when compared to under-estimation and accurate. The rationale could be that an overestimation event overstates inflation. When inflation is actually below the forecast, this leads to lower energy prices, which would directly benefit the energy sector as energy prices and inflation are positively related. Hence, underestimation events give negative returns and overestimation positive for the energy sector. As seen from Figure , there are abnormal returns and, ACAR is very strong for the CPI regime as compared to WPI and IT.
Figure 1. AVG CAR of banking sector
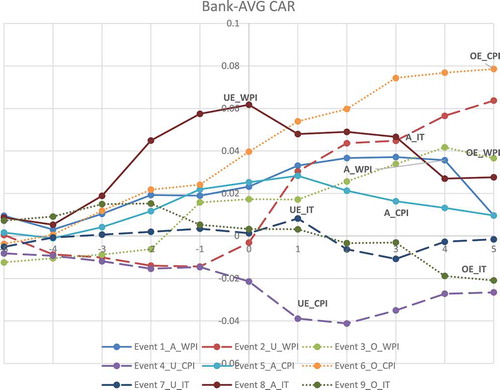
Figure 2. AVG CAR of energy sector
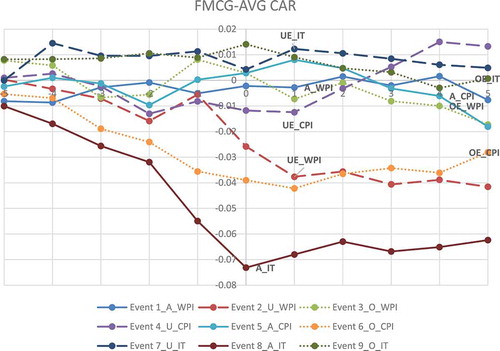
High food inflation has an adverse effect on the FMCG sector, according to economic theory. Four events are showing the effect of inflation announcement on event date for the FMCG sector. Event 2(Underestimation), Event 6(Overestimation), Event 8(accurate), and Event 9(Overestimation) are the four events. The magnitude of the effect of the inflation announcement is the same across all three regimes, and there seem to be very few significant abnormal returns before and after the announcement date. The Overestimation events are giving positive returns, while accurate and under-estimation give negative returns. Figure shows the ACAR for the FMCG sector. The graph seems to be supporting the economic theory as the ACAR shows extreme negative returns for some events which fall to minus 7% on the event date. Even the positive ACAR for FMCG is very low compared to all the events.
Figure 3. AVG CAR of FMCG sector
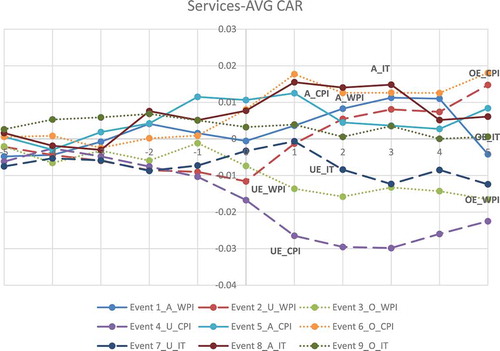
Housing has 10% weighting in CPI and 0% weighting in WPI, and hence we expect abnormal returns to be statistically significant during the CPI and IT regimes. As expected, we find no statistically significant abnormal returns on event date in the WPI regime, whereas, for the CPI regime, we have two statistically significant abnormal returns on event date for CPI regime and one statistically significant abnormal return on event date in the IT regime. However, we don’t see much strong presence of significant abnormal returns before and after the inflation announcement in either of the regime. Looking at Figure , ACAR shows extreme returns compared to other sectors. The event date returns range from—11% to 6%. WPI measures the prices of goods only, whereas CPI measures the prices of goods and services. Hence, the CPI index includes services components like health, education, and transport, which is not present in WPI. However, the result seems to be not in line with the expectation. We have three statistically significant abnormal returns on the event date, two in the WPI regime, and one in the CPI regime. The effect also seems to die when India moved from WPI to CPI and then to IT. Looking at Figure , the ACAR for the service sector shows very little abnormal return during the IT regime. The ACAR is also very less for the service sector compared to all the four sectors. The reason for low abnormal return in the service sector could be because the service sector index is made up of 31 stocks. In contrast, the Banking index has 12, the Energy index has 10, the FMCG index has 15, and the Realty index has ten stocks, respectively.
Figure 4. AVG CAR of realty sector
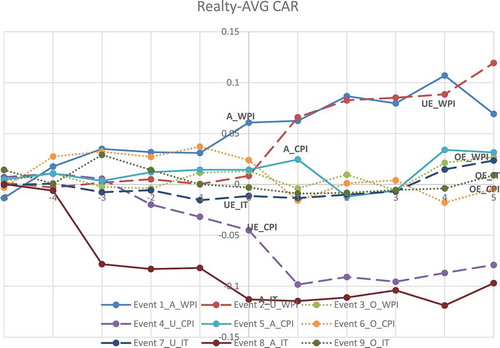
Figure 5. AVG CAR of service sector
To sum up, from a market efficiency perspective, Indian markets are not efficient in the short run to the inflation announcement as there seems to be a considerable amount of abnormal returns for most of the events. However, the efficiency is varied across the different sectors as some sectors are more sensitive to inflation announcement and report a higher number of statistically significant abnormal returns along with high ACAR and AAR. The impact is also a function of the estimates and inflation switching regime as some sectors are more sensitive in one regime as compared to others.
5. Conclusion
The study aimed at testing for semi-strong form efficiency in the Indian stock market. We investigate the effect of inflation announcement on the stock market by looking at the five sectors from 2012 to 2018. The estimation period is 90 days and starts from and ends at
(t being the event date), while the test period is of 10 days and starts from
and ends at
(t being the event date). We used the market model to predict future stock returns and further adopted a simple OLS regression to get the parameters of the regression equation. We then compared the t-statistics to check for statistically significant abnormal returns. The major finding is that we reject the null hypothesis, AR = 0. We find strong evidence to reject the hypothesis that Indian markets reflect the information content of the inflation announcement, and there is no abnormal return. However, the market reaction is different across sectors and inflation switching regime. The inflation effect seemed to dying as India moved from WPI to CPI and later when it adopted IT. One explanation is that continued experience of the IT regime has brought about a greater understanding of the RBI monetary policy decisions. Hence there are fewer surprises post the IT regime as inflation and interests rate are somewhat predictable.
5.1. Policy and limitation
This study adds to the existing literature by helping in understanding the behavior of the stock market when there is an inflation announcement in a developing economy like India. Further, it adds to the existing literature by checking the relationship between inflation announcement and stock return in the inflation switching environment across sectors, and we find out which sector is more sensitive to inflationary announcement when compared to others. These results will help analysts, mutual fund managers, and traders to make an informed decision. However, the study has some limitations. We have studied only five sectors, and it is difficult to compare the service sector with other sectors because a large number of stocks have been included in the services sector index as compared to the realty sector. Hence, the high volatility in the realty index and low in service sector index could be because of risk getting spread across many stocks in the service sector. We could also reduce some events and concentrate on a few, for example studying only Overestimation, Underestimation or accurate estimation of inflation on a select few sectors for a few events. Lastly, the inflation data generally come around 2:30, giving very little time to market participants to understand the impact of inflation announcement on the economy as markets close by 3:30. It would be interesting to check the next day’s open price and see what the overnight effect of the inflation announcement is on the stock market.
Additional information
Funding
Notes on contributors
Gurmeet Singh
Gurmeet Singh is a Ph.D. Scholar in Department of Finance, Institute for Financial Management and Research affiliated to University of Madras. His research interest is in Corporate Finance, Macroeconomics and Derivatives.
Lakshmi Padmakumari
Lakshmi Padmakumari is currently working as an Assistant Professor, Department of Finance with IFMR Graduate School of Business, Krea University. She is a Gold Medalist & University First Rank holder in her bachelor’s and master’s program. Her research interests mainly include in the areas of asset pricing, volatility modeling, financial econometrics and risk management. She has participated and presented her research papers at multiple conferences both in India and abroad. She can be reached at [email protected]
Notes
1. All the graphical figures are depicted in Appendix III.
References
- Adams, G., McQueen, G., & Wood, R. (2004). The impact of inflation news on high frequency stock returns. The Journal of Business, 77, 547–22. doi:10.1086/386530
- Antonakakis, N, Gupta, R, & Tiwari, A. K. (2017). Has the correlation of inflation and stock prices changed in the united states over the last two centuries?. Research in International Business and Finance, 42, 1–8. doi:10.1016/j.ribaf.2017.04.005
- Ashley, J. W. (1962). Stock prices and changes in earnings and dividends: some empirical results. Journal Of Political Economy, 70(1), 82–85.
- Ball, R., & Brown, P. (1968, October). An empirical evaluation of accounting income numbers. Journal of Accounting Research, 1, 159–178. doi:10.2307/2490232
- Barker, C. A. (1956). Effective stock splits. Harvard Business Review, 34(1), 101–106.
- Bodie, Z. (1976). Common stocks as a hedge against inflation. Journal of Finance, 31, 459–470. doi:10.1111/j.1540-6261.1976.tb01899.x
- Brown, S. J., & Warner, J. B. (1985). Using daily stock returns: The case of event studies. Journal of Financial Economics, 14(1), 3–31. doi:10.1016/0304-405X(85)90042-X
- Chatrath, A, Ramchander, S, & Song, F. (1997). Stock prices, inflation and output: Evidence from India. Applied Financial Economics, 7(4), 439–445.
- Corrado, C. J., & Jordan, B. D. (2002). The fundamentals of investments valuation and management (2nd ed.). USA: McGraw-Hill Companies Inc.
- Díaz, A., & Jareño, F. (2009, September). Explanatory factors of the inflation news impact on stock returns by sector: The Spanish case. Research in International Business and Finance, 23(3), 349–368. Elsevier. doi:10.1016/j.ribaf.2008.12.001
- Dolley, J. C. (1933). Characteristics and procedure of common stock split-ups. Harvard Business Review, 11(3), 316–326.
- Fama, E. (1981). Stock returns, real activity, inflation and money. American Economic Review, 71(4), 545–565.
- Fama, E., Fisher, L., Jensen, M., & Roll, R. (1969). The adjustment of stock prices to new information. International Economic Review, 10(1), 1–21. doi:10.2307/2525569
- Fama, E., & William Schwert, G. (1977). Asset returns and inflation. Journal of Financial Economics, 5(2), 115–146. doi:10.1016/0304-405X(77)90014-9
- Fama, E. F. (1970). Efficient capital markets: A review of theory and empirical work. The Journal of Finance, 25(2), 383–417. doi:10.2307/2325486
- Fisher, I. (1930). Theory of interest. New York: MacMillan.
- Geske, R., & Roll, R. (1983). The fiscal and monetary linkage between stock returns and inflation. The Journal of Finance, 38(1), 1–33. doi:10.1111/j.1540-6261.1983.tb03623.x
- Hardouvelis, G. A. (1988). The predictive power of the term structure during recent monetary regimes. Journal of Finance, 43(2), 339–356. doi:10.1111/j.1540-6261.1988.tb03943.x
- Jaffe, J., & Mandelker, G. (1976). The fisher effect for risky assets: An empirical investigation. Journal of Finance, 31, 447–458. doi:10.2307/2326616
- Jain, P. C. (1988). Response of hourly stock prices and trading volume to economic news. Journal of Business, 61, 219–231. doi:10.1086/296429
- Kaul, G. (1987). Stock returns and inflation: The role of the monetary sector. Journal of Financial Economics, 18, 253–274.
- Khil, J., & Lee, B.-S. (2000, July). Are common stocks a good hedge against inflation? Evidence from the Pacific-rim countries. Pacific-Basin Finance Journal, 8(3–4), 457–482. Elsevier. doi:10.1016/S0927-538X(00)00019-6
- Knif, J., Kolari, J., & Pynnönen, S. (2008). Stock market reaction to good or bad news. Journal of Financial Research, 31, 141–166. doi:10.1111/j.1475-6803.2008.00235.x
- MacKinlay, A. C. (1997). Event studies in economics and finance. Journal of Economic Literature, 35(1), 13–39.
- Modigliani, F, & Cohn, R. A. (1979). Inflation, rational valuation and the market. Financial Analysts Journal, 35(2), 24–44.
- Myers, J. H., & Bakay, A. J. (1948). Influence of stock split-ups on market price. Harvard Business Review, 26(2), 251–255.
- Nelson, C. R. (1976). Inflation and rate of return on common stocks. The Journal of Finance, 31, 471–483. doi:10.1111/j.1540-6261.1976.tb01900.x
- Panayides, P. M, & Gong, X. (2002). The stock market reaction to merger and acquisition announcements in liner shipping. International Journal Of Maritime Economics, 4(1), 55–80.
- Pearce, D. K., & Roley, V. V. (1985). Stock prices and economic news. The Journal of Business, 58, 49–67. doi:10.1086/jb.1985.58.issue-1
- Pimentel, R. C., & Choudhry, T. (2014). Stock returns under high inflation rate and interst rates: Evidence from the Brazilian market. Emerging Markets Finance and Trade, 50(1), 71–92. doi:10.2753/REE1540-496X500104
- Ross, S., Westerfield, R. W., & Jaffe, J. (1999). Corporate finance (5th ed.). New York: McGraw-Hill.
- Schwert, G. W. (1981). The adjustment of stock prices to information about inflation. The Journal of Finance, 36(1), 15–29. doi:10.1111/j.1540-6261.1981.tb03531.x
- Seiler, M. J. (2004). Performing financial studies: a methodological cookbook. Prentice Hall.
- Strong, N. (1992). Modelling abnormal returns: a review article. Journal Of Business Finance & Accounting, 19(4), 533–553.
- Tiwari, A. K., Dar, A. B., Bhanja, N., Arouri, M., & Teulon, F. (2015). Stock returns and inflation in Pakistan. Economic Modelling, 47, 23–31. doi:10.1016/j.econmod.2014.12.043
- Watts, R. L. (1978). Systematic ‘abnormal’returns after quarterly earnings announcements. Journal Of Financial Economics, 6(2–3), 127–150.
- Wei, C. (2009). Does the stock market react to unexpected inflation differently across the business cycle? George Washington University, 19(24), 1947–1959.
Appendix A
Figure A1. Depicting the composition of WPI & CPI