
 ?Mathematical formulae have been encoded as MathML and are displayed in this HTML version using MathJax in order to improve their display. Uncheck the box to turn MathJax off. This feature requires Javascript. Click on a formula to zoom.
Abstract
The study aims to identify which aspects of financial practices of managers need to be given priority in achieving a turnaround in the financial sustainability of these manufacturing companies across long-term returns, sustainable growth and financial distress. Currently, the Nigerian manufacturing sector experiences a decline in financial sustainability, thus forcing financially unsustainable companies out of business. Financial practices that improve the long-term financial position and performance need to be implemented. These financial practices can be measured across short-term profitability, efficiency, liquidity and solvency. Some studies have considered sustainability from a financial perspective using one or two measures but very few focus on the Nigerian manufacturing sector. This study fills these gaps by investigating the impact of financial practices on financial sustainability across these measures. Panel dataset for 17 companies from 2008 to 2016 was collected and analysed using the correlation matrix and random effect model. All regressors were significant in explaining financial distress. However, only short-term profitability and efficiency ratios were consistently significant across all three models, thus indicating the superiority of financial practices that affect short-term profits and efficiency. The study recommends that companies should implement financial policies that address periodic costs and productivity while maximizing marketing efforts simultaneously.
Jel classification:
PUBLIC INTEREST STATEMENT
Many investors want to know the key financial ratios to monitor so as to avoid investing in companies that are heading towards bankruptcy. The study aims to identify which aspects of financial practices of managers need to be given priority in achieving a turnaround in the financial sustainability of these manufacturing companies across long-term returns, sustainable growth and financial distress. Data were collected for 17 companies from 2008 to 2016 and analysed using the correlation matrix and random effect model. Short-term profit, efficiency, liquidity and solvency were all found to be significant in explaining financial distress. However, only short-term profitability and efficiency ratios were consistently significant across all three models. This indicates that profitability and efficiency play a special role in distinguishing financially sustainable companies from unsustainable ones. The study advises managers to pay special attention to business activities that reduce periodic costs and increase productivity.
1. Introduction
The effects of the global economic recession are still observable, and no government can avoid this reality by telling its citizens that everything is fine (Atoyebi, Okafor, & Falana, Citation2014). Looking at Nigeria’s GDP, the share of the manufacturing sector has been relatively low. For the year 1970, the contribution to GDP stood at 9%. In 1980, it rose to 10%. It dropped to 8% in 1990 and lower to 6% in 1998. Between 1980 and 2006, there was a steady decline from 10% to 3.91% (CBN Annual Report, Citation2008). From 2006 to 2008, there was a slight increase from 3.91% to 5.9% which was followed by a subsequent drop in 2009 to approximately 4.2%. Although this may partly be due to the country’s overreliance on revenue from crude oil. However, the manufacturing sector in Nigeria is still at a burgeoning stage, and thus, has great scope for expansion. Manufacturing is increasingly important to the Nigerian economy, as the government attempts to expand the non-oil sector to reduce its dependence on petroleum. There has been little or no change in the low percentage contribution to GDP over the years. The president of the Nigerian Association of Chambers of Commerce, Industry, Mines and Agriculture (NACCIMA), “majority of the surviving manufacturing firms have been classified as unhealthy”. Anecdotal evidence suggests that the manufacturing sector, in 2012, contributed only 5% to the country’s GDP (Alli, Citation2012). An analysis of the GDP figures from the National Bureau of Statistics revealed that the manufacturing sector’s contribution to the national income dropped from 8.97 trillion naira as at December 2015 to 8.89 trillion naira as at December 2016. Even as a few manufacturing companies attract investors from home and abroad, others are shutting down. Within the years 2000 and 2010, about 850 manufacturing companies have either fizzled out of the market or have temporarily halted production (Atoyebi et al., Citation2014). All these indicate a lack of sustainability and could be due to poor performance in some relevant financial sustainability indicators, some of which form part of this study.
Existing literature in accounting and finance have reported the information content of accounting figures and their usefulness in explaining and predicting business phenomena (Watts & Zimmerman, Citation1990). Investors are constantly seeking a single index or ratio from financial statements of companies that can tell them at once the financial performance and going concern status of the business to avoid taking risky investment decisions. Bartlett and Chandler (Citation1997) identified in their study in the US that despite their lack of financial knowledge, 84% of the shareholders interviewed said that they make their financial decisions themselves. Several investors have ignorantly invested in some manufacturing companies judging solely from short-term profitability and got their fingers burnt on the event of untimely death of those companies. Potential investors and other stakeholders need to be informed of the financial health of companies before making investment decisions and other commitments and thus need an easy way to evaluate companies’ financial health at a glance.
Financial sustainability has been substituted with several terms like financial health, long-term financial performance, financial longevity, etc. International studies identify several descriptions of financial sustainability. The concept of financial sustainability is often said to have an inverse relationship with financial risk and distress. The factors that favour financial sustainability often indirectly act as drivers of its opposite (Gardini & Grossi, Citation2018). However, other components of financial sustainability include; Long-term Returns and sustainable growth.
Each of the above measures have been used by some authors (Arora, Kumar, & Verma, Citation2018; Hur-Yagba, Okeji, & Ayuba, Citation2015; Okoye, Erin, Ado, & Areghan, Citation2017; Oyewale & Adewale, Citation2014; Zorn, Esteves, Baur, & Lips, Citation2018). However, none of these studies have looked at all measures simultaneously. Also, the factors that determine the above measures of financial sustainability are also almost inexhaustible. However, several studies (Altman, Citation1993; Maverick, Citation2016; Umobong, Citation2015; Yameen & Pervez, Citation2016; Zorn et al., Citation2018) have identified some quantitative factors, in form of ratios, which affect financial performance and sustainability which border around the 4 major categories of financial ratios and indices. They include profitability, efficiency, liquidity and solvency.
This study fills these existing gaps, in that it gives a more encompassing measure of financial sustainability by evaluating all three measures simultaneously, namely; long-term returns, which we represent with return on asset (ROA), sustainable growth, which we represent with sustainable growth rate (SGR), and financial distress, which we measure using the Altman Z-score (ATZ). Also, each of the financial sustainability measures were regressed against the four major categories of financial ratios while controlling for some other identifiable and unidentifiable firm-specific factors that may affect this relationship (firm size, stock market index, dividend policy). The study tries to answer the following research questions: Are Nigerian quoted manufacturing firms financially sustainable? Also, what kind of financial practices determine the financial sustainability of quoted manufacturing firms in Nigeria?
2. Literature review and hypotheses development
The Nigerian business environment is built on a capitalist philosophy that emphasises short-term profit-making and satisfying immediate demands. Financial sustainability, as a concept, requires that companies employ several financial control measures that maximize long-term performance and reduce financial risk. Financial sustainability is a necessary condition for any organisation to achieve its mission and vision from a going concern perspective (Adeyemi, Citation2011; Egboro, Citation2016). Here, we discuss the concepts used, the relationship between them as well as the theoretical framework that explains the relationship.
2.1. Financial sustainability
Sustainability is the capacity of an organization to maintain its status over a long period (Bowman, Citation2011). Abdelkarim (Citation2002) refers to financial sustainability as the capacity of a firm to develop and sustain a diverse resource base for a long period that would serve the interest of its customers with or without financial donations or assistance (i.e. without external financing). This definition applies more essentially to Not-for-profit organisations who survive majorly on donations and external financing. According to a study by PricewaterhouseCoopers (Citation2006), financial sustainability refers to the capacity of financial managers to control and monitor the expected financial benchmarks as well as financial risks over the long term. Meanwhile, Jones and Walker (Citation2007) describe financial distress as an inability to finance operations at previously existing levels. Some studies reduce financial sustainability to the ability of firms to repay their debt obligations on time (Carmeli, Citation2008; Lorig, Citation1941: Wang, Dennis, & Tu, Citation2007). However, the concept of financial sustainability is broader than just liquidity or short-term profit. It encompasses long-term returns, growth potential and ability to withstand financial distress. The financial sustainability of companies can be found in the answer to the following questions; is the company profitable? Is the company growing? Is the company operating at an acceptable financial risk level?
Put together, we can say that financial sustainability is the capacity of a firm to cover both its operational and financial obligations as well as mitigate financial risk while retaining sufficient part of earnings to finance expansion. Empirical studies on Nigerian manufacturing companies to date gives some result of financial and non-financial factors that influence financial performance and sustainability from a profitability perspective while ignoring the level of sustainable growth and financial distress (Aremu, Ekpo, & Mustapha, Citation2013; Enekwe, Okwo, & Ordu, Citation2013).
2.1.1. Long-term returns
Profitability of firms, in several studies, has been measured using net profit and return on equity (Chen, Cheok, & Rasiah, Citation2016; Costicã, Citation2014; Pradhan, Citation2003; Umobong, Citation2015). However, some other studies have suggested that these measures of profitability can be myopic and sometimes view profitability either from a short-term perspective (as in the case of net profit) or from the perspective of a single stakeholder (e.g. shareholders as in return on equity). The return on asset gives a more encompassing notion to profitability. This is because it relates profit before interest and tax (which encompasses both returns due to shareholders and interest due to creditors) to total asset (which encompasses both debt and equity finance used by the firm) (Okoye et al., Citation2017; Oyewale & Adewale, Citation2014).
Figure 1. Average return on assets of quoted Nigerian manufacturing companies
Return on asset has been used as a strategic measure of profitability in that it gives a holistic view of profit (Imhanzenobe, Citation2019; Okoye et al., Citation2017; Yameen & Pervez, Citation2016). Manufacturing industry return on asset for Nigeria has been below the 10% benchmark since 2015 (Figure ). Oyewale and Adewale (Citation2014), in their study on the financial sustainability of microfinance organisations in Nigeria, discovered low financial sustainability with regards to return on assets. Asaleye, Adama, and Ogunjobi (Citation2018) have suggested that financial dependence has caused this decline in financial sustainability in the financial sector to rub off on the manufacturing sector.
2.1.2. Sustainable growth
A company’s sustainability can be evaluated by its growth prospects. It is less probable for a growing company to have financial sustainability issues. The sustainable growth rate is a crucial measure that can gauge the success or failure of any business (Arora et al., Citation2018). The sustainable growth rate represents the percentage of return to equity holders that is retained and ploughed back into the business to finance its activities. It is a costless means of finance to the company (provided you can get the shareholders to cooperate). This growth rate is sustainable because it stems from equity capital, which is irredeemable. Sustainable growth rate is an important factor in measuring the financial independence of a company since it measures the fund available for self-financed growth. Sustainable growth rate has been prescribed and used in some studies as a measure of sustainable growth (Amouzesh, Moeinfar, & Mousavi, Citation2011; Arora et al., Citation2018; Fonseka, García Ramos, & Tian, Citation2012; Higgins, Citation1981; Platt, Platt, & Chen, Citation1995). The sustainable growth rate trend of Nigerian manufacturing companies can be found below (Figure ).
Figure 2. Average sustainable growth rate of quoted Nigerian manufacturing companies
2.1.3. Financial distress
Edward Altman developed the first model for predicting financial distress (Altman, Citation1968). His study was based on data from 66 public limited manufacturing companies, 50% of which were classified as bankrupt. Altman then went ahead to calculate about 22 of the common financial ratios for all the companies and then chose a subset of those ratios that could best differentiate a healthy firm and a bankrupt one. He concluded by proposing five crucial ratios and a model using these ratios to predicts the financial sustainability index for public manufacturing companies. This index has been commonly referred to as Altman Z-score.
Figure 3. Average Altman Z-score of quoted Nigerian manufacturing companies
This index expresses financial sustainability in absolute figures. A low Z-score represents a low financial sustainability and vice versa. The model measures financial distress in an indirect manner (i.e. the lower the Z-score, the higher the risk of bankruptcy). If the Z-Score is less than 3, potential investors ought to do critical due diligence before investing in such a firm. This model was arrived at from a combination of financial ratios combined with a regression coefficient and has been widely used to predict financial sustainability and as a guide to a financial turnaround for both financial and non-financial organisations with a reasonable level of accuracy (Altman, Iwanicz-Drozdowska, Laitinen, & Suvas, Citation2014). The Nigerian manufacturing industry has experienced an impressive Z-score between 2012 and 2013. However, the Z-score has been declining in subsequent years (Figure ). The Z-score index has been popularised by several studies (Altman, Citation2000; Altman & Hotchkiss, Citation2007; Altman et al., Citation2014; Hur-Yagba et al., Citation2015).
2.2. Managers’ financial practices
The accounting function has long evolved from mere activities that record and report financial transactions. Accountants are now responsible for some major financial decisions that can influence the financial performance and position of firms. Accountants evaluate, manage and interpret financial variables to achieve the overall financial goals of the company. In managing these financial variables, accountants and financial managers apply some financial practices to exert some level of control over the variables in the financial statements and reports. Managers’ financial practices refer to policies and strategies implemented by financial managers and professionals which cause actual changes in financial activities that affect short and long-term financial position and performance of companies. Some of these practices involve setting targets for costs and revenues in a way that maximizes earnings and have been commonly referred to as earnings management.
2.3. Managing profits through financial practices: earnings management
Earnings management involves the conscious effort of management to keep reported earning within a certain level by flexing its component factors. The way management achieves this may be ethical or unethical. Earnings management has been categorised into 2 kinds; accrual items-based earnings management and actual-based earnings management (Ghyasi, Citation2017). Several accounting standards established by the FASB and IFRS are based on fair value measurement and have left some disclosure requirements and measurements to managers’ discretion or suggested several options, thus making room for subjectivity in the implementation of standards.
The accrual items-based earnings management involves taking advantage of these aspects of accounting standards that are left to accountants’ judgement to postpone the recognition of losses and bring forward the recognition of income. This form of earnings management has been generally regarded as unethical as it involves misrepresentation of financial position and misleading financial statement users. Financial ratios have been deemed vulnerable to this practice. However, the increased degree of discretion in accounting standards has not led to any substantial reduction in the power of ratios to predict financial sustainability over time (Beaver, McNichols, & Rhie, Citation2005).
Actual earnings management, on the other hand, involves the control of earnings by implementing policies that involve actual changes in operational and financial activity level. This kind of earnings management has been encouraged by recent studies and deemed ethical, unlike the accrual items-based earnings management which takes advantage of loopholes in accounting standards (Dechow & Skinner, Citation2000; Healy & Wahlen, Citation1999; Roychowdhury, Citation2006).
Actual earnings management is encouraged because actual activities manipulation is followed by real financial performance results while accrual items-based earnings management is discouraged because it only leads to apparent results which will have consequences on the financial sustainability of the company (Cohen & Zarowin, Citation2010; Graham, Harvey, & Rajgopal, Citation2005).
Financial ratios are key indicators of the effects of these financial practices and earnings management efforts of companies’ managers. They indicated areas of best practice by identifying crucial financial variables that determine profitability and sustainability (Murthy & Sree, Citation2003). Accountants and financial managers make these decisions from time to time which leads to fluctuations in financial statement items and thus, their effect can be captured using relevant financial ratios.
2.4. Financial ratios as measures of financial practices
Just like a picture says a thousand words, combination of numbers can tell a story (Haskins, Citation2017). Ratio analysis is a management accounting tool that measures and evaluates the relationship between financial variables in the financial statements and management reports, with the aim of interpreting the various relationships and identify the strengths and weaknesses of the company (Umobong, Citation2015). Ratios are used for inter-company comparison as well as comparison with industry standards.
Emmanuel (Citation2015) related the concept of financial sustainability to the use of financial statements items and introduced some selected financial ratios to assess profitability, efficiency, liquidity and solvency. In this study, the interest lay in these four categories of ratios as proxies for managers’ financial practices.
Figure 4. Average of selected financial ratios for quoted Nigerian manufacturing companies
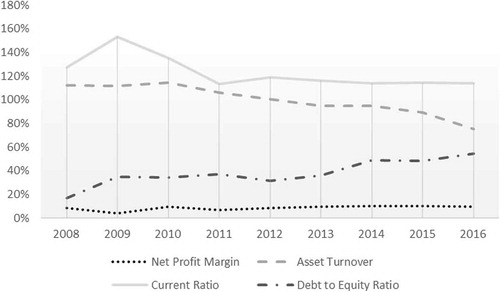
Financial ratios reflect the impact of earnings management efforts and other financial practices as these efforts are often reflected in changes in the financial variables that make up the ratios. For instance, a change in the policy on asset acquisition and usage, working hours and operating costs are bound to affect the efficiency ratios of the company. Changes in the credit terms and policies will likely affect the amount of cash available at hand or in the bank and so will influence the liquidity ratios. Changes in sources and method of long-term financing are bound to affect the capital mix and thus can be captured in the solvency ratios. There are key ratios that can capture each category of financial ratios, and thus, to avoid redundancy (multi collinearity), we used one ratio per category of ratios to represent the impact of managers’ financial practices (as shown in Figure 4). Now, we look at the major categories of financial ratios.
2.4.1. Short-term profitability ratio
Short term profits are profits that are strictly credited to the financial period in which they occur. The most common short-term profitability ratio is the net profit margin. The net profit margin ratio measures the net profit attributable to the company per unit of sale and differs from long-term profitability which relates profit to items that outlive one financial period (e.g. total assets, as in return on asset). Some studies have suggested a relationship between both concepts (Bank, Citation2018; Yameen & Pervez, Citation2016). One of the typical dilemmas that accountants and financial managers face is how to increase profits without significantly affecting a firm’s competitive advantage (Murphy, Citation2018). The net profit margin also reflects management’s cost efficiency since it is maximized when unit costs are well managed; however, it is more directly related to periodic profitability than to efficiency. The impact of managements’ policies on price and short-term costs can be captured using this ratio.
2.4.2. Efficiency ratio
Drucker emphasizes that efficiency is more concerned with how profit is achieved than how much profit is achieved (Drucker, Citation1963). Efficiency dictates that “you do more of what is good, and less of what is bad”. Efficiency ratios are sometimes called turnover or activity ratios. A major indicator of management efficiency is in the utilization of its assets (Bodie, Kane, & Marcus, Citation2013). This is adequately captured in the asset turnover ratio. This ratio measures the percentage of revenue generated from each naira of assets. The asset turnover gives a more encompassing measure of efficiency than other short-term efficiency measures (e.g. operating expense ratio). Eskandari (Citation2007) affirmed that firms’ overall efficiency and financial performance are closely related. The ratio tests the productivity of capital investment expenditure by measuring the capacity actualization of the company in terms of the level of productivity in relation to asset usage. According to a study by Zhu (Citation2000), only about 3% of the manufacturing companies in the fortune 500 companies were operating up to their attainable asset utilization standard.
2.4.3. Liquidity ratio
Liquidity is the capacity to redeem its immediate obligations in time. The liquidity of a company can be captured by the current ratio. It expresses the amount of naira in assets that can be converted to cash within a financial period to enable a company to settle its short-term creditors during the year. The most generally accepted standards for this ratio are 1.5:1 or 2:l. Wang et al. (Citation2007) suggested liquidity as a determinant of the financial health of firms. Managers establish credit and cash management policies that control the level of liquidity so as to maintain an adequate level of cash to avoid credit risk and for other precautionary reasons.
2.4.4. Solvency ratio
A company’s operating conditions can be affected by the configuration of the financial structure. Each method of asset financing has its benefits and drawbacks. Debt has the benefit that its costs (interest) are tax deductibility but has the disadvantage of higher risk to the firm. Likewise, equity has the advantage of lower risk to the firm (since it is irredeemable) but its costs (dividend) are not tax deductible. Given the crossroads between using more debt or equity, an optimal point that allows for the sustainable development of the company must be found (Costicã, Citation2014). The company’s financial structure is usually a function of negotiation between management and shareholders who arrive at conclusions after considering the costs, feasibility and other alternatives. A Company’s financial mix is reflected in the debt to equity ratio.
2.5. Managers’ financial practices and financial sustainability: hypotheses development
Managers make decisions regularly which cause changes in financial variables and so, may positively or negatively affect financial sustainability. Given the dichotomy of the relationship, there is need for further investigation.
The net profit margin is subject to factors like selling prices, operating costs, marketing strategy and storage quality. If costs are stable, changes in selling prices will directly affect this ratio. Often, increases in price need to be justified by increases in quality which come at a cost. Effective marketing strategy may lead to an increase in the volume of sales but may not affect unit profits in the short run since selling price is relatively stable. However, this may change in the long run when the firm manages to capture a confident percentage of the market share and instil brand patronage since then it may be able to increase prices without losing customers. The quality of storage facilities is also important, especially for manufacturers of perishable goods since condemned inventory will yield little or no profit upon sale. A trade-off between price sensitivity and cost sensitivity as measured in the net profit margin ratio could lead to fluctuations in profitability prospects. Thus, this study seeks to provide an answer to the question: Could there be a relationship between net profit margin and financial sustainability?
H1: There is no relationship between net profit margin and financial sustainability
Efficiency surpasses merely acquiring raw materials and overhead at the lowest costs, which may sometimes have harmful effect on quality. It is the ability of a firm to provide the greatest service within a certain resource constrain. Poor capital budgeting decision (e.g. unsuitable purchase, incompatibility of software with computer systems, inadequate machinery), abnormal losses and idle time can all lead to reductions in turnover. Some of these errors may even require additional expense to correct on an annual basis. These avoidable costs can reduce a firm’s financial sustainability. Asset capacity utilisation (proxied with asset turnover ratio) may affect revenue for current and subsequent periods, thus leading us to ask: Could there be a relationship between asset turnover and financial sustainability?
H2: There is no relationship between asset turnover and financial sustainability
Liquidity ought to be controlled to prevent companies from incurring legal costs and losing creditors’ trust. During inflationary periods, where the purchasing power of money is slowly declining, many manufacturing companies are faced with the challenge of unredeemed credit sales and do not have enough cash to redeem their short-term bills. As a result, they are forced to employ strict credit terms which may reduce market share. It is important for manufacturing companies to manage their liquidity and maintain balanced credit terms. The current ratio is a major variable that investors tend to consider before investing. A high ratio gives the impression of financial stability. To test this notion, we ask the question: Could there be a relationship between current ratio and financial sustainability?
H3: There is no relationship between current ratio and financial sustainability
Capital expenditure financed by debt may help to improve the sustainability of assets but if not profitable and properly executed, may lead to financial distress. High interest on borrowings could also reduce profitability while low interest rates could save profit and improve capital replenishment and thus financial sustainability. The level of debt in the capital structure gives an idea of the financial dependence of the company, a concept which is opposed to financial sustainability. The question on the correlation between solvency and financial sustainability leads us to ask: Is there a relationship between debt to equity ratio and financial sustainability?
H4: There is no relationship between debt to equity ratio and financial sustainability
According to some studies (Babalola, Citation2013; Chen, Parsley, & Yang, Citation2010; Wällstedt, Grossi, & Almqvist, Citation2014), some firm-specific characteristics also play an intermediating role in determining financial performance and sustainability. Firm size, stock market index and dividend policy were included to control for firm-specific factors. Firm size was included because it may determine the extent to which managers’ efforts have substantial effects. The stock market index is important because Nigeria operates a stock market-based capitalism and the study focuses on quoted manufacturing firms. Dividend policy may also influence financial sustainability as it may affect the profit retained for expansion of the business.
Figure 5. Conceptual model of the impact of managers’ financial practices on financial sustainability
There are a few theories that explain the factors that influence financial performance and sustainability as well as how these factors affect it. One of these theories is Walker’s theory of profit which attributes the changes in profit and financial sustainability position in manufacturing firms to the difference in managers’ abilities. The impact of managers’ financial abilities and practices can be captured using ratios. According to Asaleye et al. (Citation2018), identifying the ratios that matter most will promote financial sustainability of manufacturing firms which in turn will promote employment and economic growth on a nation-wide scale. Studies like Bloom et al. (Citation2018) and Syversson (Citation2011) have suggested Walker’s theory as a theory that describes the effect of managers’ ability and practices on profitability and financial sustainability of manufacturing companies.
2.6. Walker’s theory of profit
Walker’s theory of profit, proposed by Francis Walker (Walker, Citation1887), is sometimes referred to as the Rent Theory of Profit. According to Walker, profit hinges on the capacity of managers to operate in the simplest way. This will involve avoiding all avoidable wastage of inputs, improving product quality, paying bills and redeeming debts on time and securing cheap and adequate sources of finance while satisfying customer requests (Syversson, Citation2011). The theory rests on the premise that if average firms tend to earn average return and profitability in the long term, then more efficient and financially stable firms will likely earn above the normal returns and profits in the long-run (Dutta, Citation2015). According to Teece (Citation2017), the theory sees profit as the marginal gains that result from the improvement in the financial ability of one company over that of others. This theory recognizes that the financial practices of some managers are more effective than those of others. These financial practices consist of measures put in place; to manage productivity of operations, to manage capital structure, to manage financial risk and to successfully meet the needs of consumers at an optimum profit. Managers with average financial ability are rewarded with an average rate of return while managers with higher financial ability are compensated with above-average profits (Shaikh, Citation2014). This theory simply attributes marginal profit to the improvement in the effectiveness of financial practices of one firm over another, while low profitability and financial sustainability signals that the firm is being run inefficiently and in a risky manner. For manufacturing companies, this could be due to loss of market share (e.g. due to poor marketing power or availability of several competitive substitute product), poor asset and inventory management, cost inefficiency, lack of adequate financial resources and capital structure, etc.
The theory views managers’ financial ability as a kind of firm-specific advantage. According to Makadok (Citation2011) and Brandenburger and Stuart (Citation1996), this theory shares some similarity with other theories of profit that are based on firm-specific advantages and suggests that profitability of manufacturing companies vary to the extent that their financial and operational processes create economic value. This difference in business processes occurs in the form of efficiency in cost and material usage, increase in total asset turnover, improved profit margin without damage to product quality, reduction in the cash conversion cycle duration and efficient capital mix (Gill, Singh, Mathur, & Mand, Citation2014; Owolabi & Obida, Citation2012). These are all signs of superior financial ability and practice of one company’s management over those of other companies. These key differences can be captured under the key categories of financial ratios (Profit, efficiency, liquidity and solvency).
In this study, the accuracy of this theory was evaluated by relating the impact of managers’ financial practices of Nigerian manufacturing companies on financial sustainability and identifying which of the key ratios have substantial correlations with the selected financial sustainability measures.
2.7. Previous empirical studies
Several studies have evaluated financial sustainability using several measures both quantitative and qualitative. Most of the studies on financial distress also apply indirectly to financial sustainability (Wällstedt et al., Citation2014). Some of the studies that have considered the impact of profits, efficiency, liquidity and solvency ratios on financial performance and sustainability have found all these variables to be significant.
Zorn et al. (Citation2018) did a study on financial ratios as indicators of financial sustainability of Swiss Dairy Farms. They related financial sustainability with profitability, liquidity, financial efficiency, and solvency and in two different models so as to reflect the differences between European and North American practices. In the European model, profitability, liquidity and solvency were the major variables while Profitability, liquidity, efficiency and solvency were the variables for the North America model. They identified 17 frequently used financial ratios. Five profitability ratios, four liquidity ratios and four financial efficiency ratios were used. Four solvency ratios were used which comprised three stability ratios and one repayment capacity ratio. Also, the high correlation between the general sustainability indicator and the regional sets of indicators indicates that both indicators can be used to estimate the financial sustainability for Swiss dairy farms. Using descriptive statistic, correlation matrix and Spearman’s rank method, they discovered that correlation coefficients among the selected financial ratios were significant and mostly positive. These results are similar to those of Hur-Yagba et al. (Citation2015) who evaluated the financial health and sustainability of wind electricity sectors in the Baltic States and of manufacturing companies in Nigeria, respectively. They further suggested that companies should inculcate liquidity, solvency, efficiency and profitability management policies as a part of their corporate management policy framework and that the Altman model for financial distress should be used by manufacturing companies to help them predict declining financial sustainability before it occurs.
Some other studies have also suggested only some of the variables in this study to be significant. Arora et al. (Citation2018) carried out a study on the anatomy of the financial sustainability of Indian manufacturing companies using sustainable growth rate. Using panel data regression, they regressed sustainable growth rate against net profit margin, asset turnover and financial leverage along with some industry-specific factors. They discovered that net profit margin was a positive and significant determinant of financial sustainability of manufacturing companies in India. This result goes against that of Umobong (Citation2015), who discovered net profit margin to be insignificant in determining the financial sustainability of Pharmaceutical companies in Nigeria. The other variables of this study were also found to be significant in the study by Yameen and Pervez (Citation2016), who did a study on the impact of liquidity, solvency and efficiency on the financial sustainability of steel authority of India limited. One of the measures of sustainability was return on assets which was also used in this study. They measured liquidity with current ratio, solvency with debt to equity ratio and efficiency with inventory turnover and found all three variables to be significant determinants of return on assets.
Tian and Yu (Citation2017) did an international study on financial ratios as predictors of financial sustainability from the perspective of bankruptcy using the Altman Z-score. They selected a parsimonious set of default predictor variables which represented profitability, liquidity and solvency ratios for Asian and European markets using panel data. They concluded that three predictor variables (Retained Earning/Total Asset, Current Liability/Sales and Total Debt/Total Asset) are accurate predictors of bankruptcy for Asian markets (Japan), while the Equity/Total Liability ratio was selected as the major predictor of the Altman’s Z-score for European markets (UK, Germany and France). Liang, Lu, Tsai, and Shih (Citation2016), in their study, investigated the impact of financial ratios and corporate governance indicators on bankruptcy prediction. They used data from for 95 financial ratios and 95 corporate governance indicators for each of 239 bankrupt and 239 non-bankrupt Taiwan companies for 1999 to 2009. All 95 calculated financial ratios and 95 corporate governance indicators observed were categorised into seven different categories of financial ratios and five different categories of corporate governance indicators, respectively, using discriminate analysis. They discovered that financial ratios alone tend to perform better as predictors of bankruptcy than corporate governance variables alone. However, the prediction performance obtained by combining both was found to give better results. The results showed that the solvency and profitability ratios combined with board structure and ownership structure indicators provide the best combination for bankruptcy prediction.
Given the mixed results in previous empirical studies, this study attempts to fill the gap by clarifying the relationship between the different financial practices of managers (as captured in the financial ratios) and the different financial sustainability dimensions using the Nigerian manufacturing sector as a case study.
3. Materials and methods
This section gives a sketch for the data presentation and analysis in terms of model specification, description of variables, population of study, method of sampling and data collection and method of data analysis and apriori expectations. This, in turn, will inform the conclusions drawn.
3.1. Model specification
This study aims at evaluating financial sustainability and the impact of profitability, efficiency, liquidity and solvency on the three financial sustainability indicators suggested in this study, namely; Return on Asset, sustainable growth rate and Altman Z-score. The major/focal independent variables were represented with net profit margin, asset turnover, current ratio and debt to equity ratio. These ratios were selected to represent each of the categories of financial ratios, respectively, to avoid the danger of multicollinearity. The measurement of the variables can be seen in Table .
Control variables were also added to the models because previous studies have suggested them as significant determinants of financial performance and sustainability (Ali & Yousaf, Citation2013; Ferreira & Vilela, Citation2004). Other firm-specific effects were captured using the Fixed and Random effect model.
Therefore, the respective Ordinary Least Square regression equations are as follows:
3.2. Population, sampling and data collection
This study was done using secondary panel data obtained from the Bloomberg portal for sample companies. There were 51 manufacturing companies quoted on the Nigerian Stock Exchange as at the date of data collection. A sample of 17 was selected on the basis of availability of the relevant financial statement information for the financial periods of interest. According to Bhagat and Jefferis (Citation2005), accounting measures tend to be suitable for long-term research. Although managers may have the power to manipulate figures in the financial statements for a few years; however, their power to do the same for several future periods is quite limited. This is because differences in accounting estimates, which are subject to managers’ discretion and accrual concept, tend to even out in the long-run. The data were collected for a long time-range (2008 to 2016 financial periods, i.e. 9 years) so as to reflect actual earnings management efforts as opposed to accrual items-based earnings management efforts which may be constituted in short-term data.
4. Result of analysis
The descriptive statistics were extracted for all the variables to show the sample distribution characteristics. Correlation matrix was also used to show basic correlation within each of the models. The correlation matrix, supported by the Variance Inflation Factor test (VIF), was also used to check for multicollinearity as suggested by Linares-Mustaros, Coenders, and Vives-Mestres (Citation2018). The ordinary least square (along with a Hausman test for fixed or random effect) was used as the primary test of the hypotheses. A cross-sectional dependency test was also carried out on each model to ensure the independence of companies from one another.
4.1. Sample distribution characteristics
4.2. Correlation matrix
Table shows a high correlation coefficient between ROA and ATZ of about 88% (Upper non-bolded area), which further explains the fact that return on asset measures profitability from a more encompassing view and both models measure financial sustainability from a long-term perspective. The lower non-bolded area shows the basic correlation coefficients between the dependent and independent variables. The table also reveals an absence of multicollinearity (bolded area) as the correlation coefficients of the independent variables are less than 70% (0.7). To support the absence of multicollinearity, a Variance Inflation Factor test (VIF) was carried out.
Table 1. Representation and measurement of variables
Table 2. Descriptive statistics of all variables descriptive statistics table
Table 3. Correlation matrix of all variables
4.3. Multicollinearity test
The results of the VIF further confirm the absence of multicollinearity with moderate centered VIF statistics (i.e. VIF < 5). Although firm size showed an uncentered VIF statistic of about 153 (Table ) but that can be ignored since it is a control variable (intermediating variable).
Table 4. Variance inflation factor test for multicollinearity
The fixed and random effect models are a more accurate form of the ordinary least square method because they recognise firm-specific factors (effects) that are permanent or temporal (Gujarati, Citation2004). These methods are preferred because they allow for evaluating relationships in a dynamic environment and controlling for other determinants of financial sustainability. They do not ignore the unit effect of the entities. The omission of these individual factors (both cross-sectional and period effects) from a panel regression model can lead to omitted variable bias and this can be detected using the Omitted random effect test. Further tests (Hausman test) can then be done to determine whether this unit effect(s) (if any) are correlated with regressors or uncorrelated with regressors and thus, will guide us as to whether to use the fixed effect model or random effect model, respectively.
4.4. Fixed/Random effect test for panel data
Following the suggestions of Torres-Reyna (Citation2007), the pooled regression results were tested for unit effects (both cross-sectional and period) to detect omitted variable bias. The Omitted random effect test was done using the Breusch–Pagan Lagrange Multiplier test and supported with the Honda test. The Breusch–Pagan test helps to decide between a simple OLS model and a random effects model. The null hypothesis of this test is that variance across entities (cross-section and time) is zero (i.e. no panel effect). All three tests show that there is panel effect across cross-sections but none across time period with significant p-values (p < 5%) for cross section effect and insignificant p-values for time effects (p > 5%) for all three models (ROA, SGR and ATZ models) (see Table ). This indicates that we will need to apply either Random effect or fixed effect model that takes care of cross sections effect (not for time effects).
Table 5. Omitted random effect test for RO, SGR & ATZ models
4.5. Hausman test on OLS regression results
After considering the possibility of cross-sectional effects, we went further to use the Hausman test to decide as to which of fixed and random effect model will be more appropriate to handle the cross-sectional effects. The Hausman test was conducted on all three models. The null hypothesis is that the random effect model is the preferred model while the alternative hypothesis suggests that the fixed effects model is more adequate (Greene, Citation2008). The details of each method and model along with the Hausman chi-square statistic are shown in Tables – below.
Table 6. Hausman test along with panel OLS, REM & FEM results for ROA model
Table 7. Hausman test along with panel OLS, REM & FEM results for SGR model
Table 8. Hausman test along with panel OLS, REM & FEM results for ATZ model
ROA had a mean value of 12.16%. The Hausman test for the ROA model reported a low Chi-Square statistic of 12.03 and p-value of 0.0996 which was insufficient to reject the null hypothesis of random effect model (since p > 0.05). Thus, we use the random effect model. The model’s explanatory power (R2) and significance (F-stat) were about 84.61% and 81.66 (with p < 0.01) respectively. Net Profit margin and Asset turnover were the only significant focal variables in the random effect model with p-values <0.01.
SGR had a mean value of 11.59%. This suggests that, on the average, about 11.59% of return on equity shares of quoted Nigerian manufacturing companies are retained and ploughed back into the business for possible expansion which is a substantial amount, considering that Nigerian investors tend to be risk-averse. The Hausman test for the SGR model reported a Chi-Square statistic of about 13.989562 and a p-value of 0.0514 (p > 0.05). This suggests that the null hypothesis should not be rejected; thus, we go with the random effect model. The model’s explanatory power (R2) and significance (F-stat) were about 60.45% and 22.26714 (with p < 0.01) respectively. Short-term profitability ratio (Net Profit margin), efficiency ratio (asset turnover) were again found to be the significant focal variables in this model with p-values <0.05.
ATZ had a mean value of 4.55. The Hausman test for the ROA model reported a low Chi-Square statistic of 2.749097 and p-value of 0.9072 (p > 0.05) which was not sufficient to reject the null hypothesis. Thus, again, we use the random effect model. The model’s explanatory power (R2) and significance (F-stat) were about 90.54% and 105.2473 (p < 0.01) respectively. All four focal independent variables were found to be significant in this model with p-values <0.05.
4.6. Cross-sectional dependence test
The Pearson cross-sectional dependence test was conducted on the three accepted random effect models to investigate whether the variables for each firm in the sample were dependent on those of other firms in the sample. Cross-sectional dependence can cause contemporaneous correlation, thus, making results bias. The test statistics were quite low with p-values of 0.5225, 0.9539 and 0.2128 for the ROA, SGR and ATZ models, respectively (Table ). This suggests that the variables of each sample company are unique and independent from those of other companies in the sample.
Table 9. Cross-sectional dependence test for panel data for ROA, SGR & ATZ random effect model
5. Discussion
Sustainable Growth Rate had a mean value of 11.59% (Table ), suggesting that on the average, about 11.59% of return on equity shares of quoted Nigerian manufacturing companies are retained and ploughed back into the business for possible expansion. This is a substantial amount considering that Nigerian investors tend to be risk-averse. The mean values of return on assets and Altman Z-score (12.16% & 4.55) suggest that the average performance of quoted Nigerian manufacturing companies is relatively good compared with the industry benchmark of 10% and 3, respectively. However, this may be due to high performance in previous periods that the study investigates as can be noticed from Figures and . The graph of average return on assets and Altman’s Z-score can be seen to be experiencing a continuous decline in more current years, thus showing a decline in financial sustainability as at the end of 2016. This suggests that there is currently a decline in financial sustainability of Nigerian quoted manufacturing companies. Although the average values across the period range are satisfactory, there is room for improvement as there are still companies with returns on assets as low as −37.9% and Altman Z-score as low as −3.3.
The walkers’ theory of profit suggests that manager’s abilities and practices which are reflected in different financial ratios are the drivers of financial performance and sustainability. A useful outcome of the result of this study may be a shift in focus on the determinants of financial sustainability that have not just significant impact but also consistency across all models. The applicability and consistency of the theory in the Nigerian context across several measures of financial sustainability was tested by relating the selected ratios with return on assets, sustainable growth rate and Altman Z-score. The results obtained revealed the categories of financial management policies and practices that have the most significant and consistent impact on financial sustainability.
All the selected categories of financial ratios were significant determinants of at least one of the examined measures of financial sustainability (the Altman Z-score model) thus confirming the findings of Zorn et al. (Citation2018), Yameen and Pervez (Citation2016) and Hur-Yagba et al. (Citation2015). However, not all the selected ratios were consistent. Short-term profitability ratio (measured with net profit margin) and efficiency ratio (measured with asset turnover) were the only consistent influencers of financial sustainability across all models. This result aligns with those of Arora et al. (Citation2018) and Liang et al. (Citation2016). The result also goes against that of Umobong (Citation2015).
Periodic profitability may not be a proper measure of financial sustainability but is a major factor that determines it. Net profit optimization is key to achieving financial sustainability. Data showed that some companies had net profit margin of less than −100% (Table ). This indicates that some companies incur total expenses that are twice their sales turnover. This requires companies to operate strict control over periodic expenses.
Efficiency is also a major factor to be managed as it was also a consistent determinant across all the models. Asset quality should be standard and non-negotiable even though this may come at extra costs. This is because a poor choice of assets has a negative long-run effect on profit and financial sustainability. Also, malfunctioning assets increase idle time which affects productivity.
Managers’ financial practices need to be geared towards improving profitability and efficiency. This will involve establishing financial policies that address costs and productivity while also maximizing marketing efforts. This will improve the profit margin for each financial period as well as the volume of activity across financial periods. This will improve the long-run profitability and provide fund for independent sustainable growth as well as reducing the financial risk (bankruptcy). Where financial practices ignore profitability and efficiency, all other financial management efforts are nullified.
6. Conclusion
Currently, the Nigerian manufacturing sector has been experiencing a steady decline in financial sustainability indicators. This could be addressed if the companies are more conscious of their financial sustainability and employed measures that help them increase long-term profitability and reduce financial distress while retaining earnings to finance capital expenditure.
Policies that optimize periodic profits tend to increase financial stability of the company as it moves into the proceeding financial period. Efficiency measures help to stimulate current and future profits by maximizing revenue with limited resources. Sound liquidity and solvency policies promote financial independence in the short and long term, respectively. Although among all these, financial management policies and practices that are geared towards controlling periodic profits as well as efficiency is of prior importance.
Avoidable expenses and wastages should be avoided as much as possible, provided that they don’t reduce product quality and customer satisfaction. If the cost control reduces product quality or customer satisfaction, revenue will fall simultaneously with costs, thus nullifying the effect on profits (especially for price-elastic products).
Energy constitutes a major portion of operating expenses of most manufacturing companies in Nigeria and so requires strict control as well as exploration for alternative means (Imhanzenobe, Citation2019). Management should consider cheaper energy sources (e.g. biofuel power generators and solar panels).
Many manufacturing companies in Nigeria are highly capital intensive. However, fear of incurring huge asset acquisition costs lead firms to patronise fairly used assets whose lifespans are close to termination. This is against the notion of financial sustainability as it only considers short-term performance. Proper assets acquisition, maintenance and replacement may involve huge costs in current periods but will save future repair costs, reduce bottlenecks and idle time and increase productivity which will increase revenue.
Also, appropriate training and motivation should be given to the employees as this will help to improve the learning curve. The proficiency level of employees will improve in a shorter time and this will help them to achieve targets more easily.
Information from this study can be useful to the different stakeholders who are interested in the performance and long-term survival of the business (shareholders, potential investors, management, creditors, suppliers and vendors, government, etc.). This study will enable investors to do a broader evaluation of the financial sustainability of manufacturing firms to avoid making risky or harmful investment decisions. Creditors and vendors will be able to structure their credit terms better since they will be able to measure clients’ financial position and prospects with more accuracy. Shareholders can have a broader picture of the company’s health and thus have an idea of the sustainability of their source of income (dividend). Managers can now have better information about key variables to focus on and to manage the financial performance and sustainability of the firm. Finally, the study can also be helpful to researchers in that it adds to the existing literature on financial sustainability and the correlation between the discussed financial ratios and sustainability, thus filling the existing knowledge gap. Although this study focuses on managers’ financial practices and financial sustainability strictly from a quantitative perspective. Further studies can be done that looks at some qualitative measures of financial practices as well as financial sustainability.
Acknowledgements
I want to thank the Management of the Pan-Atlantic University for granting me access to the Bloomberg data portal and my colleagues for their helpful comments to earlier versions of this manuscript.
Additional information
Funding
Notes on contributors

Japhet Osazefua Imhanzenobe
Japhet Osazefua Imhanzenobe is an expert in accounting and finance. He is a member of faculty at the Pan-Atlantic University, where he lectures in the Accounting department of the School of Management and Social Sciences. He is a member of the Institute of Chartered Accountants of Nigeria and an alumnus of the Venture in Management Programme at the Lagos Business School. He teaches financial accounting, accounting laboratory, financial analytics and the use of the Infoware and Bloomberg market data terminals. His research areas include financial sustainability, financial market efficiency, management accounting and accounting information systems. He is currently carrying out research on factors and aspects of business practices that have a causal effect or at least predictive power on the financial sustainability and longevity of businesses.
Related Research Data
References
- Abdelkarim, N. (2002). The long-term financial sustainability of the Palestinian NGO sector: An assessment. Study Commissioned by the Welfare Association Consortium. Retrieved from https://www.icnl.org/wp-content/uploads/Palestine_financialsustainability.pdf
- Adeyemi, B. (2011). Bank failure in Nigeria: A consequence of capital inadequacy, lack of transparency and non-performing loans? Banks and Bank Systems, 6, 1.
- Ali, A., & Yousaf, S. (2013). Determinants of cash holding in german market. IOSR Journal of Business and Management, 12(16), 28–23. doi:10.9790/487X-1262834
- Alli, F. (2012). How to achieve 10% real sector contribution to GDP by 2015 – Stakeholders. Retrieved from https://www.vanguardngr.com/2012/07/how-to-achieve-10-real-sector-contribution-to-gdp-by-2015-stakeholders/
- Altman, E. I. (1968). Financial ratios discriminate analysis and the prediction of corporate bankruptcy. Journal of Finance, 23(4), 589–609.
- Altman, E. I. (1993). Corporate financial distress and bankruptcy (2nd ed.). New York: John Wiley & Sons.
- Altman, E. I. (2000). Predicting financial distress of companies: Revisiting the Z-score and ZETA® models. In Handbook of research methods and applications in empirical finance. NYU Stern School of Business. (pp. 428–456). ( September 1968). doi:10.4337/9780857936097.00027
- Altman, E. I., & Hotchkiss, E. (2007). Corporate financial distress and bankruptcy. doi:10.1002/9781118267806
- Altman, E. I., Iwanicz-Drozdowska, M., Laitinen, E. K., & Suvas, A. (2014). Distressed firm and bankruptcy prediction in an international context: A review and empirical analysis of Altman’s Z-score model. SSRN Electronic Journal. doi:10.2139/ssrn.2536340
- Amouzesh, N., Moeinfar, Z., & Mousavi, Z. (2011). Sustainable growth rate and firm performance: Evidence from Iran stock exchange. International Journal of Business and Social Science, 2, 23.
- Aremu, M. A., Ekpo, I. C., & Mustapha, A. M. (2013). Determinants of banks‟ profitability in a developing economy: Evidence from Nigerian banking industry. Interdisciplinary Journal of Contemporary Research in Business, 4(9), 155–181.
- Arora, L., Kumar, S., & Verma, P. (2018). The anatomy of sustainable growth rate of Indian manufacturing firms. Global Business Review, 19(4), 1050–1071. doi:10.1177/0972150918773002
- Asaleye, A. J., Adama, J. I., & Ogunjobi, J. O. (2018). Financial sector and manufacturing sector performance: Evidence from Nigeria. Investment Management and Financial Innovations, 15(3), 35–48. doi:10.21511/imfi.15(3).2018.03
- Atoyebi, K. O., Okafor, B. O., & Falana, A. O. (2014). The global financial meltdown and its effects on manufacturing sector : The Nigerian perspective. Journal of Economics and Sustainable Development, 5(6), 78–90.
- Babalola, Y. A. (2013). The effect of firm size on firms profitability in Nigeria. Journal of Economics and Sustainable Development, 4(5), 90–94. doi:10.5605/IEB.15.4
- Bank, E. (2018). Analysis of low profit margin and low return on assets. Small Business. Retrieved from http://smallbusiness.chron.com/analysis-low-profit-margin-low-return-assets-76557.html
- Bartlett, S. A., & Chandler, R. A. (1997). The corporate report and the private shareholder: Lee and tweedie twenty years on. The British Accounting Review, 29(3), 245–261.
- Beaver, W. H., McNichols, M. F., & Rhie, J. W. (2005). Have financial statements become less informative? Evidence from the ability of financial ratios to predict bankruptcy. Review of Accounting Studies, 10(1), 93–122. doi:10.1007/s11142-004-6341-9
- Bhagat, S., & Jefferis, R. H. (2005). The econometrics of corporate governance studies. Cambridge, Massachusetts: The MIT Press.
- Bloom, N., Brynjolfsson, E., Foster, L., Jarmin, R., Patnaik, M., SaportaEksten, I., & Van Reenen, J. (2018). What drives differences in management practices? American Economic Review, 2018, 1–27.
- Bodie, Z., Kane, A., & Marcus, A. J. (2013). Financial statement analysis, essentials of investments (9th ed., pp. 451–459). New York: McGraw-Hill/Irwin.
- Bowman, W. (2011). Financial capacity and sustainability of ordinary nonprofits. Nonprofit Management and Leadership, 22(1), 37–51. doi:10.1002/nml.v22.1
- Brandenburger, A. M., & Stuart, H. W. (1996). Value-based business strategy. Journal of Economics and Management Strategy, 5, 5–24. doi:10.1111/j.1430-9134.1996.00005.x
- Carmeli, A. (2008). The fiscal distress of local governments in Israel. Administration & Society, 39(8), 984–1007. doi:10.1177/0095399707309358
- Central Bank of Nigeria. (2008). Statistical bulletin (pp. 19). Garki, Abuja: Golden jubilee edition.
- Chen, H., Parsley, D. C., & Yang, Y. (2010). Corporate lobbying and financial performance. Journal of Business Finance & Accounting, 42, 41. doi:10.2139/ssrn.1014264
- Chen, Z., Cheok, C. K., & Rasiah, R. (2016). Corporate tax avoidance and performance: Evidence from China’s listed companies. Institutions and Economies, 8(3), 61–83.
- Cohen, D., & Zarowin, P. (2010). Accrual-based and real earnings management activities around seasoned equity offerings. Journal of Accounting and Economics, 8, 2–19. doi:10.1016/j.jacceco.2010.01.002
- Costicã, V. (2014). Financial sustainability of the company. Ovidius University Annals, Economic Sciences Series, Ovidius University of Constantza, Faculty of Economic Sciences, 14(1), 775–779.
- Dechow, P., & Skinner, D. (2000). Earnings management: Reconciling the views of accounting academics, practitioners and regulators. Accounting Horizons, 12, 235–250. doi:10.2308/acch.2000.14.2.235
- Drucker, P. F. (1963). Managing for business effectiveness. Harvard Business Review, 41, 53–60.
- Dutta, N. (2015). Top 5 theories of profit explained. Retrieved from http://www.economicsdiscussion.net/profit/top-5-theories-of-profit-explained/6101
- Egboro, E. M. (2016). The 2008/2009 banking crisis in Nigeria: The hidden trigger of the financial crash. British Journal of Economics, Management & Trade, 12(2), 1–16. doi:10.9734/BJEMT
- Emmanuel, J. F. (2015). Financial sustainability for nonprofit organizations. New York: Springer publishing company.
- Enekwe, C. I., Okwo, I. M., & Ordu, M. M. (2013). Financial ratio analysis as a determinant of profitability in Nigerian pharmaceutical industry. International Journal of Business and Management, 8(8), 107–117.
- Eskandari, J. (2007). Accounting principles. Iran: Tehran Sazman Publishers.
- Ferreira, M. A., & Vilela, A. S. (2004). Why do firms hold cash? Evidence from EMU countries. European Financial Management, 10(2), 295–319. doi:10.1111/eufm.2004.10.issue-2
- Fonseka, M. M., García Ramos, C., & Tian, G. L. (2012). The most appropriate sustainable growth rate model for managers and researchers. Journal of Applied Business Research, 28(3), 481. doi:10.19030/jabr.v28i3.6963
- Gardini, S., & Grossi, G. (2018). What is known and what should be known about factors affecting financial sustainability in the public sector: A literature review. In M. Rodríguez Bolívar & M. López Subires (Eds.), Financial sustainability and intergenerational equity in local governments (pp. 179–205). Hershey, PA: IGI Global. doi:10.4018/978-1-5225-3713-7.ch008
- Ghyasi, A. (2017). An investigation of the relationship between earnings management and financial ratios (Panel data approach). International Journal of Economics and Financial Issues, 7(1), 608–612.
- Gill, A., Singh, M., Mathur, N., & Mand, H. S. (2014). The impact of operational efficiency on the future performance of Indian manufacturing firms. International Journal of Economics and Finance, 6(10), 259–269. doi:10.5539/ijef.v6n10p259
- Graham, J., Harvey, C., & Rajgopal, S. (2005). The economic implications of corporate financial reporting. Journal of Accounting and Economics, 12, 3–73. doi:10.1016/j.jacceco.2005.01.002
- Greene, W. H. (2008). Econometric analysis (6th ed.). Upper Saddle River, NJ: Prentice Hall.
- Gujarati, D. (2004). Basic econometrics. New York City: United States Military Academy, West Point: Tata McGraw-Hill.
- Haskins, M. E. (2017). Ratios tell a story—2011. Darden Business Publishing Cases, 1–4. doi:10.1108/case.darden.2016.000253
- Healy, M. P., & Wahlen, J. M. (1999). A review of the earnings management literature and its implications for standard setting. Accounting Horizons, 13(4), 111–119. doi:10.2308/acch.1999.13.4.365
- Higgins, R. C. (1981). Sustainable growth under inflation. Financial Management, 10, 36–40. doi:10.2307/3665217
- Hur-Yagba, A. A., Okeji, I. F., & Ayuba, B. (2015). Analyzing financial health of manufacturing companies in Nigeria using multiple discriminate analysis. International Journal of Managerial Studies and Research, 3(7), 72–81.
- Imhanzenobe, J. O. (2019). Operational efficiency and financial sustainability of listed manufacturing companies in Nigeria. Journal of Accounting and Taxation, 11(1), 17–31. doi:10.5897/JAT2018.0329
- Jones, S., & Walker, R. G. (2007). Explanators of local distress. Government Abacus, 43(3), 396–418. doi:10.1111/j.1467-6281.2007.00238.x
- Liang, D., Lu, C. C., Tsai, C. F., & Shih, G. A. (2016). Financial ratios and corporate governance indicators in bankruptcy prediction: A comprehensive study. European Journal of Operational Research, 252(2), 561–572. doi:10.1016/j.ejor.2016.01.012
- Linares-Mustaros, S., Coenders, G., & Vives-Mestres, M. (2018). Financial performance and distress profiles: From classification according to financial ratios to compositional classification. Advances in Accounting, 40, 1–10. doi:10.1016/j.adiac.2017.10.003
- Lorig, A. N. (1941). Determining the current financial position of a city. The Accounting Review, 16(1), 41–49.
- Makadok, R. (2011). The four theories of profit and their joint effects. Journal of Management, 37(5), 1316–1334. doi:10.1177/0149206310385697
- Maverick, J. B. (2016). What is the best measure of a company’s financial health? Retrieved from https://www.investopedia.com/articles/investing/061916/what-best-measure-companys-financial-health.asp
- Murphy, C. B. (2018). What are the differences between operating expenses and overhead expenses? Retrieved from https://www.investopedia.com/ask/answers/101314/what-are-differences-between-operating-expenses-and-cost-goods-sold-cogs.asp
- Murthy, Y., & Sree, R. (2003). A study on financial ratios of major commercial banks. Research Studies, College of Banking & Financial Studies, Sultanate of Oman, 3(2), 490–505.
- Okoye, L. U., Erin, O. A., Ado, A., & Areghan, I. (2017). Corporate governance and financial sustainability of microfinance institutions in Nigeria. 29th IBIMA conference, Vienna, Austria.
- Owolabi, S. A., & Obida, S. S. (2012). Liquidity management and corporate profitability: Case study of selected manufacturing companies listed on the Nigerian stock exchange. Business Management Dynamics, 2(2), 10–25.
- Oyewale, B., & Adewale, B. (2014). Sustainability of microfinance institutions: A comparative case study of Kwara state, Nigeria. Journal of Business and Organizational Development, 6(2), 11–25.
- Platt, H. D., Platt, M. B., & Chen, G. (1995). Sustainable growth rate of firms in financial distress. Journal of Economics and Finance, 19(2), 147–151. doi:10.1007/BF02920515
- Pradhan, R. S. (2003). A stability of the consensus of financial ratios as predictors of financial distress in Nepal. In Research in Nepalese finance (pp. 1–10). Kathmandu: Buddha Academic Publishers & Disbributers. doi:10.2139/ssrn.2793424
- Price Waterhouse Coopers. (2006). National Financial Study of Local Government Sustainability. Commissioned by the Australian Local Government. Sydney, NSW: Author.
- Roychowdhury, S. (2006). Earnings management through real activities manipulation. Journal of Activities Manipulation, 19, 335–370.
- Shaikh, S. (2014). Top 8 theories of profit. Retrieved from http://www.economicsdiscussion.net/theories-of-profit/top-8-theories-of-profit-economics/13939
- Syversson, C. (2011). What determines productivity? Journal of Economic Literature, 49(2), 326–365. doi:10.1257/jel.49.2.326
- Teece, D. J. (2017). A capability theory of the firm: An economics and (Strategic) management perspective. New Zealand Economic Papers, 2017, 1–43.
- Tian, S., & Yu, Y. (2017). Financial ratios and bankruptcy predictions: An international evidence. International Review of Economics and Finance, 51(C), 510–526. doi:10.1016/j.iref.2017.07.025
- Torres-Reyna, O. (2007). Panel data analysis fixed and random effects using Stata (v. 4.2). Data & Statistical Services, Princeton University, 112, 1–40.
- Umobong, A. A. (2015). Assessing the impact of liquidity and profitability ratios on growth of profits in pharmaceutical firms in Nigeria. European Journal of Accounting, Auditing and Finance Research, 3(10), 97–114.
- Walker, F. A. (1887). The source of business profits. The Quarterly Journal of Economics, 1(3), 265–288.
- Wällstedt, N., Grossi, G., & Almqvist, R. (2014). Organizational solutions for financial sustainability: A comparative case study from the Swedish municipalities. Journal of Public Budgeting, Accounting &. Financial Management, 26(1), 181–218.
- Wang, X., Dennis, L., & Tu, Y. S. (2007). Measuring financial condition: A study of U.S. states. Public Budgeting & Finance, 27(2), 1–21. doi:10.1111/j.1540-5850.2007.00872.x
- Watts, R. L., & Zimmerman, J. L. (1990). Positive accounting theory: A ten year perspective. Accounting Review, 65(1), 131–156.
- Yameen, M., & Pervez, A. (2016). Impact of liquidity, solvency and efficiency on profitability of steel authority of India limited. International Journal of Accounting Research, 2(9), 25–31.
- Zhu, J. (2000). Multi-factor performance measure model with an application to fortune 500 companies. European Journal of Operational Research. doi:10.1016/S03772217(99)00096-X
- Zorn, A., Esteves, M., Baur, I., & Lips, M. (2018). Financial ratios as indicators of economic sustainability: A quantitative analysis for Swiss Dairy Farms. Sustainability, 10(8), 2942. doi:10.3390/su10082942