
 ?Mathematical formulae have been encoded as MathML and are displayed in this HTML version using MathJax in order to improve their display. Uncheck the box to turn MathJax off. This feature requires Javascript. Click on a formula to zoom.
Abstract
The study applies two-stage data envelopment analysis (DEA) and bootstrap to estimate the Profit Efficiency (PE) and its factors for Indian bank groups. Recognizing the heterogeneity in the bank sizes, we perform DEA to estimate PE for small, medium, and large banks across different ownership. The results show that large public, private, and foreign sector banks are more profit efficient than small and medium banks. Over the period, private banks showed the highest improvement in efficiency, followed by foreign banks while the efficiency of Public sector banks was highest in 2008 showed imporvement for next few years and declined moderately in 2012. In the second stage, we use both normal Tobit and methodogically superior truncated bootstrap regression to capture the exogenous factors affecting the PE. We find GDP growth rate and capital adequacy ratio were not significant, while return on assets, equity-to-asset ratio, size of the operation, number of branches, Herfindahl-Hirschman Index(HHI), and ownership structure are significant determinants of bank efficiency. The study contributes to the literature by introducing sample variation and bias in examining the determinants and comparison of efficiency scores across bank groups and using a more appropriate measure in Indian contest. The new findings have vital implications for the banking industry and resarchers.
PUBLIC INTEREST STATEMENT
The paper examines the Indian banks’ performance using Data Envelopment Analysis, a nonparametric, linear programing method, that measures relative efficiency to the production frontier, using multiple inputs and outputs variables. Profit efficiency (PE) of 66 banks across ownership and size groups were estimated for 2008-12 period. To identify determinants of PE, normal regression and given the characteristics of dependent data variable, a more appropriate truncated bootstrapping analysis is performed. We found large banks across ownership segments were more efficient than small and medium banks. PE improved considerably for private and moderately for foreign Banks. The Public Banks had higher PE initially and witnessed a small decline. Return on assets, Equity-to-asset, Size, No. of branches, Competition, and Ownership influenced bank PE, while GDP growth and capital adequacy did not. Our work offers important policy and methodlogical implication.
1. Introduction
While researchers have examined bank efficiency more thoroughly, research, particularly on profit efficiency and its determinants, are scarce. Profit efficiency is more informative and comprehensive and in line with the profit objective and hence preferred over technical and cost-efficiency measure used often in past studies. The Indian banking sector is critical to study on various grounds. It is considered among one of the well-regulated financial sectors with robust regulatory institutions that are autonomous from political influence and professional in regulations. India is the second-largest emerging and fastest-growing economy. The advent of new private sector banks has challenged the dominance of old public sector banks (PSB). The sector has seen regulatory reforms, more full technological adoptions, consolidations and rapid financial inclusion. In particular, the need for a fresh look at the banking sector is warranted for the second half of 2000, which also marked over a decade of the advent of private banks and far-reaching regulatory reforms.
Sophisticated tools (Sherman, Citation2006; Sherman & Gold, Citation1985) such as a deterministic frontier model for the estimation of profit efficiencies with extensive information coverage on scale and complexity is preferred over conventional “ratio-based” performance. Importance of different variables, to define the overall operations of banks are suggested (Ariff & Can, Citation2008; Berger, Hancock, & Humphrey, Citation1993a; Fries & Taci, .Citation2005) in general and in Indian context (Bhattacharyya, Lovell, & Sahay, Citation1997; Saha & Ravisankar, Citation2000; Sathye, Citation2003) in particular. As suggested by Maudos and Pastor (Citation2003), several studies are available on technical and cost efficiencies of Indian banks; with fewer on profit efficiencies such as Das, Nag, and Ray (Citation2005) and Ray and Das (Citation2010). Given the scope of the paper, we refrain from elaborating on this in the text. However, a summarization of studies is provided in Appendix D for the benefit of interested readers. Technical efficiency is relevant in a non-market environment where prices of input and output are not reliable or unavailable. Unlike cost efficiency, profit efficiency is more informative (Ray & Das, Citation2010) as it requires the prices of both input and output. A two-stage approach, nonparametric DEA and regression analysis, is adapted to analyze the efficiency and identify its factors. First, the DEA is used to estimate the efficiencies. These estimates are then regressed against a set of factors using the Tobit model to explain the obtained efficiencies (Coelli, Rahman, & Thirtle, Citation2005; Dhungana, Nuthall, & Nartea, Citation2004). Further, we regressed the efficiency score using the methodological advanced and statistically efficient Bootstrap method. Given the nature of dependent variable, truncated bootstrap method measures the bias-corrected estimates of the efficiency determinants and helps draw a valid inference (Chaabouni, Citation2018; Kounetas & Papathanassopoulos, Citation2013).
Our study extends the current literature in several ways. Firstly, Given the listing of public sector banks, increased regulatory capital requirement, and pressing need for the profit of Indian banks, especially PSB we estimate Profit efficiency—neglected by past studies but more appropriate, i.e., exhaustive and better source to management compared to the cost and technical efficiency. Second, given the heterogeneous nature of banks by far, this is the first study to examine efficiency across different ownership and size segments during an eventful period. Thirdly, we include other income as one of the significant output variables, sparsely used in earlier studies. Fourthly, ours is probably the first study in the Indian context to demonstrate the application of bootstrapping regression for the identification of factors affecting the Profit Efficiency, given its statistical characteristics.
2. Background of Indian banking sector
Nearly 200 years old Indian banking industry has evolved into the current size of INR 81 trillion (the US $1.31 trillion) and is poised to be the fifth-largest banking system in the world by 2020 and third-largest by 2025 (KPMG, Citation2017). Indian banking space, prominently, comprised of three categories—public or state-owned, private, and foreign banks, based on their ownership. State Bank of India (SBI), along with six associates, is acknowledged as a separate group of Scheduled Banks2 due to well-defined statutes (SBI Act, 1955 and SBI Subsidiary Banks Act, 1959). Ten nationalized banks, and seven SBI and associates form the Public Sector Banks (PSBs), with over 50% government ownership. PSB’s control around 2/3rd of total business. By 2009, there were 22 private sectors and 32 foreign banks with 293 branches operating in India. Besides, 43 foreign banks were also operating in India through representative offices. Technology-driven Private and foreign banks required less labor and operated primarily in urban centers. While Public-sector banks had a legacy of extensive branch network has a significant rural presence and major employment provider in India. Despite the competitive advantage in their respective domain, the banks had been expanding and modernizing for a significant presence across different segments.
The key financials of the Indian banks over 2008–12 is given in Appendix A while the list of sampled banks is given in Appendix F. Public sector bank assets, and income has grown faster (over 2x) as compared to Private Banks (1.85 x). In contrast, profits of Private Banks grew by 2.4 times while PSB only 1.9 times. The average Return on assets (ROA) of private banks was 1.20% as compared to 0.87 % for PSB. Interestingly, due to the high leverage average Return on Equity (ROE) for PSB is 15.42% and of a private bank is 11.76%. Foreign banks have shown modest growth in income, assets, and profits, while the average ROA has been higher at 1.5%, and ROE is about 10.5%. Indian banks followed scale economies in their operations to meet the demands that arise from various sectors, which is not captured by ratios.
3. Literature review
3.1. Profit efficiency: Theoretical underpinning
McFadden developed the theory of profit function and its relation to the production function of competitive firms in 1966 (Mullineaux, Citation1978). Further, this concept was extended to non-competitive firms (Lau, Fuss, and McFadden, Citation1978). Afterward, the functional form of profit function was studied (Diewert, Citation1973). Researchers also used profit function in the measurement of the economic efficiency of Indian agricultural firms (Lau & Yotopoulos, Citation1971).
Unlike cost function, profit function covers both output (revenue) as well as input (cost) efficiency (Berger Citation1992, Berger et al., Citation1993a). More issues are involved in the output than input efficiency assessment, as output inefficiencies are more extensive than that of input (Berger, Hunter, & Timme, Citation1993b; English, Grosskopf, Hayes, & Yaisawarng, Citation1993). Profit frontier can be described for a set of observations, assuming none is located above, while for cost efficiency, no observation should be below the frontier. The production function for any firm is related to the firm’s ability to attain the maximum level of outputs for a given set of inputs or utilizing a minimum level of inputs for a given set of outputs (Pastor, Perez, & Quesada, Citation1997). Profit frontier can be linked with the maximum level of profits, calculated by a given set of input and output prices.
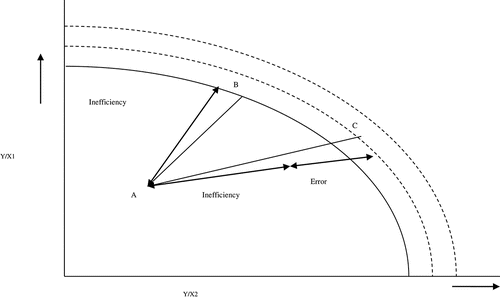
Studies that applied profit function using Stochastic approach include Aigner, Lovell, and Schmidt (Citation1977), Aigner and Chu (Citation1968), Akhigbe and Mcnulty (Citation2003, Citation2011), Akhigbe and Stevenson (Citation2010), Ariff and Can (Citation2008), Berger et al. (Citation1993a), Deyoung and Hasan (Citation1998), Isik (Citation2008), Kumbhakar (Citation1987), Olson and Zoubi (Citation2011), Luo, Tanna, and De Vita (Citation2016). The error term in efficiency measurement in the stochastic approach does not represent the exactness but an estimate of mean inefficiency over the sample (Førsund, Lovell, & Schmidt, Citation1980). Berger and Humphery (Citation1997) recommend the deterministic frontier approach to measure the profit efficiency using DEA. Deviation from the efficient frontier is assumed as inefficiency and can be estimated from the model. Suppose there is a firm, producing Y units of output by consuming X1 and X2 units of inputs. The frontiers of this bank can be drawn as depicted in Figure . The dotted lines show the probabilistic position of the stochastic frontier (as their position cannot be precisely determined), and the solid curve shows the exact position of the deterministic frontier. If bank A is inefficient i.e., it is not on the frontier, then as per deterministic view, its deviation is measured as inefficiency (AB), while as per stochastic, it is a combination of inefficiency and error term. Moreover, one cannot predict the exact position of error and inefficiency term on the deviation line of bank A from the stochastic frontier. In Figure , differences between stochastic and DEA can be observed in terms of their inefficiency measurement.
Figure 1. Inefficiency measurement in deterministic and stochastic approaches
Charnes, Cooper, and Rhodes (Citation1979) pioneered the use of DEA, followed by Sherman and Gold (Citation1985) in the USA, among others and Luther Committee (1977) in India for the Banking Sector. DEA is employed for efficiency estimate in developed countries (Aly, Grabowski, Pasurka, & Rangan, Citation1990; Grabowski, Rangan, & Rezvanian, Citation1994; Miller & Noulas, Citation1996; Rangan, Grabowski, Aly, & Pasurka, Citation1988, Chu and Lim, Citation1998), as well emerging economies (Bhattacharyya et al., Citation1997; Das et al., Citation2005; Leightner & Lovell, Citation1998; Saha & Ravisankar, Citation2000; Sathye, Citation2003).
3.2. Factors influencing efficiency
The estimated efficiency in the first stage utilizing the DEA is regressed through the Tobit model in the second stage to find its factors (Begum, Alam, Buysse, Frija, & van Huylenbroeck, Citation2012; Galanopoulos, Aggelopoulos, Kamenidou, & Mattas, Citation2006; Khoshroo, Mulwa, Emrouznejad, & Arabi, Citation2013). Balcombe, Fraser, Latruffe, Rahman, and Smith (Citation2008) and Alexander, Haug, and Jaforullah (Citation2010) used a two-stage analysis by using DEA to measure efficiency and later adopted a bootstrap procedure to examine the effects of environmental and managerial factors on bank efficiency.
4. The methodology and mod
4.1. Stage 1-non-parametric approach
As a non-parametric approach DEA method compares different decision-making units (DMUs) by using a frontier to segregate efficient and inefficient units. DEA can accommodate multiple inputs and outputs, which calculate relative efficiency against the efficient frontier. The DEA identifies DMUs that are performing at the efficiency score of one, and the DMUs that perform below this score are considered inefficient. DEA can generate both technical efficiency (TE) and pure technical efficiency (PTE). The overall TE assumes the constant return to scale (CRS) and PTE assumes the variable return to scale (VRS) (Cooper, Seiford, & Tone, Citation2006) Unlike Bhattacharyya et al. (Citation1997), we focus on allocative efficiency (cost and profit). In cost-efficiency estimation, we optimize considering input variables, which may not be appropriate for profit-driven organizations. We consider both output and input variables and the price associated with them, respectively (Cooper et al., Citation2006; Ray, Citation2004; Ray & Das, Citation2010). Following illustration explain the approach:
Suppose a bank has output bundle yo, input bundle xo and their corresponding prices vectors are p = (p1, p2 … on) and w = (w1, w2, …, wm) then, the profit-maximizing function of that bank can be written as:
Subject to (xo, yo) T, where T is the production possibility set of the bank at given variables. If the optimal solution for the bank is
Therefore, profit efficiency:
Further, this concept can be generalized for many banks. Suppose we have a sample of p banks, and each bank is having m inputs and n outputs. If xik, and yjk, represent the ith input and jth output of kth bank, where i = 1,2,3 … .m, and j = 1,2,3 … .n, and k = 1,2,3 … N. Hence, Profit maximization problem of a bank having input and output prices, w = (w1, w2, …, wm) and p = (p1, p2, …, pn) respectively can be formulated as (Cooper et al., Citation2006; Ray, Citation2004; Ray & Das, Citation2010):
Subject to conditions:
For a particular bank, profit maximization can be achieved through the optimal value of the input xi* (i = 1, 2, 3 … .m) and yr* (r = 1, 2, 3 … .n) with other decision variables (k = 1, 2, 3 … .N). To achieve a feasible solution, we must allow bounded constraint, i.e., the VRS approach, otherwise for any arbitrary t > 0, (tλ∗, tx∗, ty∗) is also a feasible solution. In this scenario, optimal profit will also be increased by “t,” and profit can be increased indefinitely. Following cases are essential to examine the estimation of profit efficiency, Ray (Citation2004). The profit efficiency ratio (EquationEquationEquation (3)
(3)
(3) )
(3)
(3) can be negative if the actual profit is negative, and the maximum profit is positive. The profit efficiency ratio can be more than one if both values are negative. Zero profit can also be possible in the long run, when all inputs and outputs variables have free entry and exit option. The actual negative profit of a bank can be possible due to the inefficiencies involved in its operations.
4.2. Stage 2-bootstrap regression analysis
DEA, as a non-parametric approach, is often criticized for drawing the statistical inference and undergone several improvements (Seiford, Citation1996). A two-stage regression was used primarily to treat the obtained efficiency values on a set of explanatory variables with the help of linear regression to overcome this. An immediate improvement has been made, considering the efficiency scores obtained in the first stage are censored, which led to the use of limited dependent variable models over OLS (Casu & Molyneux, Citation2003). Another issue arises while using the two-step procedure, which takes no account of the underlying Data-Generating Process (DGP). In this process, the variables used to obtain the efficiency scores in the first stage will be correlated with the explanatory variables used in the second stage, resulting in inconsistency and biases (Simar, Lovell, & Vanden Eeckaut, Citation1994). The basic DEA model explains the environmental variables i.e., Factors affecting the efficiency of a DMU. These factors are not traditional inputs and are not under the control of management. First, DEA is used to estimate the efficiencies. In the second stage, the efficiency estimates are to be regressed against a set of environmental variables using the Tobit model because it can account for truncated data (Idris, Siwar, & Talib, Citation2013). In this context, the sign of the resulted coefficients of the environmental factors shows the direction of the influence, and standard statistical hypothesis testing is utilized to examine the strength of the relationship (Casu & Molyneux, Citation2003).
The DEA generated efficiency values are dependent on each other statistically because the score generated is a relative index, not an absolute index (Xue & Harker, Citation1999). In response, Efron (Citation1979) pioneered a powerful statistical tool- the bootstrap method, and subsequently, Simar and Wilson (Citation2007) proposed an advanced version. The bootstrapping procedure improves statistical efficiency and draws valid inference by simulating the sample distribution and taking the data generating process (DGP) into account. In this approach, we presume that the DGP generates the original sample of data, and by simulating DGP, draw a new pseudo set of data. This repeating process gives rise to an empirical distribution of bootstrapped data following a Monte Carlo approximation to help draw new inferences. In the second stage, we use both a censored truncated normal Tobit regression with maximum likelihood method and bootstrapping truncated regression analysis. The variables selected for this study are; size of operation (SOP), equity to asset ratio (EA), return on asset (ROA), number of branch (NB), capital adequacy ratio (CAR), ownership-nature of the bank (OWN), gross domestic product growth rate (GDPGR), and Herfindahl Hirschman Index (HHI), i.e., measure of competition concentration in the Industry.
We regress the Average Profit Efficiency (APE) obtained from the first stage on a set of variables using the following regression model:
Where with left-truncation at 1-Ziδ; a = constant term and Zi is a vector of specific variables to affect bank efficiency.
After estimating the APE θ for each bank, a truncated maximum likelihood is employed to regress θi on Zi. The bootstrap estimates are produced using 1000 bootstrap replications. The bootstrap results are used to construct confidence intervals for the APE (Barros & Assaf, Citation2009; Chortareas, Girardone, & Ventouri, Citation2012; Khan, Ali, & Khan, Citation2018; Lee & Worthington, Citation2014; Simar & Wilson, Citation2007).
The regression equation takes the following form:
Where θi (APS) is the APE obtained from the first stage of analysis. The SOP is Scale of Operation i.e., size of bank in terms of Total Asset; EA is equity to total assets, ROA is Return on Asset, NB is number of Branches, CAR is capital adequacy ratio, OWN is ownership of Banks such as Public, Private or Foreign, GDPGR is Growth rate in GDP, and HI is Herfindahl Hirschman Index of Concentration.
4.3. Data and variables
This study considered 26 public, 19 private, and 21 foreign banks as per the availability of all variables from year 2008 to 2012. We collected the bank data from the RBI website and Centre for Monitoring Indian Economy (CMIE) Prowess database to arrive at the final dataset for the study.
The divergence in the performance of small and large banks was explained by Akhigbe and Mcnulty (Citation2003), Berger and Mester (Citation1997), Gilbert (Citation1984), Rhoades and Rutz (Citation1982) found that larger banks had better standard profit efficiency score compared to smaller banks in the USA, due to higher output levels resulting in scale economies. Bos and Kool (Citation2006) attributed this to market power and differentiation, along with scale economies. Given the heterogeneity, in sizes of Indian banks, the common frontier concept would be inappropriate, and hence we segment ownership groups in large, medium, and small subgroups based on total assets using a quartile approach. In profit efficiency estimation, we allocate different resources to the objective bank to achieve the frontier position. Since resource allocation is not possible in each heterogeneous group, we form homogeneous size groups across the ownership.
4.3.1. Variables for stage-I analysis and approach
Production and intermediation are the two main approaches utilized for the selection of inputs and outputs (Berger, Hanweck, & Humphrey, Citation1987; Bhattacharyya et al., Citation1997. In a production approach bank is considered as a service providing unit performing transaction and process documents to provide services, using labor and capital. The output is measured in the number of transactions and documents processed. This approach is appropriate for bank branch level studies because the branch processes customer documents and transactions. (Berger & Humphery, Citation1997; Sealey & Lindley, Citation1977). The bank is considered as a financial intermediary channelizing fund between savers and investors in the intermediation approach. In this approach purchased funds are included as the primary raw material in the financial intermediation process along with physical inputs, and output is measured in the value of the transaction and hence more appropriate for our study (Berger et al., Citation1987; Berger & Humphery, Citation1997; Ray & Das, Citation2010). Following the intermediation approach, we take labor (number of the employee), funds, and capital and its prices as input variables. With technological advances and shared ATM services, at par and multi-city banking, we believed the employees are a better indicator of input. For output variables, we use investment, earning asset (excluding the NPA as non-performing loan impact directly on the provision, contingencies, and net profits of the bank) and non-interest income generated from the fee, commission, brokerage. Appendix B. shows the variables used for this study. For convenience, the bank groups are denoted as large public sector (LPUS), medium public sector (MPUS), small public sector (SPUS), large private sector (LPRS), medium private sector (MPRS), small private sector (SPRS), large foreign sector (LFS), medium foreign sector (MFS), and small foreign sector (SFS) banks.
4.3.2. Variable for stage-II analysis
Klaassen and van Eeghen (Citation2014) found that the return on asset (ROA) affected the performance of banks. Studies also found that the Capital Adequacy Ratio (CAR) has an essential role in the performance of the bank (Abba, Okwa, Soje, & Alkpitanyl, Citation2018). It utilized capital and assets to determine the bank’s financial strength. The equity-to-asset ratio (EA) also affected the bank’s performance. Tan and Floros (Citation2012) showed that GDP growth and unemployment rate were significantly related to bank profitability in China. Competition concentration as measured by Herfindahl-Hirschman Index (HHI) is also argued to have a significant effect on bank performance. Mohan and Ray (Citation2004) found a weak ownership effect between public and private banks. Zardkoohi and Kolari (Citation1994) studied the impact of branch networks and reported that efficiency increased with the number of branches. The size of the bank also impacted its profitability (Akhavein, Berger, & Humphery, Citation1997; Kosak & Cok, Citation2008; Sufian & Habibullah, Citation2009).
5. Results
5.1. DEA profit efficiency estimates
The descriptive statistics of the variables for the study period are given in Table , indicating a substantial difference across the ownership groups. For instance, the mean size of public banks in terms of funds is almost 4x that of private banks, while foreign banks are 1/10 of Public Banks. Even within the ownership largest bank in PSB i.e., SBI is 3x as compared to the second-largest bank. Table shows the APE scores. Large public sector banksFootnote1 Reported relatively higher APE compared to medium and small banks. Unlike medium public sector banks, large and small public sector banks reported lower APE scores in 2009 compared to adjoining years. Except in 2009, medium banks saw a declining trend of APE, over the period. Small banks saw an increase in APE, except the year 2009, as can be seen in Figure . We observe the highest standard deviation in APE for the medium public sector banks and lowest for the large public sector banks. Additionally, the non-parametric Wilcoxon–Mann–Whitney test has been employed to examine if the APE is different across paired bank groups. We found of the nine groups, six paired bank groups have significantly different APE in Table , which can due to high heterogeneity observed in Table .
Table 1. Descriptive statistics of profit efficiency variables (In Billion Rupees)
Table 2. Results of DEA and Wilcoxon–Mann–Whitney test for different bank groups
Figure 2. APE scores and trend of the standard deviation of different bank groups
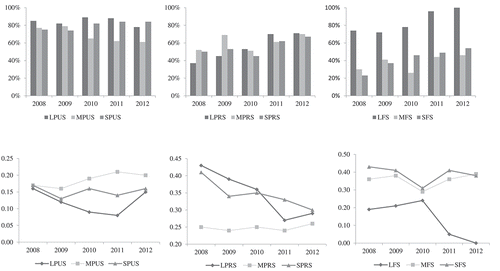
Table shows the APE of private sector banks over the study period. Large private sector banks reported an increase in APE. Unlike large banks, small and medium banks reported the lowest APE in 2010 (Figure ). We find large and small banks have higher standard deviation as compared to medium sector banks. Large private sector banks had a higher standard deviation than small private sector banks up to 2010, and the trend reversed in later years (Figure ).
Large foreign banks outperformed medium and small foreign banks. Medium foreign banks reported a higher APE score than small foreign banks until 2009, but the trend reversed afterward (Figure ). The result shows the lowest standard deviation in large foreign banks compared to small and medium. (See Figure ).
APE of Private Banks showed more considerable improvement than public and foreign banks. Moreover, the large private banks witnessed the most significant improvement among respective size groups. Although high APE of Public Sector banks, large and medium banks have seen a muted decline over the period,small public banks saw a rise in APE. All foreign banks witnessed good improvement in APE, with only large foreign banks achieving 100% APE in the year 2012. The public sector bank witnessed a modest decline in APE due to declining asset quality, the legacy of bad loans, social orientation, and a more extensive employee base coupled with high technology investments and inadequate focus on profitable segments. On the other side, private and foreign banks seem to have been able to manage asset quality and profitable business opportunities and resorted to cherry-picking profitable business segments, unlike the public sector banks, which had social and political obligations to fulfill.
5.2. Determinants of profit efficiency
The descriptive statistics of the variables for different subgroups of the banks for the second stage analysis is given in Appendix C. The results from the censored normal Tobit regression, and bootstrap truncated regression are shown in Table . The results from both the regression are similar. We find that the size of the operation is statistically significant and negative. Hence, the greater size of operation might lead to the reduction of the APE score. The coefficient of the relationship between equity-to-asset ratio and APE is significant and negative, suggesting that higher the leverage leads to improvement in the APE. The results further reveal that return on assets and HHI are statistically significant. However, the coefficient obtained for return on asset and HHI in Tobit regression has a positive impact, whereas the resulted coefficients in bootstrap truncated regression shows a negative effect on the APE. These observed results differ from that of Carbo, Gardener, and Williams (Citation1999), who found the positive relationship between return on assets and efficiency levels. The results also contrast with the significant positive relationship between return on assets and efficiency levels obtained by Tobit regression, which show that inference drawn from a “non-bootstrapped” Tobit Regression analysis may be biased and misleading. Cristian Nedelea, Fannin, and Barnes (Citation2010) mentioned that greater HHI indicates less competitive pressure, which implies an inverse relationship between HHI and APE. The number of branches and ownership structure of the banks is highly significant; however, the impact is low and favorable. We find large foreign and private banks, medium foreign and private banks, and small private and public banks are statistically significant and positive on APE. However, large and medium public banks are not significant. These obtained results corroborate the findings of Micco, Panizza, and Yañez (Citation2011), indicating a strong relationship between ownership structure and performance. They found that state-owned banks tend to achieve lower profitability than private banks and foreign-owned banks. However, Phuong, Harvie, and Arjomandi (Citation2015), in their study in Vietnam, revealed that state-owned bank groups are more efficient than foreign and joint-stock bank groups. The results for GDP growth rate and capital adequacy ratio in bootstrap truncated regression are not significant.
Table 3. Second stage results
6. Summary and discussion
The purpose of the research was to examine the profit efficiency and its determinants of Indian banks across different ownership and size segments for the eventful period of 2008–2012. We found that large public sector banks have lower APE in 2012 compared to 2008 and 2010. The APE of large public sector banks was 85% in 2008 and 89% in 2010 but declined to 78% in 2012, however APE of small public sector banks increased from 74% to 84% during the study period while that of Medium Public Sector Bank declined from 77% to 61%. Results of Large PBS could be explained by looking at the number of frontier banks in those two consecutive years 2008 and 2009. Refer to the Appendix F for the Full Name of the Bank. The total number of frontier banks in Large PSB group were 3 (CB, BOI, and IDBI) in 2008 and 2 (PNB and BOI) in 2009. We see lower APE scores of large public sector banks in 2012 due to the lower value of individual PE scores of large banks. Like CBFootnote2 reported a 96% profit efficiency in 2008 and 74% in 2012. It would be more apparent; if we analyzed the actual profitFootnote3 Of CB in 2008 and 2012, compared to the frontier bank in the respective years. The difference between the actual profits of CB (target bank) and PNB (one of the frontier banks) was 80% of the actual profit of the CB. In 2012, the difference between the actual profits of CB (target bank) and BOI (one of the frontier banks) was 26% of the actual profit of the CB. Thus explains the relative profit efficiency scores of CB in 2008 (96%) and 2012 (74%). The lowest standard deviation of large public sector banks had been reported in 2011, indicating homogeneity in profit efficiencies of the large public banks as compared to the rest of the study periods. The public sector had the highest APE in 2008. We see a small decline over the period. The APE of both private and foreign banks was lower compared to that of PSB but witnessed more considerable improvement over the period. Our findings compare with that of Jayaraman and Srinivasan (Citation2014) that the private sector had lower profit inefficiency as compared to PSB.
Medium PSB reported lower profit efficiency after 2009, and the number of frontier banks also decreased from 5 to 3 over the period. A higher standard deviation indicates the high heterogeneity in profit efficiency. A small increment (74% to 79%) in the APE of medium PSB over 2008–2009 could be explained by pondering at profit efficiency score of CB (Appendix F provides the Full Name of the Banks). PE scores of CB improved from 77% to 100% during 2008–09. Unlike medium PSB, small PSB showed more improvement and an upward trend in profit efficiency during 2008–2012.
We can explain the trend in Small PSB by looking at the number of frontier banks and heterogeneity withing the small PSB group. APE of small PSB was lower in 2009 as compared to 2008, mainly due to the underperformance of some banks in 2009. BOM reported 81% profit efficiency in 2008 and 70% in 2009, DB secured 72% profit efficiency in 2008 and 68% in 2009 and SBM secured 77% profit efficiency in 2008 and 69% in 2009. Amongst large, medium, and small public sector banks, we observe the highest heterogeneity in APE of medium public sector banks. As PSB, significant trends of APE of private and foreign banks have been reported.
Nevertheless, in some cases, it is different, i.e., unlike medium PSB, medium private and foreign banks witnessed an increase in APE scores after 2008 and 2009. Lower APE in 2010 compared to 2009, for medium and small private sector banks is observed. This disparity could be due to high heterogeneity among APE of banks and fewer frontier banks in 2010 in the respective size groups. Findings do differ to some extent across the profit efficiency of the Indian public, private, and foreign bank groups. Large public sector banks were more profit efficient as compared to small and medium banks indicating the benefits of scale economies. Small public sector banks outperformed the medium public sector banks over the study period. Furthermore, medium private banks had reported higher efficiency than large and small private banks before 2009.
Contrary to this, large foreign banks had reported higher profit efficiency compared to medium and small foreign banks. Among all the ownership groups overall, the foreign banks have experienced the most considerable improvement in profit efficiency followed by the private and public sector, understandably due to the focused strategy for profitable business segments. In contrast, the public banks have the social objective, large employee base, and rural branch network to support. While the average profit efficiency of all public sector banks has been higher, we do not see much improvement over the period. Interestingly the market discipline imposed by a listing of public sector banks has seen higher scale efficiency and an improvement over the period as compared to private and foreign banks (Singh & Thaker, Citation2016). However, social charter and legacy of the public sector have perhaps inhibited the profit efficiency despite being scale efficient.
Moreover, diminishing asset quality of PSB and intense competition for the fee-based and profitable business from agile private and foreign banks have caused a moderate decline in APE for PSB. There are important implications of the study. The banks with low APE can consider ways to improve the management of resources; asset quality and recovery, focus fee-based business, and cost-efficiency. The study also points out the importance of size in bank efficiency, indicating possible mergers and acquisitions in the banking sector as a policy implication. Bank management may consider employing optimal production plans, new technology adoptions, staff and capacity rationalization organically or through M&A as possible strategies. We expect the advent of many more new banks in private and foreign sector banks, consolidations in public sector banks in the future, given the profit opportunities in the Indian banking sector.
Owing to the characteristic of the DEA and a dependent variable, using the conventional regression was not be appropriate. Hence, we used the bootstrap regression to find the factors that affect or explain the APE of banks. Both bootstrap and conventional Tobit results indicate that APE is significantly influenced by the size of the operation, equity-to-asset ratio, the return of assets, Herfindahl Hirschman Index, number of branches, and ownership-nature of the banks. However, the GDP growth rate and capital, but the bank-specific factors influence the APE of the Indian banking sector during 2008–12 (Huang, Chen, & Yin, Citation2014). It might also be due to shock copping regulatory framework of Reserve Bank of India. The policy focus on other income, asset quality, and competition, rationalization of size, branches, employee strength and consolidation are recommended.
7. Conclusions
This study advances banking efficiency literature in several ways. We estimate a more plausible measure of efficiency, i.e., Profit Efficiency at VRS using DEA. Secondly, covering an eventful and exciting period, Thirdly, segment-wise analysis forming ownership and size segment groups wise analysis, using contemporary variables for input and output for the first stage and, fourthly considering the characteristics of dependent variable this study employed a superior and robust truncated bootstrap method for the second stage to identify the determinants. Our study also has important policy implications for regulators and managers for consolidation, focus on fee-based income, better management of asset quality, employee strength and size.
However, the study is not free from limitations. DEA indicates how well a DMU is performing compared to other DMUs and not compared to a theoretical maximum. In DEA, a separate linear program is generated for each DMU during efficiency estimation. Thus, computationally intensive problems are the focus of ongoing research and point out future areas of inquiry.
Correction
This article has been republished with minor changes. These changes do not impact the academic content of the article.
Acknowledgements
The assistance provided by Arihant Jain at IIM Indore, Anirban Nandya and Shiladitya Dey at IIT Kharagpur in the revision of the paper is gratefully acknowledged
Additional information
Funding
Notes on contributors
Piyush Kumar Singh
Piyush Kumar Singh is Assistant Professor in Rural Development Centre and Joint faculty in the Agricultural and Food Engineering Department at the Indian Institute of Technology Kharagpur, India. He is an Agricultural Engineer from IIT Kharagpur, and PhD in Finance from IIM Indore. His research focuses on the performance management of financial institutions and their role in rural and agricultural development covering the ethical norms adopted by financial institutions and its different stakeholders to secure the financial stability in the country.
Keyur Thaker
Keyur Thaker is Associate Professor in the Finance and Accounting Area at the Indian Institute of Management Indore. His research and teaching interest include Performance Management and Control Systems, Bank Efficiency, Corporate Finance, and Project Finance. Research papers of Prof Thaker have appeared in journals such as the Australian Accounting Review, Journal of Financial Education, Intl Journal of Business Performance Measurement. Prof Thaker is actively involved in executive education, corporate training, and consulting.
Notes
1. We did not include State bank of India (SBI), the largest public sector bank of India in this segment because of its larger size, almost 3x compared to the second-largest bank in the country, which drives the results in one direction. We removed SBI from the sample of profit efficiency after conducting the comparative analysis.
2. Despite having 96% profit efficiency score, CB was one of the frontier banks in 2008 because it falls infeasible region, as the frontier is a concept of the feasible region rather than a single line (Ray, Citation2004).
3. As per our DEA formulation, we calculated actual profit by employing various cost and revenue side variables.
References
- Abba, G., Okwa, E., Soje, B., & Alkpitanyl, L. N. (2018). Determinants of capital adequacy ratio of deposit money banks in Nigeria. Journal of Accounting and Marketing, 7, 2. doi:10.4172/2168-9601.1000271
- Aigner, D., Lovell, C. K., & Schmidt, P. (1977). Formulation and estimation of stochastic frontier production function models. Journal of Econometrics, 6(1), 21–25. doi:10.1016/0304-4076(77)90052-5
- Aigner, D. J., & Chu, S. F. (1968). On estimating the industry production function. The American Economic Review, 58(4), 826–839.
- Akhavein, J. D., Berger, A., & Humphery, D. (1997). The effect of megamergers on efficiency and prices: Evidence from a bank profit function. Review of Industrial Organization, 12(1), 95–139. doi:10.1023/A:100776092
- Akhigbe, A., & Mcnulty, J. E. (2003). The profit efficiency of small US commercial banks. Journal of Banking and Finance, 27(2), 307–325. doi:10.1016/S0378-4266(01)00250-3
- Akhigbe, A., & Mcnulty, J. E. (2011). Bank monitoring, profit efficiency, and the commercial lending business model. Journal of Economics and Business, 63(6), 531–551. doi:10.1016/j.jeconbus.2011.07.001
- Akhigbe, A., & Stevenson, B. A. (2010). Profit efficiency in US BHCs: Effects of increasing non-traditional revenue sources. The Quarterly Review of Economics and Finance, 50(2), 132–140. doi:10.1016/j.qref.2009.11.003
- Alexander, W. R. J., Haug, A. A., & Jaforullah, M. (2010). A two-stage double-bootstrap data envelopment analysis of efficiency differences between New Zealand secondary schools. Journal of Productivity Analysis, 34(2), 99–110. doi:10.1007/s11123-010-0173-3
- Aly, H. Y., Grabowski, R., Pasurka, C., & Rangan, N. (1990). Technical, scale, and allocative efficiencies in US banking: An empirical investigation. The Review of Economics and Statistics, 72(2), 211–218. doi:10.2307/2109710
- Ariff, M., & Can, L. (2008). Cost and profit efficiency of Chinese banks: A non-parametric analysis. China Economic Review, 19(2), 260–273. doi:10.1016/j.chieco.2007.04.001
- Balcombe, K., Fraser, I., Latruffe, L., Rahman, M., & Smith, L. (2008). An application of the DEA double bootstrap to examine sources of efficiency in Bangladesh rice farming. Applied Economics, 40(15), 1919–1925. doi:10.1080/00036840600905282
- Barros, C. P., & Assaf, A. (2009). Bootstrapped efficiency measures of oil blocks in Angola. Energy Policy, 37(10), 4098–4103. doi:10.1016/j.enpol.2009.05.007
- Begum, I. A., Alam, M. J., Buysse, J., Frija, A., & van Huylenbroeck, G. (2012). Contract farmer and poultry farm efficiency in Bangladesh: A data envelopment analysis. Applied Economics, 44(28), 3737–3747. doi:10.1080/00036846.2011.581216
- Berger, A. N. (1992). Measurement and efficiency issues in commercial banking. In D. B. Humphrey (Ed, Output measurement in the service sectors (245–300). Chicago: University of Chicago Press.
- Berger, A. N., Hancock, D., & Humphrey, D. B. (1993a). Bank efficiency derived from the profit function. Journal of Banking and Finance, 17(2–3), 317–347. doi:10.1016/0378-4266(93)90035-C
- Berger, A. N., Hanweck, G. A., & Humphrey, D. B. (1987). Competitive viability in banking: Scale, scope, and product mix economies. Journal of Monetary Economics, 20(3), 501–520. doi:10.1016/0304-3932(87)90039-0
- Berger, A. N., & Humphery, D. B. (1997). The efficiency of financial institutions: International survey and directions for future research. European Journal of Operational Research, 98(2), 175–212. doi:10.1016/S0377-2217(96)00342-6
- Berger, A. N., Hunter, W. C., & Timme, S. G. (1993b). Efficiency of financial institutions: A review and preview of research past, present, and future. Journal of Banking and Finance, 17(2–3), 221–249. doi:10.1016/0378-4266(93)90030-H
- Berger, A. N., & Mester, L. J. (1997). Inside the black box: What explains differences in the efficiencies of financial institutions? Journal of Banking and Finance, 21(7), 895–947. doi:10.1016/S0378-4266(97)00010-1
- Bhattacharyya, A., Lovell, C. K., & Sahay, P. (1997). The impact of liberalization on the productive efficiency of Indian commercial banks. European Journal of Operational Research, 98(2), 332–345. doi:10.1016/S0377-2217(96)00351-7
- Biresh K. Sahoo, Kaoru Tone (2009). Decomposing capacity utilization in data envelopment analysis: An application to banks in India. European Journal of Operational Research, 195(2), 575–594, ISSN 0377–2217. doi:10.1016/j.ejor.2008.02.017
- Bos, J. W., & Kool, C. J. (2006). Bank efficiency: The role of bank strategy and local market conditions. Journal of Banking and Finance, 30(7), 1953–1974. doi:10.1016/j.jbankfin.2005.07.008
- BS Bodla, RV Bajaj, (2010). An Analysis of the Efficiency of Private Sector Banks in India, - The IUP Journal of Bank Management, 9(1/2), IUP, Hydrabad, India.
- Carbo, S., Gardener, E. P. M., & Williams, J. (1999, September 2–3). Efficiency and technical change in the European savings bank sector. Paper presented at the Annual Seminar of the European Association of University Teachers of Banking and Finance, Lisbon. doi:10.1046/j.1469-1809.1999.6320101.x
- Casu, B., & Molyneux, P. (2003). A comparative study of efficiency in European banking. Applied Economics, 35(17), 1865–1876. doi:10.1080/0003684032000158109
- Chaabouni, S. (2018). China’s regional tourism efficiency: A two-stage double bootstrap data envelopment analysis. Journal of Destination Marketing and Management. doi:10.1016/j.jdmm.2017.09.002
- Chakrabarti, R., Chawla, G., Rakshit, M., & Bose, S., (2008) “Bank efficiency in India since the reforms: An assessment”, Dynamics of Indian Baking: Views and Vistas, Xiaogang: Atlantic publisher, 39-60.
- Charnes, A., Cooper, W. W., & Rhodes, E. (1979). Measuring the efficiency of decision-making units. European Journal of Operational Research, 2(6), 429–444. doi:10.1016/0377-2217(78)90138-8
- Chortareas, G. E., Girardone, C., & Ventouri, A. (2012). Bank supervision, regulation, and efficiency: Evidence from the European Union. Journal of Financial Stability, 8(4), 292–302. doi:10.1016/J.JFS.2011.12.001
- Chu, S. F., & Lim, G. H. (1998). Share performance and profit efficiency of banks in an oligopolistic market: Evidence from Singapore. Journal of Multinational Financial Management, 8(2–3), 155–168. doi:10.1016/S1042-444X(98)00025-5
- Coelli, T., Rahman, S., & Thirtle, C. (2005). Technical, allocative, cost, and scale efficiencies in Bangladesh rice cultivation: A non-parametric approach. Journal of Agricultural Economics, 53(3), 607–626. doi:10.1111/j.1477-9552.2002.tb00040.x
- Cooper, W. W., Seiford, L. M., & Tone, K. (2006). Introduction to data envelopment analysis and its uses: With DEA-solver software and references. Boston: Springer Science.
- Cristian Nedelea, I., Fannin, J. M., & Barnes, J. N. (2010, July 25–27). Analyzing differences in rural hospital efficiency: A data envelopment analysis approach. Paper presented at AAEA, CAES, and WAEA Joint Annual Meeting, Denver, CO.
- Das, A.(2000) efficiency of public sector banks: an application of data envelopment analysis model, 2000, Prajanan: Journal of Social and management Sciences,28(2), 119–131
- Das, A., Nag, A., & Ray, S. C. (2005). Liberalization, ownership, and efficiency in Indian banking: A nonparametric analysis. Economic and Political Weekly, 40(12), 1190–1197.
- Debashish, S. S. (2006). Efficiency performance in indian banking – use of data envelopment analysis. Global Business Review, 7(2), 325–333.
- Deyoung, R., & Hasan, I. (1998). The performance of de novo commercial banks: A profit efficiency approach. Journal of Banking and Finance, 22(5), 565–587. doi:10.1016/S0378-4266(98)00025-9
- Dhungana, B. R., Nuthall, P. L., & Nartea, G. V. (2004). Measuring the economic inefficiency of Nepalese rice farms using data envelopment analysis. Australian Journal of Agricultural and Resource Economics, 48(2), 347–369. doi:10.1111/j.1467-8489.2004.00243.x
- Diewert, W. E. (1973). Functional forms for-profit and transformation functions. Journal of Economic Theory, 6(3), 284–316. doi:10.1016/0022-0531(73)90051-3
- Efron, B. (1979). Bootstrap methods: Another look at the Jackknife. The Annals of Statistics, 7(1), 1–26. doi:10.1214/aos/1176344552
- English, M., Grosskopf, S., Hayes, K., & Yaisawarng, S. (1993). Output allocative and technical efficiency of banks. Journal of Banking and Finance, 17(2–3), 349–366. doi:10.1016/0378-4266(93)90036-D
- Førsund, F. R., Lovell, C. K., & Schmidt, P. (1980). A survey of frontier production functions and their relationship to efficiency measurement. Journal of Econometrics, 13(1), 5–25. doi:10.1016/0304-4076(80)90040-8
- Fries, S., & Taci, A. (2005). Cost efficiency of banks in transition: Evidence from 289 banks in 15 post-communist countries. Journal of Banking and Finance, 29(1), 55–81. doi:10.1016/j.jbankfin.2004.06.016
- Galanopoulos, K., Aggelopoulos, S., Kamenidou, I., & Mattas, K. (2006). Assessing the effects of managerial and production practices on the efficiency of commercial pig farming. Agricultural Systems, 88(2–3), 125–141. doi:10.1016/j.agsy.2005.03.002
- Gilbert, R. A. (1984). Bank market structure and competition: A survey. Journal of Money, Credit and Banking, 16(4), 617–645. doi:10.2307/1992096
- Grabowski, R., Rangan, N., & Rezvanian, R. (1994). The effect of deregulation on the efficiency of US banking firms. Journal of Economics and Business, 46(1), 39–54. doi:10.1016/0148-6195(94)90020-5
- Huang, J., Chen, J., & Yin, Z. (2014). A network DEA model with super efficiency and undesirable outputs: An application to bank efficiency in China. Mathematical Problems in Engineering, 2014(Apr), 1–14. doi:10.1155/2014/793192
- Idris, N. D. M., Siwar, C., & Talib, B. (2013). Determinants of technical efficiency on pineapple farming. American Journal of Applied Sciences, 10(4), 426–432. doi:10.3844/ajassp.2013.426.432
- Isik, I. (2008). Productivity, technology, and efficiency of de novo banks: A counter-evidence from Turkey. Journal of Multinational Financial Management, 18(5), 427–442. doi:10.1016/j.mulfin.2007.11.004
- Jayaraman, A. R., & Srinivasan, M. R. (2014). Analyzing the profit efficiency of banks in India with undesirable output – Nerlovian profit indicator approach. IIMB Management Review, 26(4), 222–233. doi:10.1016/j.iimb.2014.09.003
- Khan, I. U., Ali, S., & Khan, H. N. (2018). Market concentration, risk-taking, and efficiency of commercial banks in Pakistan : An application of the two-stage double bootstrap DEA. Business and Economic Review, 10(2), 65–96. doi:10.22547/BER/10.2.4
- Khoshroo, A., Mulwa, R., Emrouznejad, A., & Arabi, B. (2013). A non-parametric data envelopment analysis approach for improving the energy efficiency of grape production. Energy, 63(Dec), 189–194. doi:10.1016/j.energy.2013.09.021
- Klaassen, P., & van Eeghen, I. (2014, January). Analyzing bank performance: Linking ROE, ROA, and ROROC. Available at SSRN. doi:10.2139/ssrn.2389443 .
- Kosak, M., & Cok, M. (2008). Ownership structure and profitability of the banking sector: Evidence from the SEE-6 region. Journal of Economics and Business, 26(1), 93–122. Retrieved from https://ssrn.com/abstract=2268462
- Kounetas, K., & Papathanassopoulos, F. (2013). How efficient are Greek hospitals? A case study using a double bootstrap DEA approach. European Journal of Health Economics, 14(6), 979–994. doi:10.1007/s10198-012-0446-z
- KPMG International. (2017). The India-U.S. dynamic – Better together. Retrieved from https://home.kpmg/in/en/home/insights/2017/11/india-us-dynamic-relationship.html
- Kumbhakar, S. C. (1987). The specification of technical and allocative inefficiency in stochastic production and profit frontiers. Journal of Econometrics, 34(3), 335–348. doi:10.1016/0304-4076(87)90016-9
- Lau, L. J. (1978). Applications of profit functions. In M. Fuss & D. McFadden (Eds.), Production Economics (pp. 133–216). Amsterdam: North-Holland.
- Lau, L. J., & Yotopoulos, P. A. (1971). A test for relative efficiency and application to Indian agriculture. The American Economic Review, 61(1), 94–109.
- Lee, B. L., & Worthington, A. C. (2014). Technical efficiency of mainstream airlines and low-cost carriers: New evidence using bootstrap data envelopment analysis truncated regression. Journal of Air Transport Management, 38(Jun), 15–20. doi:10.1016/j.jairtraman.2013.12.013
- Leightner, J. E., & Lovell, C. K. (1998). The impact of financial liberalization on the performance of Thai banks. Journal of Economics and Business, 50(2), 115–131. doi:10.1016/S0148-6195(97)00073-8
- Luo, Y., Tanna, S., & De Vita, G. (2016). Financial openness, risk, and bank efficiency: Cross-country evidence. Journal of Financial Stability, 24(Jun), 132–148. doi:10.1016/j.jfs.2016.05.003
- Maudos, J., & Pastor, J. M. (2003). Cost and profit efficiency in the Spanish banking sector (1985–96): A non-parametric approach. Applied Financial Economics, 13(1), 1–12. doi:10.1080/09603100110086087
- Micco, A., Panizza, U., & Yañez, M. (2011). Bank ownership and performance. SSRN. IDB Working Paper no. 429. doi:10.2139/ssrn.1818718
- Miller, S. M., & Noulas, A. G. (1996). The technical efficiency of large bank production. Journal of Banking and Finance, 20(3), 495–509. doi:10.1016/0378-4266(95)00017-8
- Mohan, T. T., & Ray, S. C., (2004). Productivity growth and efficiency in Indian banking: A comparison of public, private, and foreign banks. Economics Working Papers. 200427. Retrieved from https://opencommons.uconn.edu/econ_wpapers/200427
- Mullineaux, D. J. (1978). Economies of scale and organizational efficiency in banking: A profit‐function approach. The Journal of Finance, 33(1), 259–280. doi:10.1111/j.1540-6261.1978.tb03403.x
- Olson, D., & Zoubi, T. A. (2011). Efficiency and bank profitability in MENA Countries. Emerging Market Review, 12(2), 94–110. doi:10.1016/j.ememar.2011.02.003
- Pastor, J., Perez, F., & Quesada, J. (1997). Efficiency analysis in banking firms: An international comparison. European Journal of Operational Research, 98(2), 395–407. doi:10.1016/S0377-2217(96)00355-4
- Phuong, L. T., Harvie, C., & Arjomandi, A. (2015, May 25–27). Does ownership affect bank performance? An analysis of Vietnamese banks in the post - WTO entry period. Paper presented at the 4th global business and finance research conference, Melbourne.
- Rangan, N., Grabowski, R., Aly, H. Y., & Pasurka, C. (1988). The technical efficiency of US banks. Economics Letters, 28(2), 169–175. doi:10.1016/0165-1765(88)90109-7
- Ray, S. (2007). Are some indian banks too large? an examination of size efficiency in indian banking. Journal Of Productivity Analysis, 27, 41-56 .
- Ray, S. C. (2004). Data envelopment analysis: Theory and techniques for economics and operations research. Cambridge: Cambridge university press.
- Ray, S. C., & Das, A. (2010). Distribution of cost and profit efficiency: Evidence from Indian banking. European Journal of Operational Research, 201(1), 297–307. doi:10.1016/j.ejor.2009.02.030
- Rhoades, S. A., & Rutz, R. D. (1982). Market power and firm risk: A test of the ‘quiet life’ hypothesis. Journal of Monetary Economics, 9(1), 73–85. doi:10.1016/0304-3932(82)90051-4
- Saha, A., & Ravisankar, T. (2000). Rating of Indian commercial banks: A DEA approach. European Journal of Operational Research, 124(1), 187–203. doi:10.1016/S0377-2217(99)00167-8
- Sathye, M. (2003). Efficiency of banks in a developing economy: The case of India. European Journal of Operational Research, 148(3), 662–671. doi:10.1016/S0377-2217(02)00471-X
- Sealey, C. W., & Lindley, J. T. (1977). Inputs, outputs, and a theory of production and cost at depository financial institutions. The Journal of Finance, 32(4), 1251–1266. doi:10.1111/j.1540-6261.1977.tb03324.x
- Seiford, L. M. (1996). Data envelopment analysis: The evolution of the state of the art (1978–1995). The Journal of Productivity Analysis, 7(2–3), 99–137. doi:10.1007/BF00157037
- Sherman, D. (2006). Data envelopment analysis explained. In J. Zhu (Ed.), In-service productivity management: improving service performance using data envelopment analysis (DEA) (pp. 49–89). Boston: Springer Science.
- Sherman, H. D., & Gold, F. (1985). Bank branch operating efficiency: Evaluation with data envelopment analysis. Journal of Banking and Finance, 9(2), 297–315. doi:10.1016/0378-4266(85)90025-1
- Simar, L., Lovell, C. A. K., & Vanden Eeckaut, P. 1994. Stochastic frontiers incorporating exogenous influences on efficiency. Discussion Papers 9403. Institut de Statistique, Universite Catholique de Louvain. doi:10.1124/mol.114.095356
- Simar, L., & Wilson, P. W. (2007). Estimation and inference in two-stage, semi-parametric models of production processes. Journal of Econometrics, 136(1), 31–64. doi:10.1016/j.jeconom.2005.07.009
- Singh, P. K., & Thaker, K. (2016). Dynamics of scale efficiency of Indian banks: A deterministic frontier approach. Journal of Developing Area, 50(3), 337–457. doi:10.1353/jda.2016.0113
- Sufian, F., & Habibullah, M. H. (2009). Determinants of banks profitability in a developing economy: Empirical evidence from Bangladesh. Journal of Business Economics and Management, 10(3), 207–217. doi:10.3846/1611-1699.2009.10.207-217
- Sunil, Kumar. (2008). . An Examination Of Technical, Pure Technical, and Scale Efficiencies in Indian Public Sector Banks Using Data Envelopment Analysis. Eurasian Journal Of Business and Economics, 1(2), 33–69.
- Tan, Y., & Floros, C. (2012). Bank profitability and inflation: The case of China. Journal of Economic Studies, 39(6), 675–696. doi:10.1108/01443581211274610
- Xue, M., & Harker, P. T. 1999. Overcoming the inherent dependency of DEA efficiency scores: A bootstrap approach (Unpublished Working Paper). Wharton Financial Institutions Center, University of Pennsylvania. Retreived from https://pdfs.semanticscholar.org/91b2/70b12f4eb72286e632d2b2212a2870589f4f.pdf
- Zardkoohi, A., & Kolari, J. (1994). Branch office economies of scale and scope: Evidence from saving banks in Finland.”. Journal of Banking and Finance, 18(3), 421–432. doi:10.1016/0378-4266(94)90001-9