
 ?Mathematical formulae have been encoded as MathML and are displayed in this HTML version using MathJax in order to improve their display. Uncheck the box to turn MathJax off. This feature requires Javascript. Click on a formula to zoom.
Abstract
This paper investigates the impact urbanization, industrialization, corruption, human development, energy consumption, and foreign direct investment (FDI) on carbon dioxide (CO2) emissions of 61 developing economies of the global south region of Asia, Africa, and Latin America during the period 1990–2015. The empirical results show that the effect of corruption on CO2 emissions is indeed heterogeneous and contradictory. Specifically, results exhibit that due to immature economic system, and policy paralysis, corruption penetrates the developing economies, and eventually cause carbon emission and pollution. Furthermore, results reveal that FDI guided by clean development mechanism and involved in emission reduction projects in the developing economies play a predominant role to curb the CO2 emission, pollution, and environmental degradation.
PUBLIC INTEREST STATEMENT
The relationship between economic development and pollution has been found to exhibit an inverted U-shape relationship. The weak governance structure, transparency in government mechanism and functioning affect this inverted U-shape relationship in a unique way inducing industrial-led pollution due to corruptive practices in the emerging economies. Using a panel data of 61 developing economies of the global south region of Asia, Africa, and Latin America, this paper estimates the impact of urbanization, industrialization, and corruption on carbon dioxide (CO2) emissions over the period 1990–2015. The study considers the impact of government accountability and transparency in government mechanisms, human development, energy consumption, and foreign direct investment on CO2 emissions. The results show strong evidence of the impact of urbanization and industrialization on CO2 emissions. Our findings confirm that an increase in per capita energy consumption and human development accelerates the high intensity of CO2 emission in global south region. Moreover, results reveal that improvements in governance integrity and transparency curb the carbon dioxide emission rates substantially.
1. Introduction
In recent years, burgeoning literature in environmental economics has focussed on the relationship between environmental degradation and corruption. The development policy community widely believes that eradicating corruption not only brings back growth but also helps in restoring environmental quality (Heckelman & Powell, Citation2010). However, past studies find that corruption reduces environmental stringency to a large extent (Cole, Citation2007; Lopez & Mitra, Citation2000; Mauro, Citation1995). Therefore, reduction in corrupt practices in decision making could be the best possible way to address the increasingly tangible threats of environmental degradation by framing efficient policy frameworks and adoption of suitable strategies (Lægreid & Povitkina, Citation2018; Payne, Citation1995).
Corruption and environmental degradation constitute a greater challenge for sustainable economic development in developing and lower developed countries (Seldadyo & De Haan, Citation2011; Q. Wang et al., Citation2015). However, corruption is often relating to some specific cases in developing or developed countries and hence it is hard to quantitatively measure the extent of corruption in a society. Therefore, under these circumstances, many organizations or studies tried to construct some indicators or proxy variables to investigate the corruption status (Zhang et al., Citation2016). Since the 1990s, numerous corruption indicators have been constructed to examine the link between corruption and macroeconomic factors, and environmental degradation. For instance, corruption index published by the World Bank,Footnote1 the Corruption Perception Index (CPI) published by the Transparency International (TI),Footnote2 and the corruption index in the International Country Risk Guide (ICRG) published by the Political Risk Services (PRS)Groups,Footnote3 have provided important instrument for empirical and quantitative research in environmental economics. Moreover, the OECD surveys, titled, “convention on combating bribery of foreign public officials in international business transactions and related documents”, indicate that while corruption is a common concern in both developed and developing countries, but comparatively it has a greater effect on CO2 emissions in developing than in the developed countries.Footnote4 Notwithstanding, the mechanics of corruption leading to CO2 emissions and pollution, because of the imperfect environmental regulation and the complexity of environmental issues, corruption runs deeply into legislation to law enforcement, and consequently affect the ecological systems and environmental quality.
In general, the literature has focused on the direct and positive effects of corruption on CO2 emissions using standards of environmental regulations, and the indirect effects of corruption employing its impact on economic growth (Aparicio et al., Citation2016; Choi, Citation2015; Hakkala et al., Citation2008; Mauro, Citation1995; Van Soest et al., Citation2016). Using the panel data of 94 countries for the period 1987–2000, Cole (Citation2007) examines the direct and indirect effects of corruption on carbon emissions and finds that corruption not only directly affects carbon emissions due to weak environmental regulations but also indirectly affects carbon emissions through economic growth. Corruption may make it difficult to implement environmental policies, and thus, can affect the levels of CO2 emissions. Callen and Long (Citation2015) find overwhelming evidence on the relationship between political networks, weak institutions, and election fraud. Winbourne (Citation2002) finds that corruption might contribute to the development of environmental damaging policies and practices. The literature on the linkage between corruption and economic growth indicates that power and economic interests affect corruption, and corruption causes a significant loss of socioeconomic benefits.
Shleifer and Vishny (Citation1993) argue that corruption is one of the most serious threats to good governance, proper development of economic systems and political stability. In non-OECD transitional developing countries, only an improving democracy has a significant effect on political and economic conditions leading to better environmental quality (Rodrik & Wacziarg, Citation2005). Banerjee et al. (Citation1997) explain why government bureaucracies are often associated with red-tape, corruption, and lack of incentives. As a result, corruption might set back economic and social development with misallocation of resources, higher transaction costs, political inefficiency, dilution of trade patterns and domestic vs. foreign investment. He also finds that the effect of corruption on CO2 emissions across countries are turning out to be complex, because of multiple measures of corruption, differences in economic attainments, diverse political settings, and different levels of CO2 emissions among countries.
A large number of theoretical and empirical studies have investigated the relationship between corruption and environmental quality (Fredriksson & Svensson, Citation2003; Fredriksson et al., Citation2004; Leitao, Citation2010; Lopez & Mitra, Citation2000; Welsch, Citation2004). In theoretical works, it has been argued that corruption is harmful to environmental quality through its negative effect on environmental regulation and policy stringency, which increases pollution and decreases environmental quality. Using theoretical frameworks, Fredriksson and Svensson (Citation2003), Fredriksson et al. (Citation2004) argue that corruption reduces the stringency of environmental regulations. It might be quite possible that the environmental quality affected by corruption is an important factor to explain the impact of corruption on economic growth. The pioneering work of Lopez and Mitra (Citation2000) examine the theoretical implications of government corruption and rent-seeking behavior under the existence of the Environmental Kuznets Curve (EKC). They find that although corruption does not likely to preclude the existence of an inverted U-shape EKC for any level of per capita income, however, the pollution levels because of the corruption in the government system always dominate the optimum level of social welfare. Damania et al. (Citation2003) explore the linkages between trade policy, corruption, and environmental policy, and find that corruption reduces environmental policy stringency. In a similar vein, “pollution heaven hypothesis (PHH)’ has gained much attention in recent days contends that pollution-intensive industries move from developed countries with stringent environmental regulations to developing countries with lax environmental regulations (Bu et al., Citation2011; M. Cole et al., Citation2011; Copeland & Taylor, Citation2004; Eskeland & Harrison, Citation2003).
Table summarizes the findings of previous studies related to urbanization, governance, and pollution across different countries’ contexts.
Table 1. Literature review summary
Our paper contributes to the existing literature in two ways: first, it demonstrates the effects of both urbanization and governance on carbon emission rates. Nevertheless, this paper evaluates the effect of urbanization and governance on pollution and the environmental degradation of the developing countries.Footnote5 Moreover, in place of governance, specifically, this study takes the combined effect of governance integrity and transparency upon the CO2 emission rates. The governance integrity measures government accountability with administration and quality of governance, whereas the transparency measures the overall mechanism in government functioning.Footnote6 Both parameters measure the level of governance of emerging economies such that they can directly or indirectly affect the CO2 emission rates. Furthermore, as the sample countries are from the global south region, and these countries show different levels of governance integrity with transparency index. Therefore, it is worthwhile to quantitatively assess the direct and indirect effect of urbanization and governance on CO2 emissions of global south countries. Using the system-GMM estimates to demonstrate the possible heterogeneity and endogeneity in addition to the commonly used simple OLS regression approach, this paper investigates whether the influence of urbanization and governance substantially raises the CO2 emissions rate in global south countries.
Second, it particularly focuses on the set of 61 developing economies from the global south region of Asia, Africa, and Latin America. The choice of these sets of developing economies is pertinent due to the urban development and ever-increasing pollution since the 1990s in this region. Moreover, according to the 2018 Revision of World Urbanization Prospects produced by the Population Division of the UN Department of Economic and Social Affairs (UN DESA) 55% of the world’s population lives in urban areas, which is further expected to increase to 68% by 2050. The urban population of the world has grown rapidly from 751 million in 1950 to 4.2 billion in 2018. Asia, despite its relatively lower level of urbanization, is home to 54% of the world’s urban population, whereas Africa is home to 13% of the total world urban population. Besides, projections show that urbanization combined with the overall growth of the world’s population could add another 2.5 billion people to urban areas by 2050, with close to 90% of this increase taking place in Asia and Africa. In the future, global south region countries, specifically, India, China, and Nigeria will account for 35% of the projected growth of the world’s urban population between 2018 and 2050. By 2050, it is projected that India will have added 416 million urban populations, followed by China 255 million and Nigeria 189 million.
Our empirical results exhibit the evidence of a positive and significant relationship between urbanization, industrialization, and carbon emissions in the global south region. We find that an increase in demand-based energy consumption contributes more to the CO2 emission. Empirical results suggest that the rising trend of pollution declines when the governance and political institutions improve. Furthermore, we find a positive and significant relationship between transparency in the government mechanism and CO2 emission, which suggests that corruption facilitates pollution in the emerging economies. Notwithstanding, we argue that pollution can be curbed largely by improving the governance and transparency in the government systems. Besides, results exhibit that FDI guided by the clean development mechanism (CDM) established by the Kyoto Protocol has reduced the carbon emission into a substantial level in the global south countries.
The rest of the paper is structured as follows. Section 2 outlines the empirical strategy, econometric specifications, and data description of the study. Section 3 discusses the empirical results, while Section 4 concludes the research findings.
2. Empirical strategy
This section first describes the econometric specification followed by a detailed description of data considered for the analysis.
2.1. Econometric specifications
In this section, we specify the empirical model to estimate the impact of human development index (HDI), foreign direct investment (FDI), urbanization, governance, transparency in the government functioning, and energy consumption on carbon emission rates across 61 developing economies of the global south region. Our empirical specification is given as follows:
where is the carbon dioxide emission of the country
for a year
.Footnote7 The
to
represent the vector of parameters representing variables such as urbanization (URB), primary energy consumption (PEC), governance integrity (GOI), transparency (TI), human development index (HDI) and FDI for country i in year t. Furthermore, the cross-section i varies over 61 developing economies of Asia, Africa, and Latin America, whereas t varies from 1990 to 2015. The developing counties are selected based on their income classification criteria of World Bank, 2017 (see Appendix A). Furthermore,
,
,
represent the country-specific, time-specific, and idiosyncratic error terms, which follow the usual assumptions of normal distributions. Furthermore, to estimate the impact of urbanization upon carbon emission, we incorporate the joint effects of governance integrity and transparency. Our specification after the introduction of the interaction factor is specified as follows:
where GOI×TI represents the interaction effect of governance (GOI) and transparency(TI). Moreover, the interaction effect captures the overall governance credibility and can be a better estimate to analyze the impact of urbanization on carbon dioxide emissions. Furthermore, as urbanization and industrial growth go hand-in-hand, and urban-led growth can capture the industrial-led growth, therefore, to evaluate the impact of industrialization upon CO2 emission, we estimate an alternative specification, where we incorporate the industrialization in the place of urbanization. Therefore, after introducing the industrialization variable, the empirical specification can be read as follows:
where INDit represents the industrialization of the country in the year
. Similarly, like EquationEquation (2)
(2)
(2) , we are also interested to estimate the impact of the interaction effect of government accountability and transparency. Therefore, our empirical specification can be read as follows:
2.2. Data sets
Our sample consists of 61 developing economies of the global south region of Asia, Africa, and Latin America over the period 1990–2015. We choose the countries based on the availability of data from 1990 to 2015. Data for our paper come from different sources. The dependent variable, carbon dioxide emission (CO2) measures the total amount of carbon dioxide emission from the total energy consumption measured in terms of million metric tonnes. The CO2 data is taken from the Energy Information Administration (EIA) database of the USA Government. Industrialization (IND) is defined as the industrial development and we measure it through industrial value-added as the percentage of GDP. Industrialization indicates the increase in net industrial output in terms of overall industrial growth in a year. Annual industrial growth is taken from the database of World Development Indicators (WDI), World Bank. Similarly, urbanization (URB) data are taken from the database of WDI, World Bank.Footnote8 Furthermore, primary energy consumption (PEC) data is taken from the energy information administration (EIA) database of the USA government.
Governance integrity (GOI) measures government and democratic accountability in terms of overall administration and quality of governance. The data of GOI is taken from the Heritage Foundation database. GOI is one of the important components of economic freedom and its score varies from zero to 100. For instance, a country with a score near 100 has a high level of governance standard. The Transparency Index (TI) shows the overall transparency in terms of government mechanism and functioning and it indicates the level of corruption prevailing in government systems. Moreover, the transparency index score varies from zero to 100, and its data is taken from the Williams index of transparency. The data of Foreign Direct Investment (FDI) is taken from WDI, World Bank. The human development index (HDI) is taken from the United Nations Development Programme (UNDP) database. The HDI score varies from zero to one. Countries score near to one exhibit the high human development conditions, and countries score close to zero indicate the low human development conditions.Footnote9
Figure 1. CO2 emissions and governance integrity (both in natural logs, 61 countries, 1990–2015)
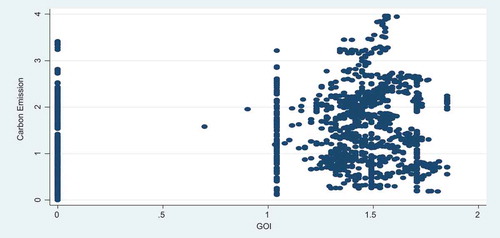
The governance integrity and transparency index are important components to measure the level of corruption in the developing countries. More specifically, the transparency index could be considered as a proxy variable to measure the level of corruption in developing countries. Figures and provide plots of (logged) CO2 emissions vs. governance integrity and transparency index, respectively. Figure indicates that as governance integrity improves then carbon emission facilitates to slow down gradually over the period 1990–2015. Similarly, the scatter plot and line diagram in Figure indicate that while transparency index improves, the rate of carbon emission supposed to be declined, however, it shows that while transparency in the Government system improves, the rate of carbon emission has increased. This suggests a robust investigation of the relationship between transparency in government mechanism and CO2 emission of the 61 developing economies in the global south region.
Figure 2. CO2 emissions and transparency index (both in natural logs, 61 countries, 1990–2015)
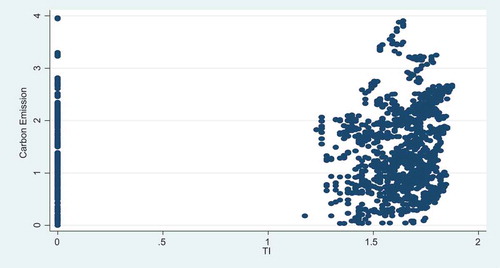
Table reports the descriptive statistics and correlation matrix of key variables when we take the full-sample data. The results indicate that there exists a positive and significant relationship between carbon dioxide emission and urbanization. Furthermore, results show that the coefficient of industrialization is positive and statistically significant. This indicates that urbanization leads to industrialization and carbon emission in the global south region, which threats to decrease the air quality and environmental standard of living. Notwithstanding, industrialization facilitate urbanization and the combined effect of industrialization and urbanization has significantly raised the carbon emission rates. Furthermore, one plausible explanation is that urban facilities in global south countries are growing rapidly with the expansion of infrastructure advancement, and also growing income facilities in rural and urban areas leading to more use of energy and technology. Eventually, the urbanization and industrialization cause an increase in energy consumption, which expedite the carbon emission rates. We find that transparency in government mechanisms has a negative correlation with urbanization but it does not have any significant correlation neither with industrialization nor with carbon dioxide emission. Interestingly, government integrity has a positive and significant correlation with urbanization, industrialization, and carbon emission. Thus, it suggests that an increase in urbanization and industrialization contributes to carbon emission both directly and indirectly, despite improved transparency in governance. Furthermore, results reveal that increase in human development leads to more urbanization, industrialization, and pollution as well. We find evidence of a positive relationship between transparency, accountability of government integrity and human development. Finally, we find a positive and significant correlation between FDI and most of the variables in our study except TI. This indicates that FDI moves through corrupt practices in the global south region, such that improvement in transparency of the government mechanism may deter FDI inflows to the region.
Table 2. Descriptive statistics and correlation of the key variables
3. Empirical results and discussions
We present the baseline result using OLS and quantile regression first, followed by a robustness check using the GMM estimator’s results and its analysis.
3.1. Baseline findings
Table reports baseline findings, considering full panel with OLS and quantile regressions. Our empirical analysis considers quantile regressions at 50th and 75th quantiles. EquationEquation (1)(1)
(1) is regressed with different specifications including time and country-specific effects. In specification 1, we find that the OLS estimates of urbanization and carbon emission rates coefficients are negative and significant. However, results further indicate a positive and significant relationship between urbanization and emission rates, while trimming data by 50% and 25%, respectively (see Columns 4 and 5, Table ). This shows that urbanization, especially at the later stages of development, contributes more to carbon emission. Similarly, the coefficients of PEC are found to be positive and significant, which indicates that an increase in overall energy consumption is positively contributing to carbon emission (see Columns 1 to 5). Besides, results exhibit a positive and significant relationship between transparency index and carbon emission rate. This suggests that politically stable regimes induce more industrial and urban-led growth, which results in environmental degradation. Similarly, the estimate of the coefficient of HDI indicates that improvements in human living conditions lead to an increase in pollution in the region. Result suggests that an increase in primary energy consumption followed by rising economic opportunity, better access to personal vehicles lead to more atmospheric pollution (see Columns 1 to 6).
Table 3. Baseline findings, determinants of CO2 emission (full-panel)
Nevertheless, we can get more insights into the results by introducing the interaction effect of governance and transparency parameters. In order to do so, we introduce the interaction effect of government integrity and government transparency. The coefficient of the interaction between governance integrity and transparency index is found to be negative and significant, while we control the time and country-specific effects. It indicates that an increase in governance accountability and transparency reduce carbon emission rates significantly. Next, the coefficients of HDI are found to be positive and significant over most of the specifications, which state that increases in human development lead to more pollution due to higher energy consumption possibly due to more vehicle usages, domestic energy consumption, and rising per-capita income (see Columns 1 to 5, Table ). The coefficient estimates of FDI exhibits a positive and significant relationship with carbon emission. More specifically, in specifications 1 and 2, results indicate that a 1% increase in FDI has increased the carbon emission rate from 0.022% to 0.048%, respectively.
Nevertheless, in quantile regression, the coefficients of FDI are negative and significantly different from zero (see Columns 3, 5, and 6, Table ). This suggests that FDI has substantially decreased the carbon emission rates of the developing economies of the global south region. One plausible inference is coming from this empirical exercise that most of the developing economies in the global south region are participants of clean development mechanism (CDM) established by the Kyoto Protocol (Intergovernmental Panel on Climate Change [IPCC], Citation2007), which provides emission reduction projects and generate certified emission reduction units (CERs) may be traded in emissions trading schemes. Besides, CDM objectives to allow the annex I and II countries to provide financial and technical support to the “economies in transition” (EITs), developing economies and non-annex I countries (mostly low income) to assist them in reducing their greenhouse gas emission (climate change mitigation) and manage the impacts of climate change (climate change adaptation).Footnote10 Eventually, empirical results exhibit that foreign capital in the way of FDI from annex I and II countries to the developing and low developed countries have directly and indirectly curbing the carbon emission rates of the global south region. However, the substantial effects in reducing the carbon emission rates because of foreign capital could be quite comprehensive, while we discuss the empirical results over different sub-regions of global south countries. The sub-regions empirical results are discussed in the Sub-section 3.3.
3.2. Baseline findings with industrialization
To estimate the impact of industrialization on carbon emission, we specify an alternative empirical specification. Furthermore, we evaluate the impact of industrialization in the place of urbanization, to see how changing economic structure, i.e., industrial growth affects carbon emission rate in the global south countries. Table reports the baseline and quantile regression results for full-panel. The empirical results report that industrialization exhibits a positive impact on carbon emission rate while incorporating both time and country-specific effects. This suggests that industrial-led growth in the region leads to more carbon emission rates (see Columns 1 and 2).
Table 4. Baseline findings, determinants of CO2 emission (full-panel)
Similar to earlier specifications, we find positive and significant estimates of PEC and industrial growth led to industrialization across different specifications (see Columns 1 to 6). The results further support the positive relationship between HDI, and PEC, TI with carob emission rates. It states that improvements in both human developments through per-capita income and governance transparency induce more energy consumption in the long-run, which in turn increases the carbon emission in the developing countries. The significant estimates of FDI suggest that higher the inflows of foreign capital and industrial-led growth, higher will be the emission rate in the developing economies of the global south region (see Columns 1 and 2, Table ). Notwithstanding, in the quantile regression, the coefficient estimates of FDI are found to be negative and significantly different from zero (see, Columns 3 and 5, Table ). This indicates that FDI followed by the guidelines of the CDM has substantially reduced the carbon emission rates of the developing countries. Furthermore, followed by the CDM established by the Kyoto Protocol (IPCC, Citation2007), the annex I and II countries must be taken part in certain emission reduction projects in developing economies. In sum, FDI from advanced industrialized countries curbs the energy consumption and carbon emission rates in the emerging markets. Moreover, another important implication of the findings is that some emerging markets like India and China allow those FDI who may produce fewer emissions.Footnote11
On the other hand, the effect of industrialization on carbon emission might change, while we incorporate the governance interaction effect with the transparency index. To evaluate the interaction effect, EquationEquation (4)(4)
(4) is further estimated and the results are reported in Table . The reported results in Column 1, Table indicate that the coefficient of industrialization is positive and significant at the conventional level of significance. Furthermore, coefficients of PEC over different specifications exhibit positive and statistically significant (Columns 1 to 6). The important variables of interest, i.e., the interaction effect of governance integrity and transparency exhibit positive signs at the different percentile of quantile regression. This suggests that the higher the interaction effect, the higher would be the carbon emission rate. However, the coefficient of the interaction effect is negative and significant at OLS estimates, while the specification controlling time and country-specific effect. This suggests that better governance with transparency in the Govt. system help in reducing the carbon emission rate substantially (see Column 2, Table ). Moreover, empirical results of the interaction effect of governance integrity and transparency index at OLS and quantile regressions are contradictory (see Columns 2, 5, and 6 in Tables and ). The quantile regression, relative to the OLS regression has certain advantages is that the quantile regression estimates are more robust against outliers in the response measurements.Footnote12 Eventually, quantile regression results are widely accepted as it considers the median-based regression at different points in the conditional distribution of the explained variable. Thus, based on this argument, we could consider accepting the results obtained by quantile regression. Empirical results indicate that governance integrity and transparency index interaction effect has surged the carbon emission. Another implication is that despite these factors help in reducing the emission rates both have significantly raised the carbon emission and pollution. This also suggests that there are certain loopholes in government transparency and governance accountability. It could be perceived that the developing economies over the period attempt to reduce their corruption by improving the transparency in the government system. However, the reduction in corruption cannot starkly reduce carbon emission and pollution, rather, it surges the pollution, and also this validates our empirical results.
3.3. Baseline findings, sub-regions
To estimate the relationship between urbanization and carbon emissions rate, we further divide the full-panel into different sub-panels based on World Bank income classification criteria.Footnote13 The sub-panels results are reported in Table . The results in Column 2 and 3 show that the coefficient of urbanization is negative and significant in the case of upper-middle Asian economies, whereas it is positive and significant in the case of lower-middle African and Latin American regions. One plausible reason could be that while upper-income Asian economies may be doing a significant amount of investment in green energy projects, but low developing regions of Africa and Latin America may be facing a significant amount of deforestation due to the rapid expansion of urbanization. Furthermore, the increase in PEC has a positive and significant influence on emission intensity across all sub-regions (see Columns 1 to 4). This suggests that a huge increase in coal, oil, and natural gas consumption of the developing economies has precipitated CO2 emission and environmental degradation.
Table 5. Baseline findings, determinants of CO2 emission (sub-panels)
Next, we estimate the alternative specification, EquationEquation (3)(3)
(3) where industrialization is taken as the explanatory variable, in place of the urbanization. The empirical results show that industrialization has a positive effect on carbon emission, especially in the Asian economies (see Columns 5 and 6, Table ). This suggests that industrialization facilitates urbanization, and infrastructure development in the Asian region, which further increases the use of energy consumption specifically oil and gas consumption. In sum, the reckless use of oil and gas consumption to raise industrial expansion for economic growth brings unwarranted carbon emission and degrades the environment. As we discussed earlier, we further find that the coefficients of PEC are positive and significant across all sub-panels. This means that the rapid expansion of auto sectors in the emerging markets has significantly raised the non-renewable energy like oil and gas consumption, which further hike the pollution. Empirical results exhibit that the improvement in governance integrity reduces the carbon emission in the low developing regions of Asia, Africa, and Latin America. Similarly, the transparency index has increased the carbon emission and consequently pollution level in the Asian developing countries. However, it reduces the carbon emission and pollution levels in middle Africa and Latin American countries substantially. The result in second and third specifications suggests that an improvement in human development has reduced the carbon emission rates in the Asian and Latin American countries.
Nevertheless, we apply the interaction effect between governance and transparency index, to evaluate its role on carbon emission and environmental degradation across different sub-panels of the global south countries. Table reports the interaction effect results. Results exhibit that the coefficients of urbanization are negative and significantly different from zero (see Columns 1, and 2, Table ). This indicates that urbanization in the Asian economies reduces the carbon dioxide emission rate substantially. This is possible because especially China and Japan are doing huge investments in the green economy project to avoid the negative consequences of erratic urbanization. On the other hand, the effect of energy consumption is positive and significant across all sub-groups of developing economies. This indicates these developing economies are using a huge amount of non-renewable recourses to increase their economic growth to reduce poverty. Furthermore, the results suggest that an increase in the quality of governance and transparency in the Govt. system has reduced the carbon emission rate substantially. This further suggests that a credible governance structure can play a key role in environmental sustainability.
Table 6. Baseline findings, determinants of CO2 emission (sub-panels)
The negative and significant coefficients of FDI in the third, fourth, and eighth specifications suggest that FDI has considerably reduced the pollution in the African and Latin American countries. It further suggests that as these countries are receiving a lack of foreign funds due to their adverse regional effect (Asiedu, Citation2002), the contribution of FDI to increase pollution is considerably less. This result is consistent with the earlier findings of full-panel results. Notwithstanding, although these region has received less amount of FDI, however, FDI guided by the CDM established by the Kyoto Protocol reduces the carbon emission of the FDI-recipient economies in the African and Latin America.
Nevertheless, we find other supporting evidence from the alternative specification in the consequent model, where industrialization is positively contributing to pollution in the Asian economies (see Columns 5 and 6, Tables and ). The low developing Asian regions experience sporadic increases in PEC, FDI, HDI, and population growth after 2000. Therefore, these collective forces have a considerably negative consequence to accelerate pollution, global warming, and climate change. Furthermore, results reveal that across most of the specifications, the interaction effects are negative and significantly different from zero. This suggests that improvement in governance and reduction in corruption curb the pollution rate substantially, all else is the same. Specifically, in our opinions, when the economy stays at a highly developed stage, and environmental regulations and protection recognition of citizens in the society would be improved. In that stage, lower corruption may lead to a decrease in carbon emissions, which is similar to the results of Jetter et al. (Citation2015). Notwithstanding results also validate that the region which cannot control the corruption due to bad governance and low transparency in the system experience higher CO2 emission and pollution (see Column 6, Table ). Eventually, we can say that the effect of corruption on CO2 emissions in developing countries appears dependent on the level of government integrity and transparency in the government mechanism and functioning.
3.4. Robustness checks
We need to consider the endogeneity issues in the empirical model, which is present in the basic OLS and quantile regression. To avoid the endogeneity problem, we start with estimating EquationEquations (1)(1)
(1) –(Equation4
(4)
(4) ) by introducing Blundell and Bond (Citation2000) system Generalized Methods of Moments (GMM) estimates. The system-GMM estimate has the advantages over difference GMM because earlier one includes more instruments as compared to the later. System GMM estimators replace the Difference GMM estimators by a system of instruments in levels along with lagged first difference used as the instruments (Selaya & Sunesen, Citation2012). Furthermore, the validity of the system GMM can be assessed by analyzing the Sargan over-identification test and autocorrelation of the residuals.
Our empirical results show that coefficients of lagged values of dependent variables are positive and significant for all sub-regions (see Columns 1 to 5, Table ). Empirical results reveal that the coefficient of urbanization is positive and significant in the case of full-panel (see Column 1, Table ). However, the impact of urbanization is changing over different sub-panels due to regional differences. Furthermore, we find a positive and significant relationship between PEC and carbon emission across all sub-panels. This suggests that these countries are using a huge amount of energy consumption, i.e., the especially a maximum amount of non-renewable energy recourses are using to build their infrastructures like rail, road, and aviation, etc. As these countries engage in using huge energy consumption such that it facilitates to increase CO2 emission, pollution, and climate change.
Table 7. Determinants of CO2 emission
Nevertheless, in most of the specifications across different sub-groups of the countries, the estimates of HDI, FDI and GOI exhibit insignificant coefficients. However, we notice a positive and significant relationship between transparency index and carbon dioxide emission across most of the sub-groups of different sets of countries. This suggests that a slight improvement in transparency in the government mechanism may cause carbon emissions over the year due to higher urban led growth (see Columns 1 to 3, and 5, Table ). This means that in our opinions, in the early stage of economic development, the economic foundation in a country is relatively weaker. Therefore, under these circumstances, the prevalence of corruption may rapidly break the economic system, which may eventually cause CO2 emissions and environmental degradation to become more serious. As we discussed before, we further estimate EquationEquation (2)(2)
(2) by replacing industrialization in place of urbanization. For most of the sub-regions, our empirical results reveal that industrialization has no significant relationship with carbon emissions. However, we find that a 1% increase in industrialization leads to 0.029% increase in carbon emission for the full-panel of countries. This suggests that industrial led growth in developing countries leads to more carbon emission and pollution (see, Column 1, Table ).
Table 8. Determinants of CO2 emission
Next, for all sub-regions of countries, empirical results show that coefficients of HDI and FDI exhibit no significant estimates. Furthermore, for low developing economies of Asia, we find that an increase in government transparency leads to more carbon emission rates. It indicates that a transparent government mechanism induces industrial growth, which leads to more pollution-led development in the low developing economies in Asia (see Column 2, Table ). Also, we analyze the impact of urbanization on carbon emission by introducing the interaction effect of governance integrity and transparency. The results of estimated regression EquationEquation (2)(2)
(2) show that the coefficients of urbanization are positive and significantly different from zero in the case of the full-panel of countries. However, in the case of a highly developing Asian region, the effect is reversed. In the presence of interaction effect, the relationship between human development and carbon emission is negative and significantly different from zero. This suggests that improvement in human development conditions potentially reduces the carbon emissions of developing countries (see Column 1, Table ). Furthermore, we find that the post estimation system-GMM results are found to be robust and consistent for most of the specifications.
Table 9. Determinants of CO2 emission
On the other hand, we empirically analyze the impact of industrialization on CO2 emission by including the interaction effect of governance integrity and transparency. The system-GMM estimated results show that industrialization has a positive and significant impact on carbon emission (see Table ). This suggests that industrial development through infrastructure advancement causes the expansion of urban and rural areas, which subsequently increase the living standard of the citizens across most of the emerging economies. Thus, the direct vs indirect linkage between industrialization and urbanization causes a cyclical and unwarranted demand for energy consumption. As a result, the rapid growth in industrialization may bring about increased CO2 emissions.
Table 10. Determinants of CO2 emission
The results of the interaction effect show that improvement in governance and transparency in the government system reduces carbon emissions substantially. However, its effects are considerably less in the full-panel of developing countries. One vital reason could be that, as most of the 61 sample countries are underdeveloped countries, and these countries follow the process of erratic and unsystematic urbanization, default governance, and lack of credibility in the government system. Besides, in our opinions, in the early stage of economic development, the political and economic institutions in a country are often relatively weaker and government order has not been well established. Under these circumstances, the prevalence of corruption is not completely wiped out and it may break the immature economic system. Therefore, improvement in transparency of the government mechanism and functioning may eventually curb CO2 emissions, but not up to a large extent. Furthermore, results exhibit that the interaction effects are not significant for the rest of the sub-regions of different sets of countries. Similarly, we find a very marginal positive impact of FDI on carbon emissions in the case of full-panel of countries (see Column 1, Tables and 1). This suggests that as the environmental regulations are strictly followed by some emerging economies in Asia and upper-middle Asia, the effect of FDI on carbon emission is considerably less. More specifically, the south Asian and upper-middle Asian countries are inviting the MNCs from annex I and II countries, those are usually pass through the environmental standards, and willing to invest in the CDM emission reduction projects followed by Kyoto Protocol. As a result, FDI does not necessarily bring negative consequences in the form of increasing CO2 emissions and pollution to the FDI-recipient countries.
Looking at the coefficients of the interaction between governance integrity and transparency (TI), and human development (HDI), we can say that a credible government mechanism and curb in corruption lead the countries towards the sustainable human development, which in turn reduces the carbon emission rates significantly (see Columns 1, 2 and 3, Table ). Overall, results exhibit that the carbon emission rate has been considerably less in the Asian countries as compared to the African and Latin American countries. This indicates that compared to the African and Latin American regions, the Asian growing economies follow stringent environmental laws to controlling deforestation in recent years.
4. Conclusions
In this paper, we have analyzed the role of industrialization, urbanization, and corruption on carbon dioxide emission rates via different channels. Utilizing indicators like human development, foreign direct investment (FDI), governance integrity, and transparency being used the proxy measure of corruption; we find a positive and significant relationship between urbanization, industrialization, and carbon emission across the 61 developing economies of the global south region. Empirical results reveal a positive relationship between transparency in government mechanism and carbon emission, indicating the role of corruption to raise the pollution of emerging economies. Eventually, corruption and corrupt environmental policies have substantially increased carbon emission and pollution. Furthermore, we find that FDI curbs the carbon emission rates significantly. This indicates that FDI guided by CDM established by Kyoto Protocol participates in reducing the carbon emission reduction projects, specifically renovating the power plants or installing solar or hydroelectricity plants in developing countries. Therefore, FDI involved in CDM projects has reduced CO2 and GHG emissions and pollution to a large extent. Moreover, results also suggest that FDI significantly reduces the carbon emission rates of upper-middle Africa and Latin American countries. Nevertheless, empirical results exhibit that human development and rapid growth in demand-based energy consumption, migration to cities facilitate higher pollution in developing countries. Our empirical results explain the predominant role of governance and transparency in government mechanisms in curbing CO2 emissions. However, results exhibit a mixed impact of governance integrity and transparency on curbing CO2 emission rates of the developing economies. Specifically, our findings suggest that the economy at the initial stage of economic development cannot fully implement government policies to wipe out corruption in the government system of the developing economies. Therefore, under this circumstance, the mere presence of corruption and policy paralysis rapidly breaks the immature and fragile economics system, which causes CO2 emission and environmental degradation.
From a policy perspective, we find that the effect of corruption in terms of governance integrity and transparency are found to be more visible in some high-income countries in Asia, Africa, and Latin America. By reducing corruption, high-income economies could be able to attain environmental sustainable growth. At the same time, high as well as low-income developing economies of the global south could focus on alternative renewable sources of energy like solar, wind, and thermal. Although, our focus was on two important aspects of governance: integrity and transparency, yet these measures deemed to be insufficient to measure the specific forms of environmental governance to address the corruption of developing countries. Future research could look into these specific aspects of corruption while addressing the environmental challenges of the developing economies.
Acknowledgements
We would like to thank Salvatore Ercolano, Editor of the journal for giving us a chance to revise this paper. We are thankful to both anonymous referees for their valuable comments and insightful suggestions, which enabled to improve the quality of this paper into a large extent.
Additional information
Funding
Notes on contributors
Devi Prasad Dash
Devi Prasad Dash is a faculty in the Economics and Public Policy area, Indian Institute of Management Rohtak, India. He has obtained a Ph.D. degree in Economics from the Indian Institute of Technology, Ropar, and a master’s degree in applied economics from Pondicherry University. He can be contacted at [email protected]

Smruti Ranjan Behera
Smruti Ranjan Behera is working as a faculty of Economics in the Dept. of Humanities and Social Sciences, Indian Institute of Technology Ropar, India, where he teaches econometrics, international economics, urban economics, and applied econometrics and doing research in FDI-technology spillover, urban and spatial economics, and open economy macroeconomics. He can be contacted at [email protected]
D. Tripati Rao
D. Tripati Rao is a faculty in the Business Environment area, Indian Institute of Management Lucknow, India
Narayan Sethi
Narayan Sethi is a faculty in the Dept. of HSS, National Institute of Technology Rourkela, India
Nanthakumar Loganathan
Nanthakumar Loganathan is a faculty in the Azman Hashim International Business School, University Technology Malaysia, Malaysia
Notes
1. http://data.worldbank.org/indicator/IQ.CPA.TRAN.XQ.
2. http://www.transparency.org/.
3. http://www.prsgroup.com/about-us/our-two-methodologies/icrg. Note that ICRG staff collect political information and financial and economic data and convert these into risk points for each individual risk component on the basis of a consistent pattern of evaluation. The political risk assessments including corruption are made based on the subjective analysis of the available information (see, Zhang et al., Citation2016). Furthermore, Zhang et al. (Citation2016) used the ICRG data to construct the democratic accountability variable, and studied the effect of corruption on CO2 emission in APEC countries.
5. A bad environmental quality connotes the evidence of pollution in the countries. Since carbon emission constitutes the highest percentage among the polluting particles emitting to the air, we consider carbon emission as the proxy for pollution in this paper. Notwithstanding, if the governance of the developing countries is very poor then it has a bad consequence in the form of increasing the pollution and degrade the environmental condition. This further aggravates the CO2 emissions and greenhouse gas emissions, etc.
6. See, Section 2, and Appendix A, Table , for detailed discussion and construction of the variables.
7. Note that this paper specifically investigates relationship between carbon emission rates with the set of regressors discussed in EquationEquation (1)(1)
(1) . Moreover, in addition to the explanatory factors like HDI, FDI, URB, if the governance and transparency index of the developing countries is poor means the countries have serious loopholes in the government system. The governance indicator measures the government accountability in terms of administration and quality of governance. From the governance standard, we can presume, whether a country has an effective government system or not. An economy without an effective government mechanism impacts economic growth negatively. Similarly, transparency index indicates the level of corruption in the government systems. Both governance and transparency connote the quality of government mechanism in the system. Hence, these factors also directly or indirectly signify the level of corruption in the economy. Low degree of governance also indicates the high level of corruption in an economy. Therefore, if the level of corruption is high and if the policies are not properly regulated then it has serious negative consequences. The negative consequences of governance and transparency can be easily observed through the pollution and GHG emission of the developing countries. More specifically, in order to measure the level of environmental air pollution across the sample developing economies, we consider the CO2 emission as proxy variable in place of pollution.
8. Note that in place of urbanization, we have simply taken the number of people living in urban areas. Moreover, due to unavailability of the data across 61 developing countries, we cannot incorporate the other dimension of urbanization like distance of city centre to the urban households, urban facilities in terms of physical (road, rail, and air connectivity) and technical infrastructures (mobile/telephone, and internet access per 1000 inhabitants), pedestrian areas, waste disposal facility, urban traffic plan, etc.
9. See Appendix A, Table for detailed description of the variables.
10. Annex I countries include 43 parties to the united nations framework convention on climate change (UNFCC) including the European union. These parties are classified as industrialized developed countries and “economies in transition” (EITs). The 14 EITs are the former centrally-planned (Soviet) economies of Russia and eastern Europe. Similarly, Annex II of the parties listed in annex I of the convention, and 24 are also listed in annex II of the convention, including the European union. In addition, annex II parties include countries from the members of the organization for economic cooperation and development (OECD). Non-annex I parties to the UNFCC are mostly low-income developing countries. Least-developed countries (LDCs) include 49 parties to the UNFCC are low-income countries, and are given very special status under the treaty because of their limited capacity to adopt the effects of climate change.
11. The Kyoto Protocol´s Clean Development Mechanism (CDM) allows the industrialised countries in reducing national carbon emissions mitigation projects in developing countries, such as renovating power plants or installing solar panels. India is one of the world´s largest hosts of clean development projects. From 2003 to 2011, a total of 2,295 projects—around one-quarter of the global total—had been registered with India´s Designated National Authority for the Clean Development Mechanism. For instance, China and India has registered five coal-fired electricity plants with the CDM projects. The five plants are eligible to receive 68.2 million CERs over a 10-year period with an estimated value of 661 million euros ($919 million) at a CER price of 9.70 euros. See http://cdmpipeline.org/for data on CDM projects. In addition, for further details, see Benecke (Citation2009).
12. Standard OLS summarize the average relationship between a set of regressors and the explained variable based on the conditional mean function E(y|x). This provides only a partial view of the relationship. However, when we are interested in describing the relationship at different points in the conditional distribution of y, quantile regression provides better robust results in that case. Notwithstanding, apart from the conditional mean function of linear regression, we may consider the relationship between the regressors and explained variable using the conditional median function Qq (y|x), where the median could be the 50th percentile, or quantile q, of the empirical distribution. The quantile regression estimator is asymptotically normally distributed. Furthermore, median regression is more robust to outliers than least squares regression, and is semiparametric as it avoids assumptions about the parametric distribution of the error process.
13. See Appendix A, Table for detailed classification of countries.
References
- Adu, D. T., & Denkyirah, E. K. (2017). Education and economic growth: A co-integration approach. International Journal of Education Economics and Development, 8(4), 228–24. https://doi.org/10.1504/IJEED.2017.088815
- Aparicio, S., Urbano, D., & Audretsch, D. (2016). Institutional factors, opportunity entrepreneurship, and economic growth: Panel data evidence. Technological Forecasting and Social Change, 102, 45–61. https://doi.org/10.1016/j.techfore.2015.04.006
- Asiedu, E. (2002). On the determinants of foreign direct investment to developing countries: Is Africa different? World Development, 30(1), 107–119. https://doi.org/10.1016/S0305-750X(01)00100-0
- Banerjee, M. R., Burton, D. L., & Depoe, S. (1997). Impact of Sewage sludge application on soil biological characteristics. Agriculture, Ecosystems & Environment, 66(3), 241–249. https://doi.org/10.1016/S0167-8809(97)00129-1
- Benecke, G. (2009). Varieties of carbon governance: Taking stock of the local carbon market in India. Journal of Environment and Development, 18(4), 346–370. https://doi.org/10.1177/1070496509347085
- Bernauer, T., & Koubi, V. (2009). Effects of political institutions on air quality. Ecological Economics, 68(5), 1355–1365. https://doi.org/10.1016/j.ecolecon.2008.09.003
- Bhattarai, M., & Hammig, M. (2001). Institutions and the environmental Kuznets curve for deforestation: A cross-country analysis for Latin America, Africa, and Asia. World Development, 29(6), 995–1010. https://doi.org/10.1016/S0305-750X(01)00019-5
- Biswas, A. K., Farzanegan, M. R., & Thum, M. (2012). Pollution, shadow economy and corruption: Theory and evidence. Ecological Economics, 75, 114–125. https://doi.org/10.1016/j.ecolecon.2012.01.007
- Blundell, R., & Bond, S. (2000). GMM estimation with persistent panel data: An application to production functions. Econometric Reviews, 19(3), 321–340. https://doi.org/10.1080/07474930008800475
- Bu, Y., Takano, T., Nemoto, K., & Liu, S. (2011). Research progress of ammonium transporter in rice plants. Genomics and Applied Biology, 2(3). DOI: 10.5376/gab.2011.02.0003
- Callen, M., & Long, J. D. (2015). Institutional corruption and election fraud: Evidence from a field experiment in Afghanistan. American Economic Review, 105(1), 354–381. https://doi.org/10.1257/aer.20120427
- Candau, F., & Dienesch, E. (2017). Pollution haven and corruption paradise. Journal of Environmental Economics and Management, 85, 171–192. https://doi.org/10.1016/j.jeem.2017.05.005
- Chang, S. C., & Chang, T. Y. (2010). The relationships between corruption and pollution on corruption regimes. Economics Bulletin, 30(3), 1942–1949. http://www.accessecon.com/Pubs/EB/2010/Volume30/EB-10-V30-I3-P177.pdf
- Choi, Y. (2015). The role of intermediation on the international aid for the governance of technical training program. Technological Forecasting and Social Change, 96, 32–39. https://doi.org/10.1016/j.techfore.2014.12.004
- Cole, M., Lindeque, P., Halsband, C., & Galloway, T. S. (2011). Microplastics as contaminants in the marine environment: A review. Marine Pollution Bulletin, 62(12), 2588–2597. https://doi.org/10.1016/j.marpolbul.2011.09.025
- Cole, M. A. (2007). Corruption, income, and the environment: An empirical analysis. Ecological Economics, 62(3–4), 637–647. https://doi.org/10.1016/j.ecolecon.2006.08.003
- Cole, M. A., Elliott, R. J., & Fredriksson, P. G. (2006). Endogenous pollution havens: Does FDI influence environmental regulations? Scandinavian Journal of Economics, 108(1), 157–178. https://doi.org/10.1111/sjoe.2006.108.issue-1
- Copeland, B. R., & Taylor, M. S. (2004). Trade, growth, and the environment. Journal of Economic Literature, 42(1), 7–71. https://doi.org/10.1257/.42.1.7
- Damania, R., Fredriksson, P. G., & List, J. A. (2003). Trade liberalization, corruption, and environmental policy formation: Theory and evidence. Journal of Environmental Economics and Management, 46(3), 490–512. https://doi.org/10.1016/S0095-0696(03)00025-1
- Eskeland, G. S., & Harrison, A. E. (2003). Moving to greener pastures? Multinationals and the pollution haven hypothesis. Journal of Development Economics, 70(1), 1–23. https://doi.org/10.1016/S0304-3878(02)00084-6
- Fredriksson, P. G., & Svensson, J. (2003). Political instability, corruption and policy formation: The case of environmental policy. Journal of Public Economics, 87(7–8), 1383–1405. https://doi.org/10.1016/S0047-2727(02)00036-1
- Fredriksson, P. G., Vollebergh, H. R., & Dijkgraaf, E. (2004). Corruption and energy efficiency in OECD countries: Theory and evidence. Journal of Environmental Economics and Management, 47(2), 207–231. https://doi.org/10.1016/j.jeem.2003.08.001
- Goel, R. K., Herrala, R., & Mazhar, U. (2013). Institutional quality and environmental pollution: MENA countries versus the rest of the world. Economic Systems, 37(4), 508–521. https://doi.org/10.1016/j.ecosys.2013.04.002
- Hakkala, K. N., Norbäck, P. J., & Svaleryd, H. (2008). Asymmetric effects of corruption on FDI: Evidence from Swedish multinational firms. The Review of Economics and Statistics, 90(4), 627–642. https://doi.org/10.1162/rest.90.4.627
- Heckelman, J. C., & Powell, B. (2010). Corruption and the institutional environment for growth. Comparative Economic Studies, 52(3), 351–378. https://doi.org/10.1057/ces.2010.14
- Intergovernmental Panel on Climate Change (IPCC). 2007. Climate change. http://www.ipcc.ch/publications_and_data/ar4/wg1/en/contents.html
- Ivanova, K. (2010). Corruption and air pollution in Europe. Oxford Economic Papers, 63(1), 49–70. https://doi.org/10.1093/oep/gpq017
- Jetter, M., Agudelo, A. M., & Hassan, A. R. (2015). The effect of democracy on corruption: Income is key. World Development, 74(C), 286–304. https://doi.org/10.1016/j.worlddev.2015.05.016
- Koyuncu, C., & Yilmaz, R. (2009). The impact of corruption on deforestation: A cross-country evidence. The Journal of Developing Areas, 42(2), 213-222. doi:10.1353/jda.0.0010.
- Krishnan, S., Teo, T. S., & Lim, V. K. (2013). Examining the relationships among e-government maturity, corruption, economic prosperity, and environmental degradation: A cross-country analysis. Information & Management, 50(8), 638–649. https://doi.org/10.1016/j.im.2013.07.003
- Lægreid, O. M., & Povitkina, M. (2018). Do political institutions moderate the GDP-CO2 relationship? Ecological Economics, 145, 441–450. https://doi.org/10.1016/j.ecolecon.2017.11.014
- Leitao, A. (2010). Corruption and the environmental Kuznets curve: Empirical evidence for sulfur. Ecological Economics, 69(11), 2191–2201. https://doi.org/10.1016/j.ecolecon.2010.06.004
- Lopez, R., & Mitra, S. (2000). Corruption, pollution, and the Kuznets environment curve. Journal of Environmental Economics and Management, 40(2), 137–150. https://doi.org/10.1006/jeem.1999.1107
- Mauro, P. (1995). Corruption and growth. Quarterly Journal of Economics, 110(3), 681–712. https://doi.org/10.2307/2946696
- Ozturk, I., & Al-Mulali, U. (2015). Investigating the validity of the environmental Kuznets curve hypothesis in Cambodia. Ecological Indicators, 57, 324–330. https://doi.org/10.1016/j.ecolind.2015.05.018
- Payne, R. A. (1995). Freedom and the Environment. Journal of Democracy, 6(3), 41–55. https://doi.org/10.1353/jod.1995.0053
- Pellegrini, L., & Gerlagh, R. (2006). Corruption, democracy, and environmental policy: An empirical contribution to the debate. The Journal of Environment & Development, 15(3), 332–354. https://doi.org/10.1177/1070496506290960
- Rodrik, D., & Wacziarg, R. (2005). Do democratic transitions produce bad economic outcomes? American Economic Review, 95(2), 50–55. https://doi.org/10.1257/000282805774670059
- Sahli, I., & Rejeb, J. B. (2015). The environmental Kuznets curve and corruption in the MENA region. Procedia-Social and Behavioral Sciences, 195, 1648–1657. https://doi.org/10.1016/j.sbspro.2015.06.231
- Selaya, P., & Sunesen, E. R. (2012). Does foreign aid increase foreign direct investment? World Development, 40(11), 2155–2176. https://doi.org/10.1016/j.worlddev.2012.06.001
- Seldadyo, H., & De Haan, J. (2011). Is corruption really persistent? Pacific Economic Review, 16(2), 192–206. https://doi.org/10.1111/j.1468-0106.2011.00542.x
- Shleifer, A., & Vishny, R. W. (1993). Corruption. Quarterly Journal of Economics, 108(3), 599–617. https://doi.org/10.2307/2118402
- Van Soest, D., Stoop, J., & Vyrastekova, J. (2016). Toward a delineation of the circumstances in which cooperation can be sustained in environmental and resource problems. Journal of Environmental Economics and Management, 77, 1–13. https://doi.org/10.1016/j.jeem.2015.12.004
- Wang, Q., Zhao, Z., Shen, N., & Liu, T. (2015). Have Chinese cities achieved the win-win between environmental protection and economic development? From the perspective of environmental efficiency. Ecological Indicators, 51, 151–158. https://doi.org/10.1016/j.ecolind.2014.07.022
- Wang, Z., Zhang, B., & Wang, B. (2018). The moderating role of corruption between economic growth and CO2 emissions: Evidence from BRICS economies. Energy, 148, 506–513. https://doi.org/10.1016/j.energy.2018.01.167
- Welsch, H. (2004). Corruption, growth, and the environment: A cross-country analysis. Environment and Development Economics, 9(5), 663–693. https://doi.org/10.1017/S1355770X04001500
- Winbourne, S. (2002). Corruption and the Environment. Management Systems International and USAID.
- Zhang, Y. J., Jin, Y. L., Chevallier, J., & Shen, B. (2016). the effect of corruption on carbon dioxide emissions in APEC countries: A panel quantile regression analysis. Technological Forecasting and Social Change, 112, 220–227. https://doi.org/10.1016/j.techfore.2016.05.027
Appendix A
Table A1. Definition, description, and sources of the variables
Table A2. Classification of countries based on the criteria of World Bank Income Classification, 2017