
Abstract
The paper aims to investigate the possible dual causality between exchange rates and stock indices of China and ASEAN using Structural Vector Auto-Regressive Model (SVAR). The paper has analysed the dynamic relationships between the Yuan and the Shanghai Composite Index and Shenzhen Stock Index in the context of China’s third largest trading bloc, i.e., ASEAN, after the Asian Financial Crisis of 1997. The Asian Financial Crisis of 1997–98 had an adverse impact on stock indices and the currencies of ASEAN countries. It was also expected that a devaluation of the Yuan would follow soon, thus plummeting investors’ confidence in the Chinese markets. Further research was needed to explore the complex relationship between financial and forex markets in the context of China and ASEAN. The focus of this paper is to explore such relationship with the focus on China. The results of the model confirm the dual causality between the two variables of interest in China. It concludes that a positive financial shock does have a small but significant impact upon the Yuan, whereas a positive exchange rate shock has a high and a significant impact upon the Shanghai and Shenzhen Composite Indices. The paper finds the effect of monetary and demand shocks upon the Yuan and stock market indices to be insignificant.
PUBLIC INTEREST STATEMENT
The paper aims to investigate the relationship between exchange rates and stock markets of China and selected ASEAN countries. The Asian Financial Crisis of 1997–98 had an adverse impact on stock markets and the currencies of China and ASEAN economies. It was also expected that a devaluation of the Yuan would follow soon, thus plummeting investors’ confidence in the Chinese and ASEAN markets. Further research was needed to explore the complex relationship between financial and forex markets in the context of China and ASEAN. The focus of this paper is to explore such relationship with the focus on China. The results of the model confirm the interlinkages and causal relationship between the two markets. It concludes that an increase in stock markets does have a small but significant impact upon the Yuan, whereas a decrease in Yuan has a high and a significant impact upon the Shanghai and Shenzhen Composite Indices.
1. Introduction
The global financial sector has gone through several periods of transformation since the collapse of Bretton Woods system in 1971. Worldwide financial crisis such as in Latin America in 1994, East Asia in 1997, and global recession in 2007 led to the synchronized effects of currencies and stock indices, prompting academics and investors alike to analyse the concurrent relationship between the forex and financial markets. Traditionally, the research trying to establish the dynamic link between forex and financial markets is categorized into two approaches: Flow Oriented Approach and Portfolio Balance Approach.
Flow Oriented or Goods Market Approach cites a negative causality generating from exchange rate to stock market. The approach is based on the hypothesis that if there is a devaluation—a positive exchange rate shock—then export oriented publicly listed firms will find it cheaper to export goods to international markets, allowing the firms to gain a competitive advantage, hence increasing their exports. The increase in exports will provide additional revenues, resulting in a surge in investors’ confidence and ultimately leading to an increase in the performance of the firms’ stock prices. The reverse is also true: If there is an appreciation in the exchange rate, i.e., a negative exchange rate shock, then the firms will lose their competitiveness in the global markets, leading to decreased exports, loss in investors’ confidence, and ultimately deficient performance on the stock market.
The Portfolio Balance Approach cites a positive causality from stock to forex markets. A bullish stock market would attract capital inflows from foreign investors into the economy, thus increasing the demand for the country’s currency, ultimately leading to an appreciation of the exchange rate. In comparison, a bearish stock market would cause foreign investors to divest, resulting in a reduction in the demand for the country’s currency, eventually leading to a decrease in exchange rate.
The case of China-ASEAN would be interesting to analyse, since in July 2005 exchange rate reform has taken place in China. The pre-reform Yuan was pegged to the US Dollar, whereas the post-reform Yuan has been pegged to a basket of currencies, leading to a high variation in the Yuan and making it difficult for the investors to predict the exchange rate. The RMB daily trading band has been widened from 0.3% (1994) to 0.5% (2007), to 1% (2012), and to 2% (2014) (Gary & Shiguang, Citation2010). In 2003, regulations on foreign investment in the stock markets have been relaxed under “Qualified Foreign Institutional Investors” (QFII) and “Qualified Domestic Institutional Investors” (QDII) initiatives. Therefore, the increased volatility of the Yuan amidst gradual opening up of China’s financial markets has produced interest in researchers and investors’ alike (Gary & Shiguang, Citation2010).
The contribution of this paper is identifying the potential dual causality between forex and stock markets in the case of China and its third largest trading bloc, ASEAN. This paper is the first one to utilize vector autoregressive model in such a context. Another originality of this paper is the inclusion of multiple relevant variables in the case of China and ASEAN. Other than considering the effects of monetary demand and supply shocks, this paper goes several steps ahead to include relevant determinants of financial and forex markets such as GDPs, interest rates, and inflation. Such number of variables and methodology have yet to be applied in the context of China and ASEAN. The paper uses eight relevant variables as controls in the model to clearly investigate the link, if there is any, between the Yuan and Shanghai and Shenzhen stock markets. For that purpose, the paper draws variables from both China as well as weighted average variables of major ASEAN economies in terms of their bilateral trade with China. Variables such as Relative GDP and Relative Equity Indices (REQ) are taken as the difference between China and its ASEAN counterparts.
The rest of the paper proceeds as follows: Section briefly reviews important literature. Section 3 presents VAR specification and identification with subsections on data, unit root, and lag length tests, VAR structural framework, and identification of the model. Section 4 describes the empirical results based on the Impulse Response Functions (IRFs) and variance decompositions while Section 5 concludes the paper.
2. Academic literature review
Several studies have been conducted using VAR model and other methodologies to examine the causal link between forex and financial markets in India, Brazil, the European Union, the United Kingdom, and the United States of America. Some have found a significant link between the two entities in the case of both developed and developing markets, whereas others have found significant interactions but not long-run causal relationships between the two financial markets, especially in the case of emerging economies.
Structural Vector Auto-Regressive Model (SVAR) models are useful in analysing the dynamic effects of unexpected shocks on the time path of variables. SVAR model is considered better than VAR models since reduced from VAR does not take into account structural relationships among the variables. In addition, SVAR imposes certain restrictions on identifying the model. Hence, SVAR can be used to predict effects of different shocks on the time series variables.
Another methodology which is being used in empirical macroeconomics is the Non-linear Auto Regressive Distributed Lag model (NARDL). Recently, developed by Shin et al. (Citation2014), NARDL model uses positive and negative partial sum decompositions to identify short-run and long-run asymmetric effects. In comparison to classical co-integration models, NARDL performs better for small samples (Romilly et al., Citation2001). This class of models is equally efficient for I (0) and I (1) variable series. However, it cannot be used for second differences series, i.e., I (2) series. The main advantages of asymmetric NARDL framework of Shin et al. (2014) are two: it evaluates the short- and long-run asymmetries and also detects hidden co-integration.
Ma and Kao (Citation1990) investigated six economies and concluded that domestic currency’s depreciation positively affects domestic stock market index for the export-dominant country and is detrimental to an import-dominated country. On the contrary, an appreciation of the domestic country’s currency negatively affects domestic stock market index of the export-dominant country and benefits import-dominant country, thereby complementing the goods market theory. The relationship was confirmed by Bartram et al. (Citation2005), as well as by Chow et al. (Citation1997).
Upon analysing the forex and equity markets of eight industrial economies (US, Canada, UK, Germany, France, Italy, Netherlands, and Japan) by utilizing error correction model, using daily data from 1985 to 1991, Richard and Mbodja (Citation1996) found significant interactions between the two markets in short as well as in the long run.
Abdalla and Murinde (Citation1997) utilized a similar error correction model to study the relationship between two financial markets in the context of emerging Asian economies from 1985 to 1994. They concluded that causality in the case of India, South Korea, and Pakistan was observed from exchange rate to stock prices, not the other way around, hence confirming the Goods Market approach and disregarding the Portfolio Balance Approach.
Bhunia (Citation2011) investigated the possible causality between stock indices and exchange rates in India. Using data from 2001 to 2011, he found that there exists a bi-directional causal link between the Indian Rupee and all the stock indices (comprising of infrastructure, services, financials, and industrial and technology indices).
Gary and Shiguang (Citation2010), utilizing ARDL model, found strong and significant causality running from the Yuan to Shanghai composite index not the other way around, thereby, confirming the Flow Oriented Approach and disregarding the Balance Portfolio Approach.
Naka and Mukherjee (Citation1995) observed a negative relationship between Japan’s stock market index and the Yen; as the Yen depreciates against the US Dollar, Japan’s stock market experiences an increase, owing to the large number of publicly listed export-oriented firms. The same result was found by Wongbangpo and Sharma (Citation2002) in case of Indonesia, Malaysia, and the Philippines. However, some studies are unable to find a significant long-run relationship between forex and stock markets.
Yang and Wang (Citation2005) researched bivariate causality between the Yuan and stock prices in China using a vector autoregressive model and concluded that there exists no long-run causal link between the two entities in China. The research did cite short-run link between forex and stock market in China.
Muhammad and Rasheed (Citation2007) investigated the relation between exchange rate and stock market of four South Asian countries: India, Pakistan, Bangladesh, and Sri Lanka. Using error correction model and Granger causality, he found no short-run or long-run link between the two financial markets. The results showed that stock markets and exchange rates are unrelated. The primary reason being the lack of development of financial sectors in South Asian economies.
Rahman and Uddin (Citation2009) analysed the dynamic relationship between stock indices and exchange rates for three South Asian countries: Bangladesh, India, and Pakistan. Using Granger causality, they found no dynamic link between the two entities in the three South Asian economies.
Benjamin (Citation2006) used non-linear causality tests to identify the link between the Brazilian Real and Brazilian stock index (Bovespa). The paper concluded that there is no long-run causality between the two entities.
The existing literature draws mixed conclusion regarding the link between exchange rate and stock market indices and there is no consensus upon the direction and magnitude of causality between the forex and stock markets. The literature reports both sensitive as well as insensitive causality between the two entities. In the case of industrialized economies, the link seems to hold significantly, while in the case of developing economies the causality is either weak or non-existent. Even within developed and developing countries, the direction and approach of causality between exchange rates and stock\indices differ primarily due to diverse structure of the economies, peculiar link between forex and stock markets, investors’ behaviour, and the degree of the openness of the economy.
3. VAR specification and identification
3.1. Data
Quarterly data over the period of 1997–2014 have been used. Relative variable series are estimated as weighted averages of the ASEAN countries and are identified by an asterisk in the superscript of each variable. Each variable of ASEAN is calculated using the following equation:
Wi = (Tic/Tac) *100
• T = Total Trade Volume
• i = Specific Country
• C = China
• a = ASEAN region
ASEAN countries used in our analysis include Malaysia, Indonesia, Singapore, and the Philippines. The sources of the data are Asian Development Bank, International Monetary Fund, and Bloomberg.
One of the constraints of gathering data is that in the case of China it was not available before 1995. The data on several variables of interest are either missing and/or unavailable in quarterly form.
3.2. Variables
Eight variables including gross domestic product (GDP), interest rate, exchange rate, stock index, and consumer price index (CPI) are computed for China and for ASEAN and are used in the estimation procedure of VAR (Table ). Real output levels (GDPs) are taken in Dollar denominations. Exchange rates of China and of ASEAN are taken as the value measured in terms of US Dollars. The computation of variables is described as follows.
Table 1. Description of variables and sources
However, for simplicity, five most important and relevant macro-economic variables were chosen for the impact valuation. These are identified as follows:
a) Relative GDP (DRY)
b) Relative CPI (DRP)
c) Exchange Rate (Yuan) (DER)
d) Relative Interest Rate (DRI)
e) Relative Equity Index (DREQ)
3.2.1. Relative variables
The paper uses relative variables such as GDP and CPI for several reasons. It is based on the methodology employed by Richard and Mbodja (Citation1996), in which the authors utilize relative variables to analyze the dynamic relationship between financial and forex markets in the case of advanced European and North American economies. According to the authors, relative variables are used to reflect the degree of different impacts on financial and forex markets as a result of positive shocks. Furthermore, the usage of relative variables in the case of China and ASEAN is appropriate to capture the differences in the effects of variables. China being a relatively closed economy than the ASEAN economies, it will be affected differently than ASEAN countries in aftermaths of a shock.
3.3. Unit root and lag length tests
Estimation of VAR model requires that each variable entered in the model must be stationary.
Hence, we used Augmented Dicky Fuller Test (ADF) to test for stationarity. ADF test has the advantage of addressing autocorrelation as well by including lags of the dependent variable. In addition to the ADF test, we also conducted Kwiatkowski–Phillips–Schmidt–Shin (KPSS) and Phillips–Perron (PP) unit root tests.Footnote1 Phillips–Perron test produces same outcomes as ADF tests. However, KPSS test fail the null of data is stationary for relative price (RP) series in levels. Therefore, first difference series of RP is used in vector auto-regressive model. The stationary levels are presented in Table .
Table 2. Stationary levels of variables
Furthermore, lag length test was computed using Akaike Information Criterion (AIC) and Schwarz–Bayesian Criteria (SBC); three lags minimized the sum of squared in both criteria. Three lags are used in VAR model estimation.
3.4. VAR structural framework
The error terms (shocks) in the structural VAR are assumed to be uncorrelated and to test serial autocorrelation, lag-length test was carried out. Furthermore, it is also assumed that the independent variables can have contemporaneous effects on other variables. However, to avoid inconsistent parameter estimates, the reduced form of SVAR must be used.
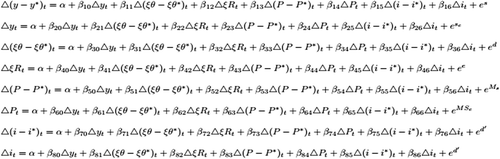
After adjusting for serial autocorrelation and lag-length, the model is benchmarked against Tien’s model. The variables used in the analysis ҳ = {Y‑Y*, Y, EQ‑EQ*, ER, P‑P*, P, I–I*, I} are assumed to follow a “multivariate covariance stationary process” and that vector x depends on its lags and some vector of structural shocks “ɛ” (Pao-Lin, Citation2009). The shocks are defined in Table .
Table 3. Description of shocks
The vector auto-regressive model can be written as follows:
Equation 1.
3.4.1. Identification of VAR model
Firstly, the long run restrictions imposed in the Wold MA form should be economically valid and secondly, each restriction must only and uniquely identify the shocks computed in the model specification below. Using quarterly data over a period of 1997–2014, the VAR model takes the following form X = B (1) ɛ.
Equation 2.
The shocks are defined in Table as follows.
The ordering of the variables follows the methodology proposed by Richard and Mbodja (Citation1996) and Oliver and Danny (Citation1989). The lower triangle of B(1) is identified as follows; it begins with a model presented by Blanchard and Quah, which makes differentiation between supply and demand shocks. The most significant findings of BQ model is that demand shocks only temporarily affect real output levels, i.e., in the short-run, while real output is significantly affected by only supply side factors in the long-run (Oliver & Danny, Citation1989). This holds in the case of emerging markets as well as China. Changes in aggregate demand components will be adjusted quickly due to high state intervention, while an increase in the productive capacity of the economy will have long-term impacts upon real output. Thus, real output level in the model can be affected by domestic as well as common supply shocks.
For the relative output levels, a common supply shock that is common to both China and Y* (ASEAN’s weighted average output) will not have a long-run effect. This view is supported by an example of a supply shock such as technological advancement in a large economy, i.e., United States, resulting in an increase in its GDP relative to other economies. However, owing to globalization, sharing of knowledge via increased trade, access to technology, and a high possibility of reverse engineering, other economies, especially the trading partners of United States, will catch up. Hence, in the long-run the catching up will eliminate any difference in technological productivity, removing all major gaps in production and output levels between United States and other economies, particularly its trading partners (Pao-Lin, Citation2009). The same justification can be used in the case of China, as any major technological advancement in China will disseminate quickly to other economies, especially amongst its trading partners, ASEAN in this case. This justifies the identifications in row (1) and (2) of the matrix B (1) (Equation (2)).
For relative stock index (REQ) variable, the model allows supply and exchange rate shock to have long-run impacts. Fraser, using quarterly data and an identification method based on structural VAR, proved that supply shocks make a greater contribution to changes in stock prices and cited them as the essential source of variation in the stock indices (Fraser & Nicolaas, Citation2006). Similarly, as discussed in the academic literature review, most empirical studies provide evidence of an impact of an exchange rate shock on equity prices in developing as well as in the developed countries. Studies conducted by Gaurav et al. (Citation2010), Zakri (Citation2006), and Paul et al. (Citation2011) observed the long-run causality from exchange rate to stock indices in the case of Canada, India, and Switzerland. Hence, for REQ variable, the model allows domestic and common supply as well as exchange rate shocks to have a long-run impact.
For the real exchange rate for the Yuan, the model allows supply, exchange rate, and equity shocks to have permanent long-run impacts (thus, the restrictions on the third and fourth row of B (1)) (Equation (2)). Literature on the determinants of real exchange rate cite factors from both supply and demand to have impact upon real exchange rates in the long-run, while monetary shocks and other nominal shocks have short-run effects (Pao-Lin, Citation2009). Athanasios and Costas (Citation2013), using non-parametric co-integration regression approach, concluded that stock price movements drive exchange rate movements both in European Union and in United States. Their finding was complemented by the study conducted earlier by I-Chun (Citation2012). Using a similar justification and to check for a similar effect in the case of China-ASEAN, the model allows equity shocks to have a permanent long-run effect upon the Yuan.
Although the restrictions imposed allow the model to be uniquely identified, a possible caveat remains. Jon and Leeper (Citation1997) identified the issue of multiple shocks, i.e., each shock specified in the VAR model may somehow incorporate other shocks. For example, the equity shock might be due to a productivity shock. In this case, BQ long-run identification method allows multiple shocks to affect only if the underlying variable of interest responds to both shocks in the same direction (Oliver & Danny, Citation1989). Thus, the eight VAR models address the issue in a much efficient way. Due to the large number of variables included in the VAR model, categories of broader shocks are segmented into precise types.
4. Empirical results
This section discusses the economic interpretation of IRFs of two important shocks, i.e., Equity (Financial) Shock and Exchange Rate Shock.
4.1. Response to an equity (financial) shock
When the model is given a positive financial shock, the REQ goes up by 5% and continues the gradual increase up to fourteenth quarter. In other words, the REQ goes up because the increase in the equity indices of China (Shanghai Composite and Shenzhen Stock Exchange) is greater than the weighted average of selected ASEAN countries’ stock indices.
The behaviour follows economic rationale. Because of an increase in REQ, inflationary pressures would build up in the financial sector of China. According to Francesco et al. (Citation2015), explaining broadly, the average Chinese investor has two primary avenues for investment: financial sector and the real sector—and there exists a strong positive correlation between the two sectors of the economy. To avoid overheating of the domestic financial sector, the Chinese government must lower the interest rates to boost up growth in the manufacturing sector. The behaviour is evident—Chinese short-run interest rate (CIR) decreases by 1–2% before stabilizing in the eight quarter. Also, there would be a reduction in the relative interest rate (DRRI). The decrease in “Relative Interest Rate” suggests that ASEAN countries will follow suit but the cut in Chinese interest rate will be higher than that of ASEAN. The pattern is evident in the IRFs to equity shocks (Figure )).
Figure 1. Response to Exchange rate Shock
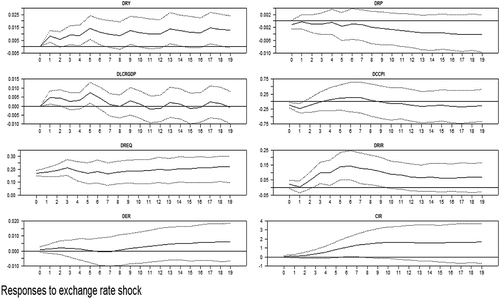
The lowering down of interest rates by the Chinese Government would lead to increased investment and consumption, thus boosting up the national output (GDP). ASEAN countries would follow suit, thus the variable “Relative GDP” increases. But the increase in Chinese GDP will be greater than that of ASEAN countries, hence the increasing trend. The effect is marginal though; it increases by 1.5% throughout the fourteenth quarter, eventually beginning to subside at the end of the fourteenth quarter. However, the decrease in the real interest rates will carry a risk of shifting inflationary pressure from financial sector to the real sector. Owing to the lowering of interest rates, coupled with a financial shock, there would an increase in prices. The behaviour is evident in the form of decreasing RP. The decrease suggests that ASEAN’s prices increase more than those of China’s, with ASEAN being more open and prone to exogenous shocks as compared to China. To avoid the shifting of inflationary pressure from financial to real sector, the Chinese Government will devalue the exchange rate, which would result in a fall in the value of the Yuan, as evident from the IRF of ER (Figure ). The effect is only 2%. The decrease in exchange rate would lead to increased exports, if Marshall–Lerner conditions hold, and this will further increase the GDP of China. The Marshall–Lerner condition puts the country at a state that an exchange rate depreciation will only result in a balance of trade improvement if the sum of long-term export and import demand elasticities is greater than one (Anon., n.d.). The demand for majority of the Chinese exports is highly elastic, implying the holding of Marshall–Lerner conditions (Francesco et al., Citation2015). The increase in relative GDP indicates that the output of China increases more than that of ASEAN countries’ output. The Chinese real output increases primarily due to lowering down of interest rate initially and exchange rate later.
Thus, the effect of a positive financial shock is state-led devaluation of the exchange rate of the Yuan. The linkage between financial and forex market in China-ASEAN case neither follows a Flow Oriented Approach nor a Balance Portfolio Approach. The causation runs from equity to exchange rates but in reverse. However, the impact is marginal; an unexpected and sudden increase in Shanghai and Shenzhen indices leads to a devaluation of the Yuan by a mere 2%.
Approximately 3% of the variation in the Yuan in the tenth quarter is being explained by supply shocks, which is consistent with the macro-economic theory (Table -given in appendix). In the beginning of 2007, Shanghai composite index and Shenzhen stock market were at their peaks. The high stock market indices (A form of a moderate financial shock) provided a positive signal to the investors regarding the state of the Chinese economy and boosted the investors’ confidence, resulting in a technological shock in China in 2007. The Chinese market was penetrated by IT giants such as Google and Yahoo. With the sudden surge of the domestic smartphones and computing equipment demand, the Government introduced an exchange rate shock to deter the imports and to support local IT firms and to provide exporters a competitive advantage (Wayne & Marc, Citation2013). Thus, a financial shock resulted in a supply shock, which in turn resulted in a positive exchange rate shock in China.
As identified by other economic papers such as Clive et al. (Citation2000), where monetary shocks provided much of the variation in the exchange rates, as per the model formulated in the paper, money demand and supply shocks have a combinefd effect of a mere 1.5% in the long-run in the tenth quarter (Table ). This could be due to the high degree of capital controls and relatively fixed exchange rate regime in China. Unlike in US or UK where monetary policy could influence exchange rate, in China, the link between monetary policy and exchange rate is weak (Mehrotra & Sánchez-Fung, Citation2010). Increase in money supply by Chinese Central Bank or money demand by the consumers will not affect exchange rate, unless the expansionary monetary policy is being complemented by the an equally expansionary exchange rate policy. As opposed to US or UK, China still treats exchange rate as one of the instruments to affect macro-economic variables. Thus, the effect of monetary demand and supply shocks do not affect the Yuan in the long-run.
4.2. Response of an exchange rate shock
The impact of exchange rate shock on the GDP was positive. A devaluation of the Yuan by the Central Bank of China leads to a decline in prices of exports, which increases the volume of exports, thus providing stimulus to the aggregate demand of the economy, thus increasing the national real output. The increase in Chinese GDP is greater than that of ASEAN, thus the increase in Relative Output (DRY). However, the impact is marginal, with the Chinese real output peaking by 0.5% in the fifth quarter before subsiding down. In case of China, the price elasticity of exports is very high, which means that a devaluation will result an increase in exports within a short time frame (Zhizhong et al., Citation2013).
As mentioaned before, there exists two priamry avenues for the consumers to make use of their savings. One is real sector (mostly real estate) and the other one is stock market (stocks). Thus, when the economy will experience an exchange rate shock (devaluation of the Yuan), the exports will increase, and since approximately 45% of the firms listed on Shanghai and Shenzhen stock markets are export-oriented entities, they will experience an increase in their earnings. In the hope of increased returns, investors will rush to the stock market, driving the equity index up (Clive et al., Citation2000). This can be seen in the behaviour of REQ to positive exchange rate shock. In the case of China, the stock indices rise whereas in the case of ASEAN, the stock indices must be declining, hence the increase in REQ. This could be due to loss of competitive advantage to ASEAN’s firms as compared to Chinese exporters. Also, investors’ reaction to a Yuan devaluation will lead to divestment from the ASEAN’s stock markets. Thus, REQ increases by 20%, peaking at 25% in the fourteenth quarter (lag). Provided the long-lasting impact of a devaluation upon exports and hence earnings of export oriented firms, it will take time for the effect to subside.
Thus, a positive Yuan shock has a positive and high impact upon the equity indices of China, evident from the trend of REQ to an exchange rate shock. The result is consistent with Flow Oriented Approach, citing the causality running from exchange rate to stock indices.
The variation in the REQ, explained by the exchange rate, is approximately 3% in the first quarter and decreases to 2.67% in the tenth quarter (Table ). The variation is consistent with macro-economic theory. In 2010, because of devaluation, Chinese equity markets rose sharply. They rose again following the Yuan’s devaluation in 2012 (Joe, Citation2015). The immediate impact cites setting in of a reverse J-curve effect and a gain of a competitive advantage to the Chinese exporters. Moreover, in the relatively open economies like US and UK, in 2012, 2013, and 2014, the depreciation of the US Dollar and the Pound Sterling also resulted in increases in NASDAQ and FTSE, respectively (Hulbert, Citation2015). Thus, Flow Oriented Approach, in industrial economies, can be observed in the case of China-ASEAN.
One interesting point to note is that exchange rate shock explains much of the variation in the exchange rate itself. The variance decomposition explains 89% of the variation in the exchange rate itself (Table - given in Appendix). This could be due to high predictability of an exchange rate shock and tight state control over the forex market. In the past 15 years, Chinese Central Bank has used exchange rate as a policy tool to stimulate economic growth. Whenever the economy becomes sluggish, i.e., the growth rate falls below 7.5%, China undertakes currency devaluation to simulate the aggregate demand by boosting exports. Devaluation took place in the aftermath of the 2001 US recession (Largest trading partner of China), 2007–08 financial crises, as well as recently in the aftermath of Chinese stock market crash of 2015. Consequently, the exchange rate shock or state-led devaluation is mostly expected by the economic agents (consumer, firms, and investors), who adjust their decisions after considering the high possibility of an exchange rate shock (Lu & Patrick, Citation2016). Thus, high predictability of a devaluation and high regulation, monitoring, and adjustment of the forex market by the state explains much of the variation of the Yuan explained by an exchange rate shock.
As far as the impact on other variables is concerned, to curb the inflationary pressures in the financial as well as in the real sector due to increase in REQ and GDP, due to increase in exports, respectively, the Government will increase the interest rate by 1% as seen from the IRF (Figure ). The impact on prices, however, is ambiguous. Because of devaluation, exports will increase, leading to an increase in aggregate demand and coupled with expensive imports, the result would be an increase in the inflation in China. On the other hand, due to the increase in interest rate, domestic consumption and domestic investment would be discouraged, leading to a fall in aggregate demand, eventually resulting in fall in the domestic price level.
However, the IRF of Chinese CPI demonstrates increasing trend till the seventh quarter before start decreasing, which implies that the latter phenomenon is in effect till the seventh quarter and after that the former effect sets in (Figure ). In other words, at first, the decline in consumption and investment is less than the increase in exports, leading to an increase in the domestic price level. After the seventh quarter, the decline in domestic consumption and investment is greater than that of increase in exports, leading to a fall in price levels. After the seventh quarter, consumers and firms adjust to the expensive imports and investments, altering their preferences, leading to a decline in consumption and investment that is greater than the increase in exports, thereby reducing prices. Furthermore, after the seventh quarter, coupled with increased competition in export markets, the economy will be able to increase the productive capacity to meet the demand for exports, thereby reducing the inflationary pressures and leading to a fall in domestic price level.
The behaviour is also visible from the trend of GDP, which increases by 1.5% till the seventh quarter before becoming stable. Hence, because of devaluation, reactionary increase in interest rates and the fall in consumption and investment being greater than the increase in exports will lead to a fall in domestic price level.
Therefore, a positive exchange rate shock will have a positive effect upon Chinese stock markets, real output, and interest rates and a negative impact upon domestic price level.
5. Conclusion
The paper finds significant long-run relationship between forex and stock markets in China and ASEAN. In the case of a financial (equity) shock, the causality from an increase in stock market indices to a devaluation of the Yuan was found to be significant, thereby supporting a Reverse Portfolio Approach. In case of an exchange rate shock, the causality from a devaluation of the Yuan to stock market indices was also found to be significant, therefore supporting Flow Oriented Approach.
The paper uniquely identifies the relationship between forex and stock markets in China and ASEAN. In the case of a financial shock, the REQ increases, implying the increase in Chinese Stock Markets’ Indices being greater than ASEAN’s. Similarly, due to devaluation of the Yuan, the REQ rises, implying the increase in Shanghai Composite and Shenzhen stock markets and a decline in ASEAN’s weighted average stock indices. ASEAN’s index declines due to a loss of competitive advantage by the local exporters against Chinese firms.
The results of the paper complement the conclusions by Ma and Kao (Citation1990), Abdalla and Murinde (Citation1997), Chow et al. (Citation1997), and Bartram et al., Citation2005) and are consistent with the findings of Gary and Shiguang (Citation2010), who, using ARDL approach, observed Goods Market Theory but not Portfolio Balance Theory in the case of China. Also, the paper supports findings by Richard and Mbodja (Citation1996) and Pao-Lin (Citation2009), which imply that monetary shocks are not the most important shocks explaining the variation in exchange rates in both developed and developing markets.
Furthermore, the behaviour of other relevant variables such as Relative GDP, Relative Interest Rate, and RP tend to follow the predicted macro-economic theory in case of China-ASEAN and is consistent with the findings of Clive et al. (Citation2000). However, there exists a complicated relationship between exchange rate determination and equity indices. Due to state’s intervention in the forex as well as in the stock markets and connectedness of these entities with real and other sectors of the economy, it becomes difficult to isolate the effect of exchange rate on the stock market and vice versa, via bivariate model (Clive et al., Citation2000). This paper addresses the shortcoming by including the relevant determinants of stock market index and exchange rates as identified by the previous studies. In the case of China-ASEAN, however, due to high intervention of the Chinese Government in the forex market, real sector, and regulation of financial sector, the effects of and upon the exchange rate were primarily due to the direct intervention of the Government. Moreover, it would have been interesting to note how the market forces would have steered exchange rate because of a financial shock and vice-versa in the case of China.
According to the analyses presented in this paper, based upon the methodology and inclusion of other relevant variables, significant interactions between forex and financial markets can be found in China. Any change in exchange rate policy by the Central Bank of China has direct implications for the Chinese stock market indices (Shanghai and Shenzhen). The performance of Chinese financial markets or the performance of publicly listed firms to be specific has a significant impact upon the exchange rate policy.
Additional information
Funding
Notes on contributors

Mohammad Uzair Akram
Mohammad Uzair Akram is a Graduate Research Assistant at the Institute for Business in Global Context, The Fletcher School, Tufts University, where is working on the Digital Evolution Index 2020, mapping the countries’ yearly Digital Growth. Mohammad Uzair has previous experience in working in microfinance sector along with leading researchers from University of Oxford and Lahore University of Management Sciences. Mohammad Uzair has received multiple grants to study the impact of asset-based finance to smallholders’ farmers from Tufts 100k competition and Eco-Environmental Impact of Chinese investment in Northern Pakistan from The Fletcher School Fund, respectively. Mohammad Uzair also written multiple articles on Economic Development and Growth Constraints in Pakistan.
Notes
1. Test results are available upon request. For space considerations, only ADF test results are reported.
References
- Abdalla, I., & Murinde, V. (1997). Exchange rate and stock price interactions in emerging financial markets: Evidence on India, Korea, Pakistan and the Philippines. Applied Financial Economics, 7(1), 245–15. https://doi.org/10.1080/096031097333826
- Athanasios, T., & Costas, S. (2013). A long-run relationship between stock price index and exchange rate: A structural nonparametric cointegrating regression approach. Journal of International Financial Markets, Institutions and Money, 25, 106–118. https://doi.org/10.1016/j.intfin.2013.01.008
- Bartram, M., Dufey, G., & Franknel, M. (2005). A primer on the exposure of nonfinancial corporations to Foreign exchange rate risk. Journal of Multinational Financial Management, 12(5), 8–15. https://doi.org/10.1016/j.mulfin.2005.04.001
- Benjamin, M. (2006). The dynamic relationship between stock prices and exchange rates: Evidence for Brazil. Banco Central Do Brasil, 9(8), 1377–1396. https://doi.org/10.1142/S0219024906003974
- Bhunia, A. (2011). A causal relationship between stock indices and exchange rates in India. Economics Bulletin, 31(4), A54. http://www.accessecon.com/pubs/EB/2011/Volume31/EB-11-V31-I4-A54.pdf
- Chow, E., Lee, W., & Scolt, M. (1997). The economic exposure of U.S. multinational firms. The Journal of Financial Research, 20(2), 191–210. https://doi.org/10.1111/j.1475-6803.1997.tb00244.x
- Clive, G., Chin-Wei, Y., & Bwo-Nung, H. (2000). A bivariate causality between stock prices and exchange rates: Evidence from recent Asianflu. The Quarterly Review of Economics and Finance, 40(2000), 337–354. https://doi.org/10.1016/S1062-9769(00)00042-9
- Francesco, A., Graziella, B., & Alessia, V. (2015). New evidence on export price elasticity from China and six OECD countries. China & World Economy, 23(6), 56–78. https://doi.org/10.1111/cwe.12136
- Fraser,, & Nicolaas, G. (2006). US share prices and real supply and demand shocks. UWA Business School, 46(1), 149–167. http://www.business.uwa.edu.au/__data/assets/pdf_file/0008/2534354/14-11-UWA-Discussion-Papers-in-Economics-The-First-750.pdf
- Gary, T., & Shiguang, M. (2010). The relationship between stock returns and the foreign exchange rate: The ARDL approach. Journal of the Asia Pacific Economy, 15(4), 490–508. https://doi.org/10.1080/13547860.2010.516171
- Gaurav, A., Srivastav, A. K., & Ankita, S. (2010). A study of exchange rates movement and stock market volatility. International Journal of Business and Management, 5(12), 62–73. https://doi.org/10.5539/ijbm.v5n12p62
- Hulbert, M. (2015). [Online]. Market Watch. http://www.marketwatch.com/story/what-the-strong-us-dollar-really-means-for-stock-prices-2015-02-18
- I-Chun, T. (2012). The relationship between stock price index and exchange rate in Asian markets: A quantile regression approach. Journal of International Financial Markets, Institutions and Money, 22(3), 609–621. https://doi.org/10.1016/j.intfin.2012.04.005
- Joe, W. (2015). Here’s the recent history of the Chinese Yuan in One, Big Chart. [Online]. Bloomberg. https://www.bloomberg.com/news/articles/2015-08-12/here-s-the-recent-history-of-the-chinese-yuan-in-one-big-chart
- Jon, F., & Leeper,. (1997). When do long-run identifying restrictions give reliable results? Journal of Business and Economic Statistics, 15(3), 345–353. doi: 10.2307/1392338
- Lu, J., & Patrick, G. (2016). [Online]. Reuters. http://www.reuters.com/article/us-china-yuan-midpoint-idUSKBN0UL07Z20160107
- Ma, C., & Kao, W. (1990). On exchange rate changes and stock price reactions. Journal of Business Finance and Accounting, 17(3), 441–449. https://doi.org/10.1111/j.1468-5957.1990.tb01196.x
- Mehrotra, A., & Sánchez-Fung, J. R. (2010). China’s monetary policy and the exchange rate. Federal Reserve Bank of San-Francisco. https://doi.org/10.24148/wp2010-19
- Muhammad, N., & Rasheed, A. (2007). Stock prices and exchange rates: Are they related? Evidence from South Asian countries. Pakistan Institute of Development Economics, 41(4), 535–550. https://doi.org/10.30541/v41i4IIpp.535-550
- Naka, & Mukherjee. (1995). Dynamic relations between macro-economic variables and the Japanese stock market: An application of vector error connection model. The Journal of Financial Research, 18(2), 223–237. https://doi.org/10.1111/j.1475-6803.1995.tb00563.x
- Oliver, B., & Danny, Q. (1989). The dynamic effects of aggregate demand and supply disturbances. American Economic Review, 79(4), 655–673. http://www.jstor.org/stable/1827924
- Pao-Lin, T. (2009). Using long-run restrictions to investigate the sources of exchange rate fluctuation. Bureau of Economic Analysis. Wesleyan University, Department of Economics.
- Paul, A., Theodore, P., & Xu, Z. (2011). Causal relationship between stock prices and exchange rates. Journal of International Trade and Economic Development, 20(1), 67–86. https://doi.org/10.1080/09638199.2011.538186
- Rahman, L., & Uddin, J. (2009). Dynamic relationship between stock prices and exchange rates: Evidence from three South Asian countries. International Business Research, 2(2), 167-174. https://doi.org/10.5539/ibr.v2n2p167
- Richard, A., & Mbodja, M. (1996). On the dynamic relation between stock prices and exchange rates. Journal of FInancial Research, XIX(2ʹ), 193–207. https://doi.org/10.1111/j.1475-6803.1996.tb00593.x
- Romilly, P., Song, H., & Liu, X. (2001). Car ownership and use in britain: a comparison of the empirical results of alternative cointegration estimation methods and forecasts. Applied Economics, 33(14), 1803-1818. doi: 10.1080/00036840011021708
- Shin, Y., Yu, B., & Greenwood-Nimmo, M. (2014). Modelling asymmetric cointegration and dynamic multipliers in a nonlinear ardl framework festschrift in honor of peter schmidt, 281-314. New York, NY: Springer.
- Wayne, M., & Marc, L. (2013). China’s currency policy: An analysis of the economic issues. Current Politics and Economics of Northern and Western Asia, 22(4), 507-567. Retrieved from https://search.proquest.com/docview/1622676841?accountid=135034
- Wongbangpo, P., & Sharma, S. (2002). Stock market and macroeconomic fundamental dynamic interactions: ASEAN-5 countries. Journal of Asian Economics, 13(1), 27–51. https://doi.org/10.1016/S1049-0078(01)00111-7
- Yang, D., & Wang,. (2005). The dynamic relationship and pricing of stocks and exchange rates: Empirical evidence from Asian Emerging Markets. Journal of American Academy of Business, 7(1). http://www.jaabc.com/jaabcv7n1preview.html
- Zakri, B. (2006). The association between exchange rates and stock returns. Investment Management and Financial Innovations, 10(3), 40–45. https://businessperspectives.org/component/zoo/author/zakri-bello?Itemid=212
- Zhizhong, Y., Feng, T., & Qingyi, S. (2013). Income and price elasticities of China’s exports. China & World Economy, 21(1), 91–106. https://doi.org/10.1111/j.1749-124X.2013.12010.x
Appendix
Table A1. Variance decomposition for China-ASEAN equity in levels
Table A2. Variance decomposition for China-ASEAN exchange rate (DER)