
 ?Mathematical formulae have been encoded as MathML and are displayed in this HTML version using MathJax in order to improve their display. Uncheck the box to turn MathJax off. This feature requires Javascript. Click on a formula to zoom.
Abstract
This paper examines measuring the intensity of income diversification and identifying the factors which determine level of income diversification in Asayita woreda Eastern part of Afar region. The study used multi stage sampling in combination with stratified and simple random sampling procedures to select kebeles and households. The Simpson Index of Diversity (SID) and Fractional response model were employed to analyse the data collected from a sample of 153 rural households. The level and type of income diversification depends on the accessibility and availability of different income sources. The mean results of degree of income diversification revealed that Simpson Index of Diversity (SID = 0.24) by rural households in the study area. Based on fractional response model educational status, credit utilization, distance from market and access to electric power affect at p < 0.01% probability level, sex of the household head affect at p < 0.05% probability level and, annual household income, special skill and household size significantly affecting degree of income diversification at p < 0.1% probability level. The finding of this research indicates important policy implications suggesting that programs, projects and/or any interventions designed targeting to engage people in other income-generating activities would augment their income sources, which are made to increase the level of income diversification at household level in Asayita woreda.
PUBLIC INTEREST STATEMENT
Agriculture is the basic economic sector on which the country relies for its social and economic development. Despite its importance, the production and productivity of the sector still remains very low as of the traditional, subsistence and nature-dependent production systems. Recognizing this fact it is essential for the small-holder farmers to involve in other income earning activities, besides attempting to improve production and productivity of agriculture. In Ethiopia the pastoral (rural) economy is usually analysed as an agrarian economy in which large number of small-holder farmers are generally in farming activities like crop production and livestock rearing with small number of small-holder farmers participate in non-farm business activities. Hence, non-farm income is expected to enhance their production and productivity of farming. However, it is not well known whether there exists variability in the degree of income diversification among rural farm households in the study areas
1. Introduction
1.1. Background of the study
Agriculture is the basic economic sector on which the country relies for its social and economic development. Its contribution to the gross domestic product (GDP), employment opportunity and foreign exchange earnings of the country is about 42%, 84% and 90%, respectively, makes it the incontestable sector in the country’s development prospect (Central Statistical Agency [CSA], Citation2016). Despite its importance, the production and productivity of the sector still remains very low as of the traditional, subsistence and nature-dependent nature of its production systems. The sector faced continuous and challenging problems that are induced by environmental crises, demographic and socioeconomic constraints, which adversely affect households’ production system and thus leaves the country and/or households to remain food insecure (Zerai & Gebreegziabher, Citation2011). As a result, Ethiopia fails to feed relatively large proportion of its population from domestic production. And more importantly; the population do not have the productive capacity to earn ability to commend its additional food requirements through commercial imports.
Recognizing this fact it is essential for the small-holder farmers to involve in other income earning activities, besides attempting to improve production and productivity of agriculture. For instance, Dimova and Kunal (Citation2010) stated that participation and specialization of small-holder farmers in one particular activity is the exception and income diversification through participating in different activities is a custom. This is due to the fact that income diversification could help small-holder farmers to address the problem of risks and uncertainties, Ellis (Citation1998); Dimova and Kunal (Citation2010) that their farming, which is nature dependent and rain-fed agriculture, usually encountered and also expected to create higher income (Demissie & Legesse, Citation2013). Being agriculture is nature dependent and the common jobs of small-holder farmers, it is usually characterized by different problems such as poor soil fertility, volatile rainfall, crop and livestock diseases, price shocks for crop and livestock products and other related conditions which guide to generating low income and gradually leads to food insecurity and poverty. In Ethiopia, one of the main reasons for poverty and food insecurity of the extensive agriculture-based small-holder farmers is their extremely low productivity (yield) of the small holders Canali and Slaviero (Citation2010) who are the major producers of food in the country the fact that they use low-input, rain-fed and low-output farming systems (MOARD (Ministry of Agriculture and Rural Development), Citation2010). Although the rural farm households in Awsi zone specifically in the study area (Asayita woreda) is highly dependent on the flood irrigation agricultural production systems, shortage of farm land resource and variability of the rain fall pattern, made the small-holder farmers unable to meet the annual food requirements of their families. As a result, they are obliged to engage in low return daily wage works, petty trading, services and handcraft activities to supplement their livelihoods and to cope up with the agricultural risks.
In Ethiopia the pastoral (rural) economy is usually analysed as an agrarian economy in which large number of small-holder farmers are generally in farming activities like crop production and livestock rearing with small number of small-holder farmers participate in non-farm business activities. Nagler and Naudé (Citation2014) indicated that 83% of small-holder farmers in Ethiopia participated in farming activities and only 27% in non-farm economic enterprises. Majority of the population is however dependent on marginal non-farm income sources such as petty trade World Bank (Citation2009) besides most of the Ethiopian rural people are poor and accessed to one or less than one hectare of land (International Fund for Agricultural Development [IFAD], Citation2011), low return from farming activities and their farm income is not enough for the whole year consumption Kilic et al. (Citation2009) as well as varies considerably Beyan Ahmed (Citation2016) exposed majority of rural households to chronic poverty. Due to this fact that in most countries farm households that are highly reliant on non-farm income can have good implications if they are thoroughly considered by agricultural research and extension systems of the country. As they are expected to reinvest their non-farm profit back into their farm production would improve farm productivity and household food security. Agricultural production becomes low due to crop or livestock failures resulting from agro—climatic shocks and/or market failures, farm households utilize non-farm incomes to stabilize aggregate income flows and secure food access. In addition, they use non-farm income in the crucial hungry period between food stores running out and the next harvest season (Kilic et al., Citation2009). This implies that non-farm income cannot only be used as a mechanism to stabilize the household income but also reduces early harvest consumption or distress selling at early harvest time. Under scarce land and imperfect land market it also enables to create more job opportunity for some rural household members (mainly youths and women who are victims of this problem) and this contributes for the reduction of rural unemployment. In Ethiopia, where income from farm activities varies considerably, farm households usually engage in non-farm activities to supplement their agricultural income (Ahmed, Citation2016). Hence, non-farm income is expected to enhance their production and productivity of farming.
However, it is not well known whether there exists variability in the level of income diversification among rural farm households in the study areas. Besides, some rural households in the study area allocate their working time between farms and non-farm activities to have secure income (consumption) for their family members while others engaged in farming only. Yet, it is not clear why some households engage only in farm activities while others engage in both farm and non-farm income-generating activities. Non-farm employment provides additional income that enables farmers to spend more on their basic needs include food, education, closing and health care. This implies that non-farm employment has a significant role in maintaining household food security (Zerai & Gebreegziabher, Citation2011; Oyewole & Henson, Citation2012; Yizengaw, Citation2014). Policy makers and others did not look at the way in which the rural income diversification is integrated with employment generation and other food security status improvement strategies due to lack of empirical evidences that help understand well. Even though the woreda is the initial capital city of the afar region which has better access to infrastructure like asphalt road, its economic activities are mostly based on farming like flood irrigation, livestock rearing where income diversification has not yet widely practiced. This shows that there is a gap in rural households to diversify their income sources assisting to smooth their consumption all-round the year in the study area. So it is thus, important to measure the intensity of income diversification and identifying the major factors affecting intensity of income diversification of small-holder farmers, considering the socio-economic and bio-physical circumstances of the study areas. This study attempts to address the following questions. What is the intensity of income diversification among the farm households? What are the major factors which determine intensity income diversification?
2. Research methodology
2.1. Description of the study area
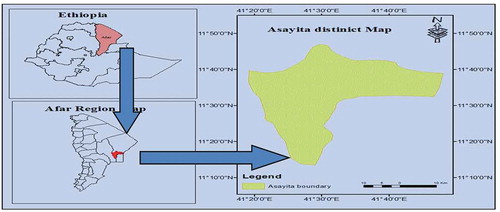
The study was conducted in Asaita woreda, which is one of the woreda in the Afar region of Ethiopia as depicted in Figure 1. According to Central Statistical Agency [CSA], Citation2012), it is part of the administrative of Awisi zone. In this woreda there are 13 kebles from those 11 are rural and the remaining two are urban kebles (Woreda of Agriculture Office [WAO], Citation2017). The woreda has latitude and longitude of 11°34′N 41°26′E and an elevation of 300 m (980 ft). In the woreda, pastoral and agro-pastoral system of livestock production is the dominant practice. The mean temperature is between 30ºC and 45ºC per annum. (Afar National Regional State [ANRS], Citation2010).
Figure 1. Map of the study area
2.2. Sample size and sampling technique
The study attempted to select a sample following the laws of the statistical theory of sampling that help to make valid inferences about the population basing on the information or data obtained from the sample and to ascertain the degree of accuracy of the results. The total amount of households in Asayitta worda were 9943.Therefore, the sample size for this study was determined by the formula developed by Yamane (Citation1967).
Where: n = sample size (153), N = household size (9943) and e = level of precision (0.08)
The study applied a multi-stage sampling technique which comprises of purposive, stratified and simple random sampling procedures to select the respondents for this study. Asaita from the seven woreda in zone one was selected as the target woreda. In the first stage, Asaita woreda was selected purposively from other remaining woreda because this woreda was the initial capital city of afar region and there is better infrastructure to diversify income sources. In the second stage, 3 among the total 13 kebelesFootnote1 found in the woredaFootnote2 were drawn after stratifying them into 3 strata as near, medium and far based on the criteria of their distance from woreda town, 3 sample kebeles one from each strata were selected by using simple random sampling techniques. Finally, representative samples of 153 rural households were drawn from three kebeles which are Bergaset, Kereguda and Mamuliye following a lottery method of simple random sampling techniques.
2.3. Sources and methods of data collection
Both primary and secondary sources were used for the study. The primary data were collected from sample rural households through interview using semi-structured questionnaires prepared and pre-tested for its validity and reliability. Both primary and secondary data were collected using qualitative and quantitative approaches since the study was specifically a survey method.
2.4. Methods of data analysis
The data were analysed using both descriptive and inferential statistical tools. In addition to descriptive and inferential statistics fractional response probit regression model was used.
2.4.1. Estimating the degree of income diversification
Simpson Index of Diversity (SID) is used to measure the level of income diversification. This study prefers SID to the other approaches used to estimate the degree of income diversification among farm households in the Asayita woreda, as it takes into consideration both the number of income sources as well as how evenly the distributions of the income between the different sources are (Joshi et al., Citation2005; Agyeman et al., Citation2014; Dev et al., Citation2016). The value of SID ranges between zero (0) and one (1). Thus, zero denotes specialization (only one source of income, where Pi = 1) and one the extremity of diversification.
The general formula of SID is given as:
Where n = number of income sources, Pi = Proportion of income coming from the source ith source to the total household income obtained from all sources, and i = 1, 2 … n.
In this study, the SID model is expressed as:
Where CI = Crop income, LI = Livestock income, FWI = Formal wage income, NFWI = Non formal wage income, SEI = Self-employment income, RMI = Remittance income, RTI = Rent income, OI = other income sources and THI = Total household income from all income sources.
2.4.2. Determinants of income diversification
The fractional outcome probit regression model is used to identify the factors that determine rural household’s engagement in income diversification (measured by SID with values limited between 0 and 1). In this case the presence of zeros and one as values of the dependent variable (SID) for some respondents (thus showing no diversification and extreme diversification) demands the use of fractional response regression model. Under the general formulation for fractional response regression model we have a continuous dependent variable y in [0, 1], and a vector of independent variables (x). Fit a regression for the mean of y conditional on x: E(y/x) because y is in [0, 1], restrict that E(y/x) is also in [0, 1]. Papke and Wooldridge (Citation1996) consider the following model for the conditional expectation of the fractional response variable.
Where 0≤ yi ≤1 denotes the dependent variable SID and (the k × 1 vector) ix refers to the explanatory variables of observation i typically, G (.) is a distribution function.
Description of variables used in fractional response model and their hypotheses. Dependent variable: The dependent variable in this study was level income diversification. Household level of income diversification is a continuous variable representing the level of household income diversification. Review of literatures and author’s knowledge of the income diversification situation of the study area were used to identify the potential determinants of household income diversification. Therefore, assigning the household level of income diversification as the dependent variable, the following variables were selected to analyse whether they explain household’s level of income diversification or not. Definitions and measurement of the independent variables and their working hypothesis are described in Table .
Table 1. Definition and units of measurement for explanatory variables used in fractional response model
Table 2. Descriptive statistics of categorical variables with income diversification
Table 3. Descriptive statistics of continuous variables with income diversification
Table 4. Fractional response probit model results on income diversification
3. Results and discussion
3.1. Socio-economic characteristics of households across income diversification
Based on table two the level or intensity of income diversification is affected by different socio economic characteristics of households. From the total sample households 77.1% was male and the remaining 22.9 were female-headed households. The mean value of male and female were 0.24 with standard deviation of 0.26 and 0.27 respectively. The study t-test result shows that there is no significance difference between male and female households on the level of income diversification index. According to educational status of households 40.52% were literate and 59.48 were illiterate. The mean values of literate and illiterate households were 0.38 and 0.14 respectively and the standard deviation were 0.26 for literate and 0.21 for illiterate households. T-test was employed to depict the association between educational status of the respondents and their level of income diversification. The result indicated that there is statistically significant association between educational status and level of income diversification at 1% probability level. In terms of credit utilization of respondents 0.22 and 0.25 were the mean value for credit utilizes and none utilize and with 0.26 standard deviation respectively.
From the total sample households 50.33% were having access to electric power and the remaining 49.67 were having not access to electric power. The mean value of household who having access to electric power were 0.3 with standard deviation of 0.27 and for households who have not access to electric power were 0.17 with standard deviation of 0.23. The study t-test result shows that there is significance difference between having access to electric power and having no access to electric power households on the level of income diversification index at 1% probability level. In terms of having special skill 35.95% of respondents were have special skill and the remaining 64.05 were have not special skill. The mean values of having special skill were 0.51 with standard deviation value of 0.14 but the mean values of do not having special skill were 0.09 with standard deviation value of 0.18. The result of t-test indicated that there is statistically significant association between special skill of households and level of income diversification at 5% probability level. Access to training is another variable which affect level of income diversification and from sample households 47.71% of household’s heads have got training access and the remaining 52.28% were not get training access. The mean value households who got training access were 0.18 with standard deviation of 0.28 and the mean value households who not got training access were 0.3 with standard deviation of 0.22. The t-test indicates there is significance difference among level of income diversification based on training access of households at 5% probability level.
Based on the above table age of the respondents was a range from 26 to 80 years with a mean and standard deviation of 53.64 and 13.08 years, respectively. The correlation between age of the household and Simpson diversification index is insignificant. Household size refers to the number of individuals who live in the same house having common goal for a minimum of 6 months. The survey result indicated that the average household size of the total observation was 5.57 with standard deviation of 2.69. Based on Table 6, the maximum and the minimum household size were 5 and 2 respectively. The correlation between household size of the household and SID is significant positively at 5% probability level. Based on dependency ratio the result of this study indicated that the minimum and maximum number of dependents were 0 and 3 with mean and standard deviation of 1.13 and 0.87, respectively. The correlation between dependency ratio of the household and SID is significantly and negatively at 5% probability level. The average size of the land owned by sample households was 2.81 hectare with standard deviation of 2.03 hectare. The maximum and the minimum land size were 5 and 0.5 hectare respectively. The land size of the households with SID correlates significantly and negatively at 1% probability level.
The result indicated that the respondents own 19.39 TLU on average with standard deviation of 19.7 TLU. The maximum and the minimum tropical livestock unit were 67and 0 TLU respectively. Livestock unit of the household and SID correlate significantly and negatively at 10% probability level. Distance from the market was considered as one factor for affecting the level of income diversification. The result indicated that the average distance of the market from the respondents’ house was nearly 1 h and 53 min with standard deviation of 0.95 min. The maximum and the minimum walking distance to local market per hour were 4 h and 20 min respectively. The correlation between distance from the market of the household and SID is significantly and negatively at 1% probability level. Based on annual household income the result indicated that the average annual household’s income was 74,339.6 birr with standard deviation of 36,664.12 birr. The maximum and the minimum annual household income were 276,300 and 12,000 birr respectively. Annual household income correlates with degree of income diversification significantly and positively at 1% probability level.
3.2. Intensity of income diversification
Households in the study area mainly earn their income from farming, petty trading, wage labour, service etc. However, most of the people in the study area are involved in agriculture. Households were classified into six categories based on how they obtain their living. Six income diversification sources were identified among the households, namely, farming, formal wage income, self employment income, non-formal wage income, remittance income and rent income share. Majority of the household’s members derived their livelihood by farming. The SID was used in this study to estimate the intensity of income diversification among farm households in the Asayita woreda.
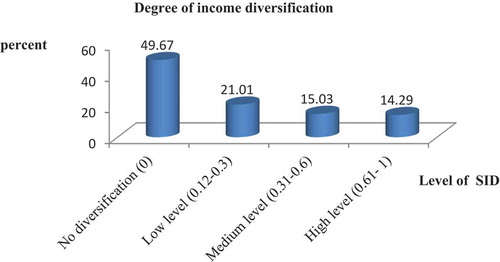
According to Tithy Dev et al. (Citation2016), the level of income diversification from 0 up to 0.3, 0.31 up to 0.6, and 0.61 up to 1 was low, medium and high level of income diversification index. The results in figure two show the degree of income diversification among the farmers in the study area. Respondents with the most diversified income sources had the largest index and those with the least income sources had the smallest index. Based on Figure 2, from the total sample household 76 in number or 49.67% had a diversity index of 0. Based on the result almost half of the sample household does not diversify their income sources. This implies that those farmers did not diversify their income sources or participating in to one economic activity. Small-holder farmers whose Simpson diversity index equal to zero means household participate in to one types of economic activity it may be agriculture, formal employment, petty trade only etc. They specialize in to one economic or one income-generating activity. About 32 households or 21.01% had diversity index between 0.12 up to 0.3, 23 households or 15.03% had between 0.31 up to 0.6 and about 22 households or 14.29% had diversity index between 0.61 and 0.78.
The mean income diversification index is 0.24 which is low in the study area. The mean intensity of diversification of 0.24 is lower than observed by Babatunde and Qaim (Citation2009) of 0.479 in Nigeria, the finding of Agyeman et al. (Citation2014) in Ghana 0.338 and the finding of Tithy Dev et al. (Citation2016) in Bangladesh with the SID value of 0.25. The reason behind this is that most of the people living in the rural area are vulnerable as they depend only on agriculture related activities for their livelihood and they are subject to different types of risks (natural disaster) like drought, scarcity of irrigation water, non-availability of other income sources etc. Although formal wage employment, rent income and self-employment income are the new sources of income emerged to the rural households, these activities are mostly run by the educated and rich farmers. The low observed degree of income diversification shows that farm households in the Asayita Woreda are less diversified in relation to the income-generating activities they engage in. This implies that an average respondent in the study area had its members involved in almost in small types of income-generating activities simultaneously. These activities were distributed between the two sectors, that is the farm and non-farm sectors due to long list of activities identified in the area. On average, a respondent was involved in at least one farming activity and one non-farm activity.
Figure 2. Distribution of the farmers by their intensity of income diversification
3.3. Determinants of income diversification
3.3.1. Male-headed households
Sex of household head affects diversification sources, including the choice of income-generating activities (both farm and non-farm) due to culturally defined roles, social mobility limitations and differential ownership of/access to assets. From the result of focus group discussion and key informant interview the above listed problems hinder female head households to participate in different income-generating activities. It was found that male headship has a positive and significant effect on income diversification at 5% probability level. This result agrees with the prior findings of Ellis (Citation1999), Olale et al. (Citation2010), and Demissie and Legesse (Citation2013); Yishak (Citation2017). Thus, keeping other thing remain constant; the level of diversification increase by 4.28% when the household head is male (male-headed households).The opposite is true for the female counterparts implying that they are less likely to participate in non-farm income-generating activities. The possible reason is that female heads have more responsibilities in home management (non-income-earning activity) while their counterparts have more tendency of engaging in different non-farm income-generating activities improving their income earnings. Studies indicated that women rarely own land, may have lower education and their access to productive resources as well as decision-making tend to occur through the mediation of men (Demissie & Legesse, Citation2013).
3.3.2. Household size
Most studies on non-farm income diversification agree on the positive effect of household size as the larger family size the higher probability of the households to the supply labour to the non-farm sector (Demissie & Legesse, Citation2013; Teshome & Edriss, Citation2013; Zerai & Gebreegziabher, Citation2011). However, one can argue that household size could be a liability for the overall welfare of the household if the number of labour-contributing members is less than the dependents. Thus, in order to capture this aspect of household labour supply, we have included dependency ratio as one explanatory variable in the model. The results show that dependency ratio is not a key demographic variable that negatively relates to non-farm activity participation or SID. Household size is also found to be among the influential variables in the model. It has a positive and significant effect on income diversification at 10% significant probability level. This is in line with what is expected, in the sense that having more household size in a limited and marginalized land agricultural income alone could not meet food security/livelihood and hence farmers might tend to involve in different non-farm activities that bring additional income. Thus, keeping the influence of other factors constant the level of income diversification index increased by 0.91% when the household size of household increased by one person. Unquestionably, land is a fixed input for all the farmers in the study area. Therefore, it is unproductive to involve all the family members in this limited size of land resources. Consequently, household members would try to find other alternatives income sources to generate additional income. Thanks to the “agricultural transformation and industrialization” policy of the country, helps create good opportunity for farmers to get employed in construction projects around the locality. In addition to this, as family size increases members of the family who are capable of working, would participate in one or more non-farm activities stated earlier, which also increase income of the household in question. This suggests that the larger the family size the more the income earned from non-farm activities. Descriptive analysis result indicates the level of diversification increase as family size of households increase.
3.3.3. Educational status of household head
As expected, the level of education is significant at 1% probability level, and has a positive relationship with the level of income diversification index. This implies as the level of education (years of schooling) of the household increases by 1 year, the level of income diversification index increases by 8.75%, ceteris paribus. This results agrees with the prior findings of Ahmed (Citation2016); Yishak (Citation2017) and contradicts with Oluwatayo Isaac (Citation2009); Demissie and Legesse (Citation2013) by arguing that educated persons specialized one activity rather than diversification. Special skill: As expected, having special skill of household member is significant at 10% probability level, and has a positive relationship with the level of income diversification sources. A special skill is the other factor that significantly influences the non-farm employment participation of households positively suggesting that skilled households are more likely to engage themselves in more paying self-employment activities. More specifically possessing skills such as masonry, driving licences, handcrafts and merchants increase the probability of involvement in non-farm activities to the villages that are closer to the nearby towns while skills such as tannery, pot making and goldsmith are associated to the villages that are far from towns. This implies as the level of having one additional special skill of household members increases, the intensity of income diversification increases by 4.4% ceteris paribus. This result is in line with the findings of (Zerai & Gebreegziabher, Citation2011).
3.3.4. Credit utilization
Access to credit affect the level of income diversification of household’s positively and significant at 1% level of significance. The result defines to our prior expectation. This means credit utilization by household would increase income diversification level by 9.03%. This result is similar to that reported by Babatunde and Qaim (Citation2009); Zerai and Gebreegziabher (Citation2011) who noted that credit can reduce liquidity constraints and increase the capacity of households to start non-farm business. Access to credit market is found to be one of the strong and major determinants of participation in non-farm activities. Households with access to formal credit are more likely to participate in non-farm activities than those without access and it improve the level of income diversification. Access to the credit market gives opportunities to farm households to get the necessary capital to start up or to be participated in non-farm employments.
3.3.5. Distance from market
As hypothesized, distance from the market was significantly and negatively related to level of income diversification index into the combination non-farm and farm income-generating activities at 1% probability level. This implies that farther the household from market centre lower the degree of income diversification. If the other factors remain constant, the marginal effect of farm household’s level of income diversification decreases by 11.8% as household’s residence increase from woreda weather market centres by 1 h. This result is consistent with result reported by Oluwatayo Isaac (Citation2009), Demissie and Legesse (Citation2013), Teshome and Edriss (Citation2013), Fufa (Citation2015), and Ergicho and Markos (Citation2015); Yishak (Citation2017). This negative relationship indicates that households who lived farther away from the market are less likely to be involved in non-farm and off-farm activities. The possible justification could be households who are closer to the market centres do not have much cost to access market incentive for diversification of income sources. It is obvious that, if farmers are unable to reach the market to sell their outputs from non-farm activities, they could be discouraged to involve in such activities. Moreover, the common non-farm and off-farm activities in the locality such as petty trade require immediate market in order to produce more. Therefore, a long distance to the nearest market reduces the level of income diversification index. This result revealed that road infrastructure is the most important factor in participation of non-farm activities and to increase degree of income diversification in all cases of rural income diversification strategies to earn income from non-farm employments in addition to farming income.
3.3.6. Access to electric power supply (Access to EPs)
Consistent with the hypothesis, access to electric power supply has a positive significant at 1% probability level influence on SID. The positive sign in the model output implies that electric power supply access have effect on increasing income sources of households. The marginal effect of electric power access was found to be 0.0659. This implies, ceteris paribus, if household have electric power supply access SID is increased by 6.5%. This result is consistent with result reported by Zerai and Gebreegziabher (Citation2011). A positive influence of village electrification on non-farm employment participation was expected due to the fact that villages having electricity are close to the town/city and thus more non-farm employment opportunities and labour market. The variable electricity is consistent with our prior expectation. It has positive and significant influence of electricity on level of income diversification evident from the result.
3.3.7. Annual household income
This variable was found to have positive and significant influence on the level of income diversification into non-farm activities at l0% probability level. This result implies that households having large cash income are more likely to diversify the income-generating activities into non-farm activities and increase the level of diversification index and those farmers with low income are less likely to participate in income diversifying income activities than those who have high income and their level of diversification index were low. Small-holder farmers who have adequate income sources can overcome financial constraints to engage in alternative income-generating activities and leads to improve income diversification level. Hence, higher income can encourage households to invest in other income-generating activities. From the model result, other things being constant, marginal effect reveals that if the household income is increase by 1% level of income diversification increased by 2.3%. Yishak (Citation2017) show that income is one of the most important determinants of income diversification in to non-farm and/or off-farm activities.
4. Conclusion and recommendation
A number of rural households engage in diverse income-generating activities away from purely crop and livestock production. This study attempts to measure the level o income diversification and to investigate the determinants of income diversification using the survey data collected from 153 randomly selected households from three kebeles of Asayita Woreda, Afar region Ethiopia. Both descriptive analysis and econometric estimation results have been used to answer the stated key research questions Based on income diversification the independent T-test result indicates that educational status, access to electric power, having special skill and access to training had statistically significant effect on level of income diversification. Households in Asayita woreda generate income from farm and non-farm activities. Generally households classified in to six categories based on income sources, those are farm income, formal wage employment, non-formal wage employment, self-employment, remittance and rent income. The income composition of rural households indicates that agricultural income takes the highest share followed by formal wage employment income sources. This study show that activities outside of the agricultural sector play an important role in this study area contributing about 48% of the total household income. The result of SID indicates that the mean value of level income of diversification index is 0.24 which is low in the study area. Under no, low, medium and high level of diversification 49.67%, 21.01%, 15.03% and 14.29% of households’ categorized respectively. The reason behind is that most people have no idea about area and strategy of income diversification, most of the people living in the rural area are vulnerable as they depend only on agriculture related activities for their livelihood and they are subject to different types of risks (natural disaster) like drought, scarcity of irrigation water, non-availability of other income sources and due to lack of industrial and service sectors, there is limited scope to diversify their sources of income etc. Small-holder farmers have been constrained by various factors while accessing the non-farm employments or the level of income diversification. A frequently cited reason are lack of initial capital, fear of losing land if involving in activities outside agriculture, do not have skill or knowledge and scarcity of labour.
Fractional response regression probit model was employed to answer the question “what are the factors that determine the level of income diversification among the farm households.” The result of the model indicated that male-headed household, education, household size, special skill, electricity, credit utilization and annual household income had statistically significant positive effect on households’ level of income diversification. This implies that the above variables increase the level of income diversification of respondents unlike negatively related variables. But distance to the market had negative and significant effect on the level of income diversification. To make considerable improvement on level of income diversification status in Asayita woreda the following measures and actions should be taken by household heads, administration of region and woreda, national and international organizations. The possible areas of intervention that emanate from the results of this study are presented as follows:
To increasing the extent of income diversification, government should continue its efforts to generate income earning opportunities in the rural areas and support the farmers to enhance agricultural productivity through supportive policies including input utilization and creating market for their product.
Government and other responsible bodies design necessary strategies so as to create awareness among the community to participate women equally with man in all development activities.
Maintaining sustainable rural livelihood, especially road accessibility play vital role in facilitating access to markets, Hence, need to provide more rural roads and rehabilitate eroded ones in order to reduce the high transaction cost of buying from or selling to markets, as transaction cost reduces the returns from market sales. This will encourage the development of rural road to facilitate farmers’ participation in diversified economic portfolio. Therefore, government policy should pay more attention on infrastructure to reduce the entry barriers and facilitate easier access to non-farm activities.
The concerned body has to work more to increase the access to education in the study area in order to explore the existing opportunity of income diversification via non-farm activities
Additional information
Funding
Notes on contributors

Mohammed Adem
Mohammed Adem is a lecturer in the department of economics at Samara University. He received his MSc in Agricultural Economics from Bahir dar University. He has conducted several courses for Economics, Accounting, Statistics and Geology department students. His area of interest lies in conducting research on the status of food security, income diversification, production and marketing constraints of the agricultural sector, value and market chain analysis, economic valuation and conservation of national park of Ethiopia and so on.
Notes
1. The smallest administrative units of Ethiopia.
2. The third (next to region and zone) level administrative division of Ethiopia.
References
- Afar National Regional State (ANRS). (2010). Program of plan on adaptation to climate change.
- Agyeman, B. A. S., Asuming-Brempong, S., & Onumah, E. E. (2014). Determinants of income diversification of farm households in the Western region of Ghana. Quarterly Journal of International Agriculture 53(1), 55-72
- Ahmed, B. (2016). what factors contribute to the income differential? ISSN (e): 2223-1331/ISSN (p) Evidence from East Hararghe, Oromia, Ethiopia
- Babatunde, R. O., & Qaim, M. (2009). Patterns of income diversification in rural Nigeria: Determinants and impacts. Quarterly Journal International Agriculture., 4(4), 305–15. DLG-Verlag, Frankfurt/M.
- Canali, M., & Slaviero, F. (2010). Food insecurity and risk management of smallholder farming systems in Ethiopia [Paper presented]. The Ninth European IFSA symposium. Vienna, Austria.
- CSA (Central Statistical Agency). (2012). Population and Housing Census of Ethiopia: Administrative Report. Journal of Urban Management 8.2 (2019): 237-244
- CSA (Central Statistical Agency). (2016). The federal democratic republic of Ethiopia central statistical agency. International Journal of Scientific and Research Publications, 6(5).
- Demissie, A., & Legesse, B. (2013). Determinants of income diversification among rural households: The case of smallholder farmers in Fedis district. Eastern Hararghe Zone, Ethiopia, 5(3), 120–128.
- Dev, T., Sultana, N., & Hossain, M. E. (2016). Analysis of the impact of income diversification strategies on food security status of rural households in Bangladesh: A case study of Rajshahi district. American Journal of Theoretical and Applied Business, 2(4), 46–56. https://doi.org/10.11648/j.ajtab.20160204.13
- Dimova, R. D., & Kunal, S. (2010). Is household income diversification a means of survival or a means of accumulation? Panel Data Evidence from Tanzania. Available at SSRN: https://ssrn.com/abstract=1688433
- Ellis, F. (1998). Household strategies and rural livelihood diversification. The Journal of Development Studies, 35(1), 1–38. https://doi.org/10.1080/00220389808422553
- Ellis, F. (1999). Survey article: Household strategies and rural livelihood diversification in developing countries. Journal of Agricultural Economics, 51(2), 289–301. https://doi.org/10.1111/j.1477-9552.2000.tb01229.x
- Ergicho, Y., & Markos, A. (2015). Assessing determinant factors of income diversification among rural farm households in Ethiopia: The case of Leemo and Anileemo districts, Hadiya Zone, South Nation Nationalities People Region. International Journal of Science and Research, (IJSR) (Online), 2319–7064.
- Fufa, M. (2015). Factors responsible for income diversification among rural farm households in Agarfa district, Bale Zone, Oromia National Regional State(Ethiopia (Doctoral dissertation, Haramaya University).
- Yishak, Gecho. (2017). Rural farm households’ income diversification: the case of wolaita zone, southern ethiopia.social. 2 (2017), 45-56. doi:10.11648/j.ss.20170602.1
- IFAD (International Fund for Agricultural Development). (2011). Rural Poverty Report. New Realities, New Challenges, New Opportunities for Tomorrow’s Generation. Oxon and New York: Routledge. 2014 Mar 21:230-5
- Joshi, P. K., Gulati, A., Birthal, P. S., & Tewari, L. (2005). Agricultural diversification in South Asia: Patterns, determinants and policy implications economic reforms and food security: The impact of trade and technology in South Asia. Haworth Press Inc.
- Kilic, T., Carletto, C., Miluka, J., & Savastano, S. (2009). Rural nonfarm income and its impact on agriculture: Evidence from Albania. Agricultural Economics, 40(2), 139–160. https://doi.org/10.1111/j.1574-0862.2009.00366.x
- MOARD (Ministry of Agriculture and Rural Development). (2010). Ethiopia’s agricultural sector policy and investment framework 2010-2020. Federal Democratic Republic of Ethiopia (FDRE).
- Nagler, P., & Naudé, W. (2014). Non-farm entrepreneurship in rural Africa: Patterns and determinants. For schungs institut zur Zukunft der Arbeit Institute for the Study of Labor.
- Olale, E., Henson, S., & Cranfield, J. (2010, July 25-27). Determinants of income diversification among fishing communities in Western Kenya. Selected paper prepared for presentation at the agricultural and applied economics association 2010 AAEA, CAES and WAEA joint annual meeting, Denver, Colorado.
- Oluwatayo Isaac, B. (2009). Poverty and income diversification among households in rural Nigeria: A gender analysis of livelihood patterns. University of Ado-Ekiti.
- Oyewole, E., & Henson, S. (2012). Determinants of income diversification among fishing communities in Western Kenya. Fisheries Research, 125, 235–242.
- Papke, L. E., & Wooldridge, J. M. (1996). Econometric methods for fractional response variables with an application to 401(k) plan participation rates. Journal of Applied Econometrics, 11(6), 619–632. https://doi.org/10.1002/(SICI)1099-1255(199611)11:6<619::AID-JAE418>3.0.CO;2-1
- Teshome, B., & Edriss, A. K. (2013). Determinants and patterns of income diversification among smallholder farmers in Akaki district. doi:10.22004/ag.econ.157598. No. 634-2016-41518. 2013
- WAO (Woreda of Agriculture Office). (2017). Asayita Woreda, Unpublished report.
- World Bank. (2009, October 6). Diversifying the rural economy: An assessment of the investment climate for small and informal enterprises in Ethiopia [Report number 49564-ET]. World Bank Economic Sector Work, Vol. 49564-, (6 October 2009)
- Yamane, T. (1967). Statistics, an Introductory Analysis (2nd ed.). Harper and Row.
- Yizengaw, B. (2014). Determinants of household income diversification and its effect on food security status in rural Ethiopia: Evidence from Ethiopia longitudinal rural household survey. World Bank Economic Sector Work, Vol. 49564-, (6 October 2009
- Zerai, B., & Gebreegziabher, Z. (2011). Effect of nonfarm income on household food security in Eastern Tigrai (Vol. 1). An Entitlement Approach.