
 ?Mathematical formulae have been encoded as MathML and are displayed in this HTML version using MathJax in order to improve their display. Uncheck the box to turn MathJax off. This feature requires Javascript. Click on a formula to zoom.
Abstract
The notion of the determinants of import demand has become a major policy issue in most countries due to the persistent trade deficits being experienced and their effects on the economy. Against this backdrop, this study empirically examined the factors determining import demand in Zimbabwe using a gravity model. Forty trading partners for Zimbabwe and data for the period 2004 to 2017 were employed. The model was estimated using Ordinary Least Squares (OLS) with and without fixed effects and the findings were that gross domestic product and trade openness for Zimbabwe and her trading partners had a positive impact on import demand. Furthermore, inflation and population for Zimbabwe as well as its trading partners’ and bilateral distance were found to be negatively related to import demand. More so, the study found out that dollarization has managed to increase import demand. Based on these findings, policies directed at reducing import demand should target trade openness, population and inflation level. The findings also imply that de-dollarization is an effective strategy to reduce import demand.
PUBLIC INTEREST STATEMENT
This research examined the factors determining import demand in Zimbabwe using a gravity model. The findings of this research were that import demand is determined by GDP for Zimbabwe and its trading partners, geographical distance, regional trade agreements, language barriers and dollarization. Against the background of persistent trade deficit, these results help policymakers when advancing policies or measures to reduce import demand and hence reduce the devastating deficit. To the academic front, the research contributes to the literature on the investigation of the determinants of import demand with a gravity model. In these ways, the study provides support to both policymakers and academia.
1. Introduction
In both policy circles and academia, international trade is regarded as a key enabler and driver of economic development in developing countries. Imports, just like exports, are key in international trade and are regarded as goods accessed that cannot be produced by local firms such as capital goods (Egwaikhide, Citation1999). More so, through importing, domestic firms obtain raw materials from regional and international markets that are key in the production process and cannot be sourced in the domestic market. According to Lawrence and Weinstein (Citation2001), imports lead to a competition that benefits consumers in terms of quality and cheap products. Despite the importance of imports, most countries have been facing persistent trade deficits (imports greater than exports) that are considered to be unsustainable and non-optimal for the virtuous performance of the economy and high import demand is one of the causes of the devastating deficits. In addition, high import demand is associated with a leakage of foreign currency and a weak trade balance, thus weakening economic growth (Bakari & Mabrouki, Citation2017). Against this background, considerable interest and focus by policymakers and researchers on the subject of import demand have been high, globally.
Several studies have been carried out across the globe to investigate the determinants of import demand and pointed out different factors as affecting import demand. For instance, Aziz and Horsewood (Citation2008), Modeste (Citation2011), Hibbert et al. (Citation2012), and Ibrahim and Ahmed (Citation2017) found out that Gross Domestic Product (GDP) determines import demand whereas Chimobi and Ogbonna (Citation2008) found out that GDP does not affect import demand. In the same vein, Hibbert et al. (Citation2012), Muhammad and Zafar (Citation2016) and Ibrahim and Ahmed (Citation2017) concurred that import demand is determined by prices while Chimobi and Ogbonna (2008) found out that exchange rate and price rate do not have an impact on import demand.
The existence of conflicting findings in the literature highlights the significance of a study to determine the factors affecting import demand as the results cannot be generalised to any country due to different country characteristics and methodology used in the investigation. These studies largely used time-series data approaches while leaving the use of panel data and its related approaches, such as a gravity model, a thinly explored area. More so, these studies were carried out for non-dollarized economies while leaving the empirical investigation for dollarized economies limited. This means that little is known for the determinants of imports for dollarized economies. In light of these areas, this study extends the extant literature by focusing on a dollarized economy, Zimbabwe. More so, the study uses a gravity model, which is theoretically based and is considered in the literature as an appropriate tool for bilateral trade analysis. Such attempts will contribute to the growing body of literature and the results will be useful to policymakers as they will be informed of the factors behind the changes in import demand.
In recent years, Zimbabwe has been experiencing rising import volumes that have been above exports in most years. As such, policymakers need to know the factors behind the rise in imports and hence its import demand function. This will help them to make policies that will successfully lead to the restoration of external balance. Nevertheless, unless policymakers know what the drivers of import demand are, such policy decisions can be detrimental to investment and output if local production depends on imports. Against this background, the aim of this study is to investigate the determinants of import demand in Zimbabwe with her trading partners during the period 2004 to 2016 using a gravity model. In light of this objective, this study seeks to answer the question, what determines import demand in Zimbabwe?
The organisation of the rest of this study is as follows: Section 2 provides an overview of the trend in total imports, import structure and origins of Zimbabwe’s imports; Section 3 provides the literature review; Section 4 discusses the methodology; Section 5 discusses the findings and Section 6 gives conclusions and policy implications.
2. Overview of total imports, import structure and origins of Zimbabwe’s imports
2.1. Overview of total imports
Since 2000, Zimbabwe has been characterised by an increasing trend in imports and has been a net importer of goods in terms of both value and volume (Bonga et al., Citation2015). Figure illustrates the trend in imports of goods in relation to exports, as well as the trend in trade balance during the period 2004 to 2017.
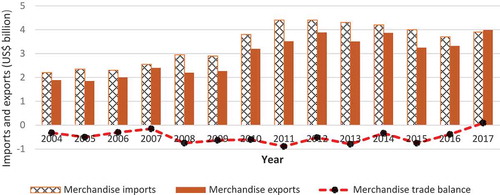
As shown in Figure , merchandise imports were above merchandise exports for all years except for 2017 where they are slightly below merchandise exports. In 2004, merchandise imports were US$2.21 billion, and they increased exponentially over the period 2004 to 2008 where they grew at an average rate of 33.86% against an increase in exports by 16.59% during the same period. The increase in imports, probably, was because of high inflation rate, among other factors, that might have compelled local citizens to import goods from other countries where they were cheaper than locally. Over the 2004 to 2008 period, highest merchandise imports of US$2.95 billion were experienced in 2008 when the economy was in an economic crisis characterised by a low economic growth rate of −17.67% and a high inflation rate of 231 million percent (Zimbabwe National Statistical Agency, Citation2018; World Bank, Citation2019). In 2009, the economy of Zimbabwe was dollarized and a basket of currencies that included the South African Rand, Botswana Pula, UK Sterling Pound, US dollar and Euro was accepted as legal tender (Reserve Bank of Zimbabwe, Citation2014). Dollarization managed to tame the devastating hyperinflation and brought stability in the economy. In 2010, imports were US$3.8 billion, which is a higher level than the highest pre-dollarization level of US$2.95 billion experienced in 2008. The increase in imports was without respect to the stable prices that were being experienced but to the reason that trade was facilitated by the use of the same currenciesFootnote1 and that some currencies such as the US dollar were stronger than the currencies used by Zimbabwe’s trading partners. During the dollarization period, the average import growth rate was 27.59%. As illustrated in Figure , imports and exports before dollarization were lower than imports and exports during the multicurrency/dollarization period.
2.2. Zimbabwe’s import composition
Zimbabwe imports a wide range of products that includes almost all types of products or commodities. These imports include machinery and mechanical appliances, raw materials, food products, fuels, minerals, textiles and clothing, footwear, electricity, chemicals, metals and intermediate products, among others. Over the study period, products that had significant shares in the import bill were consumer goods, fuels, machinery and mechanical appliances, chemicals and electricity. The composition of Zimbabwe’s imports for 10 major products for selected years is summarised in Table .
Table 1. Import composition for Zimbabwe
2.3. The origins of the Zimbabwean imports
Zimbabwean imports originate from various parts of the world where the country has various political friendships and trade agreements—bilateral, regional and multilateral, among other defining factors. Prior to the imposition of the so-called targeted sanctions against Zimbabwe, the major trading partners for Zimbabwe were developed nations such as Germany, United States of America and United Kingdom, but each of these countries accounted for no more than 15% of the total imports (Saungweme, Citation2013). However, when sanctions were imposed in 2001 by the US, Zimbabwe changed from trading mainly with these developed nations to trading predominantly with neighbouring countries (South Africa, Zambia, Malawi and Mozambique) and other countries outside Africa where it sought friendship (for example, China and India). Table shows the top 10 origins of Zimbabwe’s imports over the period 2004–2018.
Table 2. Zimbabwe’s major importing origins
As shown in Table , South Africa has been the major trading partner for Zimbabwe since 2002. In 2002, imports from South Africa accounted for 52.6% of the total imports and UK, Japan and US accounted for 4.9%, 2.9% and 3.5% of the total Zimbabwean imports, respectively. During the period of economic crises that was characterised by high inflation rate and poor economic growth, imports from other countries such as China, India, Mauritius, Botswana and Zambia were increasing. When the economy experienced hyperinflation in 2008, South Africa was the major trading partner for Zimbabwe with 62.1% of imports originating from South Africa and it remained Zimbabwe’s major trading partner when the economy was dollarized with 60.46% share of total imports. During the early dollarization period, imports from countries that had the currency that was in the basket of currencies, Chinese Yuan, Rand, US dollar, Pound and Pula were relatively higher than those from other countries.
However, as the cash crisis emerged in the economy in 2013, imports started to decline and share of imports from South Africa declined from 60% in 2009 to 47.49% in 2013 and further declined to 39.3% in 2018. In the same vein, imports from other countries such as United Kingdom, Zambia, Mozambique, Botswana and USA were also declining probably due to the shortage of the US dollar which was the predominant currency. Over the period 2004 to 2018, South Africa has the highest average import share of 45.1 followed by Zambia, China, United Kingdom and USA with 5.7%, 5.3%, 4.6% and 4.2% average import share, respectively. This analysis indicates that South Africa has been the major trading partner for Zimbabwe in terms of imports.
3. Literature review
Several studies have been carried out to investigate the factors determining import demand in different nations. These studies have used different approaches in the domain of panel data and time-series data. Of the studies that have used panel data, very few have investigated the determinants of import demand using a gravity model. What follows are some of the studies that have been carried out on import demand in different countries.
Dutta and Ahmed (Citation1999) used an error correction model to investigate the demand function for India during the period 1971 to 1995. The results were that import volume was cointegrated with GDP and relative import prices. The results suggested that import demand was largely explained by real GDP and was generally less sensitive to changes in import price. Similarly, import liberalization was found to have little impact on import demand in the Indian.
In Bangladesh, Aziz and Horsewood (Citation2008) investigated the determinants of aggregate import demand using Johansen cointegration and error correction technique. The study used annual time-series data ranging from 1980 to 2006 and the variables that were used as explanatory variables include real GDP, relative prices, import price index, Consumer Price Index (CPI), investment goods expenditure, real exports, real foreign exchange reserves and a dummy variable to capture liberalisation. The study found out that income had a positive impact on import demand whereas relative prices and import price had a negative impact on import demand in Bangladesh. The study reported that trade liberalization could not make any difference for the import demand of Bangladesh.
Modeste (Citation2011) empirically analysed the demand for imports in three CARICOM countries (Guyana, Jamaica, and Trinidad and Tobago) using a bounds testing approach to cointegration during the period 1968 to 2006 for Guyana and Trinidad and Tobago and 1970 to 2006 for Jamaica. The study used consumption, real investment expenditure, real exports, ratio of price of imports to domestic price and real income and found out that there was a long-run relationship between the volume of imports and its determinants in all countries. More so, the study found out that there was a positive relationship between imports and consumption, investment and exports. The results are similar to those of Harvey and Sedegah (Citation2011) who analysed the structure of and model for imports using data ranging from 1967 to 2004 in Ghana. Harvey and Sedegah (Citation2011) also found out that the import demand function was stable over the study period.
Hibbert et al. (Citation2012) estimated an import demand function for Jamaica with the United States (US) and United Kingdom (UK) using data spanning from 1996 to 2010. The study used cointegration and error correction modelling techniques, and real GDP, relative price of imports, real foreign reserves and exchange rate volatility were used as the regressors. The study found out that there was a unique cointegrating relationship between imports and the explanatory variables in both the models for UK and US. More so, the study found out that the responsiveness of import demand to price was very high in the short run for the case of the Jamaica–US model. In the case of Jamaica–UK model, exchange rate volatility was less elastic in the short run than in the long run.
Ibrahim and Ahmed (Citation2017) investigated the determinants of aggregate imports in Sudan using time-series data spanning from 1978 to 2014. The study used Johansen cointegration and Ordinary Least Squares (OLS) technique and established that there was a long-run relationship among the volume of imports, domestic income, relative prices and exchange rate of which domestic income had the greatest impact on the volume of import than other factors.
There are also studies that were carried out using panel data. These studies include the study by Aljebrin and Ibrahim (Citation2012) who investigated the determinants of the demand for imports for six Gulf Cooperation Council countries over the period 1994 to 2008 and applied panel Seemingly Unrelated Regression (SUR) model. According to Aljebrin and Ibrahim (Citation2012), the dependent variable was real imports and private consumption, international reserves, gross capital formation, relative price of imports to domestic price and government consumption were explanatory variables. The empirical results were that, in both the long run and short run, there was a positive relationship between the demand for imports and real income, private consumption, international reserves and gross capital formation. On the other hand, there was a negative relationship between the demand for imports and the relative price of imports to domestic price and government consumption in the long run, but no relationships in the short run.
Abidin et al. (Citation2015) used a gravity model in the investigation of the import relations between Malaysia and OIC countries. In this study, panel data within the time frame 1995 to 2012, fully modified OLS and Granger causality test were used. The study used the real exchange rate, GDP per capita, CPI, trade openness, corruption perception index for both Malaysia and the exporting country in OIC as explanatory variables. The study found out that the real exchange rate of Malaysia and other OIC countries had a positive impact on Malaysia-OIC imports whereas CPI of Malaysia and GDP per capita of other OIC countries had a negative impact on import volumes. In addition, the study found out that quality institutions enhanced Malaysia-OIC import relationship.
In a bid to investigate the determinants’ impact of dollarization on Zimbabwe’s trade flows, Makochekanwa and Chimombe (Citation2017) adopted an augmented gravity model and other variables that include GDP, geographical distance, exchange rate and dummy variable for free trade area. The study found out that GDP and exchange rate were positively related to import volumes whereas the distance between Zimbabwe and its trading partner was negatively related to import volumes. Makochekanwa and Chimombe (2015) also found out that being in the same regional trade agreement with the exporting country reduces import volumes and speaking the same language with the exporter reduces import demand.
Furthermore, Buigut (Citation2015) analysed the effect of Zimbabwe’s multicurrency arrangement on bilateral trade and in this attempt investigated if the multicurrency arrangement has affected import demand. Buigut (Citation2015) adopted a gravity model that was estimated with OLS and accounted for country pair effects and time effects in the model. In this study, bilateral trade data for the period 2004 to 2012 with 50 potential trading partners for Zimbabwe were used. The study found out that the multicurrency arrangement has reduced bilateral trade and imports, in particular.
The above review of the literature shows that most of the studies have been carried out in developing countries and that there are several factors that determine import demand, and these include, for example, GDP, relative price of imports, geographical distance and exchange rate, as well as other country-specific influences. More so, the literature review has shown that mixed results have been obtained concerning how these factors affect import demand and these results differ with the method as well as the country or region in which the study was done. Therefore, a study on the factors affecting import demand for Zimbabwe would be significant to literature as it provides specific empirical evidence.
4. Methodology
4.1. The gravity model
The gravity model has gained popularity in the recent years as a model used to explain bilateral trade flows. Following Tinbergen (Citation1962), who formulated the model using the Newton law of gravity, the traditional gravity model can be stated as:
where represents the trade flow variable, which could be exports or imports from country i to j,
and
are the respective economic masses for country i and j,
is the bilateral distance, and A is a gravitational constant. α, β and γ are assumed to be units although they can take any value (Tinbergen, Citation1962). In simple terms, EquationEquation (1)
(1)
(1) states that trade flow between two countries is directly proportional to the product of economic masses for the two countries and inversely proportional to the geographical distance between the trading partners (Tinbergen, Citation1962). By taking natural logarithm in both sides of EquationEquation (1)
(1)
(1) and adding an error term, the following stochastic log-linearized equation is obtained:
with . Several studies have successfully modified EquationEquation (2)
(2)
(2) to include contiguity, language and regional trade agreements, among other variables. However, earlier applications of the gravity model were not theoretically based. An attempt to build the theoretical foundation of the gravity model was first made by Anderson (Citation1979) and later extended by some studies that include Bergstrand (Citation1989, Citation1990), Deardorff (Citation1998), Feenstra (Citation2002), and Anderson and Van Wincoop (Citation2003, Citation2004). The theoretical gravity model as derived by this literature stresses the need to consider “multilateral resistance” which are multilateral price variables.
The contribution by Anderson and Van Wincoop (Citation2003) is the most discussed one in literature. In their contribution, Anderson and Van Wincoop (Citation2003) assumed an identical homothetic preference function that can be approximated by a constant elasticity of substitution preference function, that goods can be differentiated by place of origin and the existence of trade separability to show that the gravity model can be presented as:
where:
is the world GDP,
is a trade flow variable,
represents the trade cost factor between i and j,
is the elasticity of substitution between all goods.
and
are income shares identical to
and
, respectively, and
is country j’s consumer price index. In this framework, Anderson and Van Wincoop (Citation2003) assumed symmetric trade barriers, that is,
to show that a solution for EquationEquation (4)
(4)
(4) and (Equation5
(5)
(5) ) is
with:
With the above presentation, the gravity model becomes:
The gravity model presented in EquationEquation (7)(7)
(7) suggests that bilateral trade between countries depends on their economic masses (GDPs) and their implicit price indices. In other words, the gravity model in (7) suggests that bilateral trade, after controlling for size, depends on the bilateral trade barrier between i and j, divided by the product of their multilateral trade resistance,
and
(Anderson & Van Wincoop, Citation2003). The price indices,
and
, are termed as multilateral resistance variables because they depend on bilateral trade barriers between country i and j, i’s resistance to trade with other countries, and j’s resistance with other countries (Anderson & Van Wincoop, Citation2003). Anderson and Van Wincoop (Citation2003) modelled the unobservable trade cost factor as a function of observable variables, bilateral distance and contiguity,
as:
EquationEquation (8)(8)
(8) is substituted in EquationEquation (7)
(7)
(7) and then take natural logarithm so that the theoretical gravity model proposed by Anderson and Van Wincoop (Citation2003) is presented as:
To this end, it can be noted that the difference between the traditional gravity model presented in EquationEquation (1)(1)
(1) or (Equation2
(2)
(2) ) and the theoretical form presented in EquationEquation (9)
(9)
(9) is multilateral resistance terms. Thus, an estimation of the gravity model without considering the multilateral resistance variables results in omitted variable bias since the multilateral resistance variables are correlated with the trade cost term (Baldwin & Taglioni, Citation2007; Buigut, Citation2015).
4.2. Empirical model specification
Prior discussion on the gravity model has pointed out that it is theoretically based, it is an appropriate tool to analyse bilateral trade flows, and its empirical estimation should consider multilateral resistance. With this knowledge, together with the guidance of the empirical literature (Linnemann, Citation1966; Aljebrin & Ibrahim, Citation2012; Abidin et al., Citation2015; Aziz & Horsewood, Citation2008; Makochekanwa & Chimombe, Citation2017), an empirically estimable gravity model specified in a panel format is expressed as:
where i, j and t represent the importing country (Zimbabwe), exporting country and time, respectively. In the empirical model, and
represent gross domestic product for the importing and exporting country, respectively.
is geographical distance between country i and country j. In this study, the distance was proxied by the distance in kilometres between capitals of the importer and exporter.
and
represent the inflation level for the importing and exporting country, respectively. This study used Consumer Price Index (CPI) to measure the inflation level.
and
are the respective trade openness indexed for the importer and exporter. Trade openness index is defined as the percentage of the sum of imports and exports to GDP.
and
are the population levels for the importer and exporter, respectively.
is a dummy variable for a regional trade agreement that is equal to one if Zimbabwe and its trading partner are in the same regional trade agreement—Southern Africa Development Committee (SADC) or Common Market for Eastern and Southern Africa (COMESA),
is language which is a dummy variable equal to one if Zimbabwe and its trading partner share a common official language and zero otherwise,
is contiguity which is a dummy variable for common international border and is equal to one if Zimbabwe and its trading partner share a common border and zero otherwise, and
is a dummy variable for dollarization that is equal to one for the years 2009 to 2016 when the economy of Zimbabwe was dollarized and zero for the pre-dollarization period.
4.3. Empirical model estimation issues
In a bid to realise the aforementioned objective, this study estimates both the traditional gravity model presented in EquationEquation (2)(2)
(2) and the augmented gravity model presented in EquationEquation (10)
(10)
(10) . These models were estimated using Ordinary Least Squares (OLS) that is widely used in the estimation of such models (Hayakawa & Yamashita, Citation2011; Baier & Bergstrand, Citation2007; Aljebrin & Ibrahim, Citation2012; Abidin et al., Citation2016, Citation2015; Buigut, Citation2015; Makochekanwa & Chimombe, Citation2017). In order to consider the effect of multilateral resistance, the models were estimated with OLS with and without fixed effects for country i and j in addition to the price index variables. In this framework, the application of OLS with paired-country effects is called Least Squares Dummy Variable (LSDV) method which is another way of estimating a fixed-effects model, apart from using the within estimator.Footnote2 Accounting for multilateral resistance by using country-paired effects is in line with the studies by (Hayakawa & Yamashita, Citation2011; Baier & Bergstrand, Citation2007; Buigut, Citation2015). The application of fixed effects allows the capturing of any aggregate shocks to the countries’ trade flows in a given year (Magee, Citation2008; Buigut, Citation2015). In this sense, the study views OLS as an appropriate technique that can produce unbiased, consistent and efficient estimates as long as the homoscedasticity, orthogonality and full rank assumptions are satisfied. To this end, the pairwise correlation test was conducted to check for the serious problem of multicollinearity and robust standard errors were used to adjust the usual standard errors in case the error terms are non-spherical. Stationarity tests were carried out using the Augmented Dickey–Fuller (ADF) test, Levine-Lin-Chu (LLC) test and Im-Pesaran-Shin (IPS) test. The use of all these tests was to check for the robustness of these tests.
4.4. Data sources
This study analysed the demand for imports for Zimbabwe using a sample of 40 countriesFootnote3 from various parts of the world. These countries were selected on the basis of their share in Zimbabwe’s imports. Data for the variables used covered the period 2004 to 2016. The use of this period was dictated by the availability of data for the variables selected. All the variables, except for bilateral imports, had data that extended beyond the stated period. Consistent data for bilateral imports were available for a limited period, which was then used in the study. Data for GDP, trade openness and population were obtained from the World Bank’s World Development Indicator (WDI) database, data for CPI were obtained from the IMF and data for contiguity, language and distance were sourced from the CEPII database. Data for imports were extracted from the United Nations Commodity Trade (UNCTAD) statistics database.
5. Findings
5.1. Correlation tests
The correlation test results are presented in Table .
Table 3. Correlation test
As shown in Table , the pairwise correlation test shows that there no problem of serious multicollinearity among the explanatory variables included in the model as the absolute correlation coefficients are less than 0.8. This implies that the full rank assumption is satisfied.
5.2. Stationarity tests
Table shows the results for the stationarity test conducted using the ADF test, LLC test and IPS test. The stationarity test was conducted on time-variant variables only. The results for all the tests show that all the variables are stationary regardless of the levels of the significance of the tests’ statistics.
Table 4. Stationarity test
5.3. Main findings
The main findings are presented in Table . These findings include findings for the traditional gravity model as well as the augmented gravity model estimated with OLS and LSDV.
Table 5. Main findings
On the traditional gravity model, the results suggest that accounting for fixed effects increases the goodness of fit of the model from 28% to 79%. This feature underscores the significant role played by aspects such as multilateral resistance in explaining import demand as well as the reason that some variables (fixed effects) with significant impact are included in the model. The results for both models of the traditional gravity model also show that GDP for the exporter and the importer has a positive effect on import demand whereas distance is negatively related to import demand for Zimbabwe. The impact of the importer’s GDP on its import demand is positive because an increase in GDP increases the ability and propensity to import, hence import rises. On the other hand, a rise in GDP for the exporter reflects an increase in production capacity and economies of scale in the exporting country; hence, more goods can be exported on the basis of the comparative advantage. Regarding distance, it resembles costs involved in importing and exporting such as transport costs and time-related cost. Therefore, the larger the distance between two countries, the more the costs involved in importing that can be translated into higher prices and lead to a decline in import demand.
On the augmented gravity model, the model estimated with OLS with fixed effects (LSDV) has a higher explanatory power than the model estimated with OLS without fixed effects: explanatory power rises from 41% to 81% once fixed effects are included. This feature underscores the vital role played by aspects such as multilateral resistance in explaining import demand. It can be noted that, on average, the results for the augmented model with fixed effects show larger coefficients than for the model without fixed effects. In these two models, GDPs for the importer and exporter are positively related to import demand suggesting that import demand for Zimbabwe rises when its GDP, as well as its trading partner’s GDP, rises. More so, the distance between Zimbabwe and her trading partner is negatively related to import demand in both models. The results presented in column (3) suggest that if the distance between Zimbabwe and her trading partner was to increase by 1%, import demand would decline by 1.16% whereas imports would decline by 1.50% for the case of the results for the results presented in column (4). These findings confirm to those of the previous studies such as Modeste (Citation2011), Hibbert et al. (Citation2012), Makochekanwa and Chimombe (2015) and Ibrahim and Ahmed (Citation2017).
As shown in the table, the population for the exporter in column (4) is negatively related to import demand for Zimbabwe. In particular, an increase in population for a country exporting to Zimbabwe by 1% leads to a decline in import demand by 4.01%. The impact is negative because an increase in population in the exporting country might lead to an increase in domestic absorption that will result in a few goods available for exporting. This implies that the importing country will have to reduce its imports as the amount available for importing would have declined.
Again, the inflation level has a significant coefficient in the results obtained using LSDV only and the result implies that import demand rises with a decline in domestic prices. This result was unexpected in this study, though, it is in line with the findings obtained by Abidin et al. (Citation2015). Possibly, the relationship is negative because an increase in domestic prices erodes the purchasing power of consumers’ or importers’ income; hence, the income that is supposed to be spent on imports declines leading to a decline in import demand.
The coefficient of language is positive in both models suggesting that import demand is higher if Zimbabwe and the exporting country speak the same official language than otherwise. The OLS results suggest that import demand would be 55.25% higher if Zimbabwe and the exporting country speak a common official language than otherwise. For the case of LSDV, the impact of language is much higher than that of the pooled OLS. The finding can be explained as, with two countries speaking the same language then language ceases to be a barrier to trade and the cost of doing business will be low. As a result, import demand will be higher when the two countries speak the same language than otherwise. This finding is similar to that obtained by Buigut (Citation2015).
For the case of the dummy variable for dollarization, the coefficient is positive suggesting that import demand is high when the economy is dollarized than if it is not. In the results obtained by OLS import demand is higher when the economy is dollarized by 118.15% than when it is not. For the results estimated with LSDV, import demand is higher when the economy is dollarized by 115.98% than when it is not. This finding is similar to that obtained by Makochekanwa and Chimombe (2015).
Furthermore, the study found out that if Zimbabwe is in the same regional trade agreement with the exporter, then import demand would be higher than if they are not in the same regional trade agreement by 103.40%. This result can be explained by the point that the creation of regional trade agreements and trade blocs leads to an increase in market size and reduction in import-related barriers that increase the costs of importing.
Trade openness for the exporter in the results obtained by OLS has a positive coefficient meaning that it is positively related to import demand for Zimbabwe. Likewise, trade openness for Zimbabwe is positively related to its import demand. These results are similar to those obtained by LSDV. These findings confirm to those of the previous studies such as Abidin et al. (Citation2015).
5.4. Analysis of the determinants of imports from countries in Africa and outside Africa
For consistency checking, this study separates the sample of 40 countries used previously into countries in Africa and outside Africa and then estimate the determinants of import demand for goods from Africa and outside Africa. The results of this analysis are presented in Table .
Table 6. Determinants of imports from countries in Africa and outside Africa
As shown in Table , import demand for Zimbabwe from countries in Africa is determined by GDP for the exporting country, GDP for Zimbabwe, geographical distance, inflation level, contiguity and regional trade agreements. More so, the results obtained using OLS are similar to those obtained using LSDV except for explanatory power which is different. Including paired effects leads to an increase in explanatory power from 72% to 92% for the case of African countries and from 38% to 71% for the case of countries outside Africa.
The results presented in Table are in line with the main results presented in Table and the explanations for the results are similar. In Table , an increase in GDP for the country exporting to Zimbabwe leads to an increase in import demand for Zimbabwe. More so, an increase in GDP for Zimbabwe leads to an increase in import demand. In addition, if the distance between Zimbabwe and its trading partner had to increase, import demand for Zimbabwe would decline. The findings for the case of African countries reveal that import demand in a dollarized period is higher than import demand in a period where the economy is not dollarized by 64.87%, on the average. For the case of countries outside Africa, the findings show that import demand during the dollarization period is higher than that of the period without dollarization by 138.69% for both models with and without fixed effects, on the average. This might be so because dollarization reduces transaction costs involved in importing and exporting.
Again, the findings suggest that if Zimbabwe and the exporting country share a common international border then imports would be very high as compared to when the two countries do not share a common international border. The findings presented in Table also confirm the previous finding that import demand is high when Zimbabwe and the country exporting to it have a common regional trade agreement.
6. Conclusion and policy implications
This paper attempted to investigate the determinants of Zimbabwe’s import demand with 40 countries in and outside Africa over the period 2004 to 2016. Gravity models—traditional and Augmented—were adopted and estimated using OLS and LSDV. The findings of the study revealed that import demand for Zimbabwe is determined by its GDP, GDP of the exporting country, geographical distance, dollarization, contiguity, inflation level, trade openness, language and regional trade agreement. In particular, GDP for Zimbabwe and her trading partners is positively related to import demand whereas distance is negatively related to import demand. In addition, being in the same regional trade agreement and sharing the same international border with the trading partner increased import demand for Zimbabwe than otherwise. More so, the findings revealed that import demand was high during the dollarization period than before the dollarization period. These findings were consistent with the results obtained when the sample was disaggregated into countries in Africa and countries outside Africa.
Based on these findings, efforts to reduce import demand in Zimbabwe should be directed at implementing measures that affect price level and trade openness. More so, the findings imply that the de-dollarization strategy can effectively reduce import demand. Since the study found out that import demand is high when Zimbabwe shares an international border with her trading partner than otherwise, then the implication is that measures meant to reduce imports, such as partial and complete ban, can be put in place against neighbouring countries as compared to imports from non-neighbouring countries.
Additional information
Funding
Notes on contributors
Gerald Ngoma
Gerald Ngoma is a candidate for MSc in Economics at the University of Zimbabwe and holds a BSc Honours in Economics from the University of Zimbabwe. His research interests are development economics, international economics and monetary economics. He aspires to contribute positively to the development of financial markets, macroeconomic policy and trade mainly in less developed nations.
Notes
1. This was through the reduction of transaction costs and credible commitment to exchange rate stability (Biuguit, Citation2015).
2. It is important to note that the within estimator could not be applied since it cannot produce results for the time-invariant variables such as distance and some dummy variables involved in the augmented gravity model in Equation (10).
3. These countries include Argentina, Australia, Belgium, Botswana, Brazil, Canada, China, Denmark, Egypt, France, Germany, India, Indonesia, Israel, Italy, Japan, Kenya, Kuwait, Madagascar, Malawi, Malaysia, Mauritius, Mozambique, Namibia, Netherlands, Nigeria, Norway, Pakistan, Russia, Singapore, South Africa, Swaziland, Sweden, Switzerland, Tanzania, Thailand, United Arab Emirates, United Kingdom and United States of America and Zambia
References
- Abidin, I. S. Z., Bakar, N. A., & Haseeb, M. (2015). Exploring trade relationship between Malaysia and the OIC member countries: A panel cointegration approach (1995-2012). Asian Journal of Scientific Research, 8(1), 100–16. http://dx.doi.org/10.5539/jsd.v8n8p100
- Abidin, I. S. Z., Haseeb, M., Chiat, L. W., & Islam, M. R. (2016). Determinants of Malaysia – BRICS trade linkages: Gravity model approach. Investment Management and Financial Innovations, 13(2–2), 389–398. https://doi.org/10.21511/imfi.13(2–2).2016.14
- Aljebrin, M. A., & Ibrahim, M. A. (2012). The determinants of the demand for imports in GCC countries. International Journal of Economics and Finance, 4(3), 126–138. https://doi.org/10.5539/ijef.v4n3p126
- Anderson, J. E. (1979). A theoretical foundation for the gravity equation. The American Economic Review, 69(1),106-116. www.jstor.org/stable/1802501
- Anderson, J. E., & Van Wincoop, E. (2003). Gravity with gravitas: A solution to the border puzzle. American Economic Review, 93(1), 170–192. https://doi.org/10.1257/000282803321455214
- Anderson, J. E., & Van Wincoop, E. (2004). Trade costs. Journal of Economic Literature, 42(3), 691–751. https://doi.org/10.1257/0022051042177649
- Aziz, N., & Horsewood, N. J., 2008. Determinants of aggregate import demand of Bangladesh: Cointegration and error correction modelling. International Trade and Finance Association Papers 2008, Paper 1.
- Baier, S. L., & Bergstrand, J. H. (2007). Do free trade agreements actually increase members’ international trade? Journal of International Economics, 71(1), 72–95. https://doi.org/10.1016/j.jinteco.2006.02.005
- Bakari, S., & Mabrouki, M. (2017). Impact of exports and imports on economic growth: New evidence from Panama. Journal of Smart Economic Growth, 2(1), 67–79. https://jseg.ro/index.php/jseg/article/view/70
- Baldwin, R., & Taglioni, D. (2007). Trade effects of the Euro: A comparison of estimators. Journal of Economic Integration, 22(4), 780–818. https://doi.org/10.11130/jei.2007.22.4.780
- Bergstrand, J. H. (1989). The generalized gravity equation, monopolistic competition, and the factor-proportions theory in international trade. The Review of Economics and Statistics, 71(1), 143–153. https://doi.org/10.2307/1928061
- Bergstrand, J. H. (1990). The Heckscher-Ohlin-Samuelson model, the linder hypothesis and the determinants of bilateral intra-industry trade. The Economic Journal, 100(403), 1216–1229. https://doi.org/10.2307/2233969
- Bonga, W. G., Shenje, T. E., & Sithole, R. (2015). Export sector contribution to economic growth in Zimbabwe: A causality analysis. The International Journal of Business and Management, 3(10), 452–464. http://internationaljournalcorner.com/index.php/theijbm/article/view/138108
- Buigut, S. (2015). The effect of Zimbabwe’s multi-currency arrangement on bilateral trade: Myth versus reality. International Journal of Economics and Financial Issues, 5(3), 690–700. https://www.econjournals.com/index.php/ijefi/article/view/1255/pdf
- Chimobi, O. P., & Ogbonna, B. B. C. (2008). Estimating Aggregate Import- Demand Function In Nigeria: A Co-Integration Approach. Journal of Research in National Development, 6(1),234-256.
- Deardorff, A. (1998). Determinants of bilateral trade: Does gravity work in a neoclassical world? In Jeffrey A. F. (Ed.), The regionalization of the world economy (pp. 7–32). University of Chicago Press.
- Dutta, D., & Ahmed, N. (1999). An aggregate import demand function for Bangladesh: A cointegration approach. Applied Economics, 31(4), 465–472. https://doi.org/10.1080/000368499324174
- Egwaikhide, F. O., 1999. Determinants of imports in Nigeria: A dynamic specification. African Economic Research Consortium Research Paper 91, pp.1–33.
- Feenstra, R. C. (2002). Border effects and the gravity equation: Consistent methods for estimation. Scottish Journal of Political Economy, 49(5), 491–506. https://doi.org/10.1111/1467-9485.00244
- Harvey, A., & Sedegah, D. (2011). Import demand in Ghana: Structure. Behaviour and stability. AERC Paper, 233, 1–27. https://aercafrica.org/wp-content/uploads/2018/07/RP233.pdf
- Hayakawa, K., & Yamashita, N. (2011). The role of preferential trade agreements (PTAs) in facilitating global production networks. Journal of World Trade, 45(6), 1181–1207. http://hdl.handle.net/2344/945
- Hibbert, K., Thaver, R. L., & Hutchinson, M. C. (2012). An econometric analysis of Jamaica’s import demand function with the US and UK. The International Journal of Business and Finance Research, 6(1), 109–120. https://www.theibfr.com/download/IJBFR/2012-ijbfr/ijbr-v6n1-2012/IJBFR-V6N1-2012-9.pdf
- Ibrahim, A. A. A., & Ahmed, E. M. (2017). The determinants of aggregate demand function of Sudan. Business and Economics Journal, 8(3), 1–7. doi: 10.4172/2151-6219.1000309
- Lawrence, R. Z., & Weinstein, D. E. (2001). Trade and growth: import-led or export-led? Evidence from Japan and Korea. In Stiglitz, J. E., & S. Yusuf (Eds.), Rethinking the East Asian Miracle (pp. 379–408).
- Linnemann, H. (1966). An econometric study of international trade flows. Amsterdam: North-Holland.
- Magee, C. S. (2008). New measures of trade creation and trade diversion. Journal of International Economics, 75(2), 349–362. https://doi.org/10.1016/j.jinteco.2008.03.006
- Makochekanwa, A., & Chimombe, S. (2017). Analysis of the impact of dollarization on Zimbabwe’s international trade flows. University of Zimbabwe Publications.
- Modeste, N. C. (2011). An empirical analysis of the demand for imports in three CARICOM member countries: An application of the bounds test for cointegration. The Review of Black Political Economy, 38(1), 53–62. https://doi.org/10.1007/s12114-010-9061-3
- Muhammad, S. D., & Zafar, S. (2016). Determinants of Import Demand Functions of Pakistan: An ARDL Bound Testing Approach. International Journal of Business, Economics and Management, 3(9),113-121. https://doi.org/10.18488/journal.62/2016.3.9/62.9.113.121
- Reserve Bank of Zimbabwe. (2014). Monetary policy statement. https://www.rbz.co.zw/documents/mps/mpsjuly2014.pdf
- Saungweme, T. (2013). Trade Dynamics in Zimbabwe: 1980-2012. Internal Journal of Economic Resources, 4(5), 29–38. https://rjoas.com/issue-2013-11/article_05.pdf
- Tinbergen, J. (1962). Shaping the world economy: Suggestions for an international economic policy. Twentieth Century Fund.
- World Bank. (2019). World development indicators database. https://data.worldbank.org/
- Zimbabwe National Statistical Agency. (2018). Statistical database http://www.zimstat.co.zw/statistical-databases/