
 ?Mathematical formulae have been encoded as MathML and are displayed in this HTML version using MathJax in order to improve their display. Uncheck the box to turn MathJax off. This feature requires Javascript. Click on a formula to zoom.
Abstract
Aggregate export supply function for US corn and bilateral import functions for US corn by Mexico, Japan, China, South Korea, and the EU are estimated using ARDL estimation techniques. The findings of the study show that export price, technology, and lagged exports impact positively on US corn exports, while real effective exchange rates and ethanol production negatively impact US corn export. In addition, the current import price had a negative effect on Mexico, China, and the EU demand for US corn. However, for Japan and South Korea, it is the previous price that negatively affects corn import. More so, livestock production, NAFTA and WTO involvement positively affected corn import by all importing countries. Also, the Chinese population positively impacted corn import from the US. GDP in Mexico, Japan, South Korea, and the EU had a positive effect on corn imports, while China’s GDP impacted negatively on corn imports. More so, the US has a more price elastic supply of corn. Mexico, Japan, South Korea, and the EU have price inelastic demand for US corn, while China has price elastic demand suggesting China is very price sensitive. The results of this study have important implications for global corn trade and the US economy. The results suggest that increases in livestock production in all importing countries could lead to a significant increase in demand for U.S. corn. Also, policies that enhance NAFTA and WTO could lead to a dramatic increase in demand for U.S. corn.
Keywords:
PUBLIC INTEREST STATEMENT
The United States is the world’s largest producer and exporter of corn. However, in recent times, the country’s export share in the global corn market continues to decline due to strong competition from Brazil, Argentina, and Ukraine. Aggregate export supply function for US corn and bilateral import functions for US corn by Mexico, Japan, China, South Korea, and the EU are estimated using ARDL estimation techniques. The results indicate that export price, technology, lagged exports, real effective exchange rate, and ethanol production are the major drivers of U.S. corn export supply. The results also indicate that livestock production, GDP growth, import price, population growth, trade agreements, and lagged imports are the major factors that largely influence U.S. corn import demand by Mexico, Japan, China, South Korea and the European Union. This study suggests that increase in livestock production in all importing countries could lead to increase in demand for US corn. Also, trade policies that reduce barriers to import should be enhanced.
1. Introduction
The United States is the world’s largest producer and exporter of corn. Other major producers and exporters of corn include Brazil, Argentina, and Ukraine (USDA, Foreign Agricultural Service, Citation2018). Corn exports not only contribute to foreign exchange, job creation, and economic growth but also increases the welfare of consumers in the importing country through increased food supply. Corn grain excluding popcorn or sweet corn, on average, accounted for about 11% of all U.S. agricultural exports by value during the 1990 s. Also, between 2003 and 2007, the U.S. share of world corn exports averaged 60%, and the increase in exports was partly due to strong demand by Mexico, Russia, Japan, Europe, and developing countries.
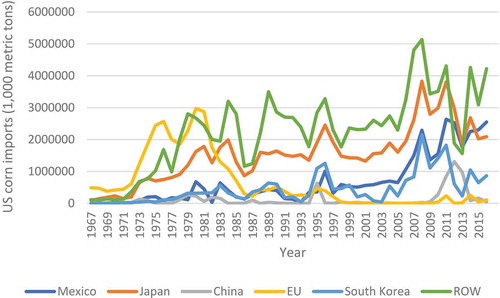
Japan, Mexico, and South Korea are the top importers of corn in the world and the top importers of US corn (U.S. Grains Council, Citation2015; see Figure ). Japan imports about 80% of its corn from the United States, while Mexico imports almost all its corn from the United States (U.S. Grains Council, Citation2015). In 2017, the United States exported nearly 2.2 USD billion worth of corn to Japan, accounting for about 24% of total U.S. corn exports to the world by value (USDA, Foreign Agricultural Service, Citation2018). More so, the study by Batres-Marquez (Citation2017) indicated that in 2017, Mexico and Japan together accounted for about 52.2% of total U.S. corn exports.
The United States’ corn exports to Mexico have increased dramatically since the implementation of the North American Free Trade Agreement (NAFTA) in January 1994 (Zahniser & Coyle, Citation2004). Increased corn trade between the United States and Mexico has been in yellow corn, used primarily as feeds and for production of starch and high-fructose corn syrup (Zahniser & Coyle, Citation2004). In addition, over the past years, about 10% of Mexicans’ corn import consisted of white corn, which is used to make tortillas and traditional Mexican foods (Zahniser & Coyle, Citation2004).
Although China was among the top six U.S. corn export destinations between the year 2011 to 2013; however, recently, the country ranks 23rd in U.S. corn export destinations despite its large population and huge market size (Jayasinghe & Lyman, Citation2017). The main reasons that have led to the decline in U.S. corn exports to China are the issue of non-tariff barriers (NTBs), the ban on genetically modified (GM) corn imports, and international competition (Batres-Marquez, Citation2017; Hansen et al., Citation2017; Jayasinghe & Lyman, Citation2017). Chinese ad hoc trade barriers have had a significant negative impact on U.S. market access (Jayasinghe & Lyman, Citation2017). In addition, China adopted a zero-tolerance trade policy on some of the U.S. GM corn varieties. As a result, unwarranted quarantine testing, delays in cargo discharge, deferrals, and cargo rejections have been common occurrences at ports in China (Jayasinghe & Lyman, Citation2017).
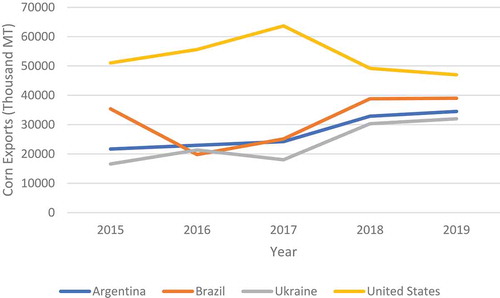
In recent times, the U.S. corn exports continue to show a declining trend despite higher global corn trade (see Figure ). Although drought in the U.S. has contributed to the loss in its corn export share, the main reason for the decline in U.S. corn exports is due to strong international competition, particularly from Ukraine, Brazil, and Argentina (Batres-Marquez, Citation2017; Jayasinghe & Lyman, Citation2017). For instance, in 2012, China and Ukraine signed a loan-for-crops bilateral policy agreement where China has promised to give credit to Ukraine in exchange for corn. In addition, China has strengthened its trade ties with the Europe and Southeast Asian countries to diversify its imports from these markets (Jayasinghe & Lyman, Citation2017).
While the US exports significant amount of corn to South Korea and the EU, exports to these countries have plunged in recent years (Batres-Marquez, Citation2017). The report by USDA, Economic Research Service (Citation2020) indicates that the US corn exports share to South Korea has dropped from 84% during the period of 2007–2011 to 46% during the period of 2015–2019. South Korea is very price-sensitive grain importer, and Brazil and Argentina have been exporting corn at relatively low prices (USDA, Economic Research Service, Citation2020). Furthermore, growing domestic feed use, adoption of biotechnology (e.g., genetic engineering and CRISPR/Cas9, etc.), ethanol production, GDP growth, livestock production, and market size among others are the major factors influencing the US corn exports and imports. Studies have shown that adoption of biotechnology such as the genetically modified organism and CRISPR/Cas9 have led to an increase in crop yield and exports of agricultural crops such as corn, wheat, barley, and soybeans (Fosu, Citation2019; Fernandez-Cornejo, Citation2009; Traore et al., Citation2000; Thomas et al., Citation2004). From the demand side, in 2013, China has rejected shipments of corn from the United States allegedly containing traces of unapproved genetic material known as MIR 162 (i.e. chemical used for combating various insects’ pests that attack corn plants; Hirtzer, Citation2014; Dillivan, Citation2014).
Demand for corn for ethanol production has increased recently. USDA 2019 projections for the 2018/2019 marketing year show that about 38.5% (5.55 billion bushels) of corn production would be used in corn ethanol production. Furthermore, in 2012, drought-related crop damage caused U.S. corn export prices to increase to nearly 128% above the 20-year historical average, causing export price to reach its highest level (Adonizio & Royales, Citation2012).
Numerous studies have examined the factors that influence the export demand of various U.S. agricultural products (Karp & McCalla, Citation1983; Saghaian, Citation2017; and Torrens, Citation1829). However, studies that specifically analyze the corn trade between the U.S. and its top trading partners such as Japan, Mexico, South Korea, China, and the EU are limited. For example, Saghaian (Citation2017) work sought to estimates the export demand function of U.S. corn and soybeans to China, Japan, the European Union, and Mexico. This study differs from Saghaian (Citation2017) because in addition to Japan, Mexico, China, and the EU markets, South Korea which is the third major importer of US corn after Japan and Mexico is included in the analysis. The objectives of this paper are two-fold. The first objective is to estimate aggregate export supply function for U.S. corn and secondly, to estimate bilateral import function for U.S. corn by Mexico, Japan, China, South Korea, and the EU. The paper contributes to the empirical literature because it is the first empirical study to estimate aggregate export supply function for US corn and bilateral import demand functions for US corn by Mexico, Japan, China, South Korea, and the EU using the ARDL estimation. In addition, given the continuous decline in US corn export in the global corn market in recent times, our empirical models could help policy makers especially those who focus on international grain trade to make informed decisions. The rest of the article is divided as follows: section 2 presents the literature review, section 3 presents the methodology, section 4 presents the results and discussion, while section 5 presents conclusions drawn from the study.
Figure 1. Scatter Plot of U.S. corn exports to its trading partners (1000 metric tons), (1967–2016).
Figure 2. Trends in Corn Export by US, Brazil, Ukraine, and Argentina (1000 MT).
2. Literature review
Previous research has examined the factors that influence export demand of various U.S. agricultural products. However, studies that specifically analyze the corn trade between the U.S. and its top trading partners are limited. This paper contributes to literature by estimating the model for U.S. corn export and import demand.
Using a log-linear and panel data analysis, Saghaian (Citation2017) empirically estimates the export demand function of U.S. corn and soybeans to the top four export destinations: China, Japan, the European Union, and Mexico. They estimated own price, cross price, income, and exchange rate elasticities. Based on the Hausman test, their study chose a random effects estimation over the fixed effects estimation. The findings from their study show that U.S. corn demand is elastic to own price, cross price, income, and poultry inventory, while inelastic to real exchange rate and pig inventory. The positive cross price elasticity reveals that corn and soybeans are substitutes in these countries. Conversely elasticity analysis for the U.S. soybean demand reveals elastic cross price, real exchange rate, pig and poultry inventory effects, as well as inelastic own price and income effects.
More so, employing the gravity model, Jayasinghe et al. (2010) estimated export demand function for 48 countries to investigate the determinants of world demand for U.S. corn seeds and the cost of export trade to these destinations. The study concluded that all trade costs matter, mostly tariffs, and have a negative impact on U.S. corn seed exports.
In a similar study, Babula et al. (Citation1995) analyzed the role of exchange rates on U.S. corn exports. The study applied time series econometric methods to monthly observational data over the period of 1978–1992 on real exchange rates, real corn prices, corn exports sales, and corn shipments for the United States. The study found no evidence of cointegration between exchange rates, price, sales, and shipments.
Using a dynamic framework, Haniotis et al. (Citation1988) analyzed the demand and supply of U.S. agricultural exports, focusing on wheat, corn, and soybeans. Their results indicated differences in the export behavior of each product. The study found that U.S. corn exports are elastic, while soybean exports are inelastic. However, for wheat, the derived elasticity of export demand had a positive sign.
3. Methodology
3.1. Theoretical framework
To examine how prices and other factors such as population, GDP growth, and trade policies, etc., affect corn trade, this study adopts the price expectations model developed by Nerlove (Citation1958). The model assumes that the desired level of X is dependent on the expected level of P. Based on this theory, I model the corn exports function as follows;
where is the desired export of corn in period t,
is the expected exporting price of corn,
indicates other exogenous factors,
is the error term (
are the parameters to be estimated. Dynamic adjustment is introduced through the assumption that the country’s exports of corn cannot change immediately in response to new economic conditions to reach levels planned for the same period. The actual change in exports in season t is only a fraction
of the planned change in export.
The coefficient of adjustment ( measures the speed with which actual exports adjusts in response to factors influencing planned exports. Combining EquationEquations (1)
(1)
(1) and (Equation2
(2)
(2) ) give EquationEquation (3)
(3)
(3) .
Also, it is assumed that price expectations are adaptive and based on the actual and expected price. Following the work of Sadoulet and De Janvry (Citation1995) and Muth (Citation1960), price expectation can be expressed below;
Rearranging EquationEquation (4)(4)
(4) gives EquationEquation (5)
(5)
(5) :
where is the current export price of corn,
is the lagged export price of corn,
is the adaptive expectation coefficient,
is the error term. Also,
and
are assumed to be unobserved and therefore can be eliminated from the model. Substituting EquationEquation (5)
(5)
(5) into EquationEquation (3)
(3)
(3) and rearranging gives EquationEquation (6)
(6)
(6) :
Following Lamb and Diebold (Citation1996) the reduced-form EquationEquation (7)(7)
(7) relating export and price is obtained by specifying corn export (
in EquationEquation (6)
(6)
(6) in terms of the observable variables in the system, yielding
where ,
,
), Zt capture other exogenous factors that influence corn exports.
3.2. The conceptual model
The conceptual framework adopted for this study is shown by EquationEquation (8)(8)
(8) . EquationEquation (8)
(8)
(8) assumes that export supply of corn from U.S. is equal to import demand by Mexico, Japan, China, South Korea, the EU, and the rest of the world (ROW).
where represents the desired corn export from the US,
indicate the desired import demand of corn by Mexico, Japan, China, South Korea, the EU, and the ROW, respectively. This study focuses on only the major US corn importers such as Mexico, Japan, China, South Korea, and the EU because these countries alone import about 68.13% of the total US corn exports (USDA, FAS, Citation2018). For example, Japan imports of US corn alone are almost the same as the rest of the world (ROW) imports (see Figure ). Although China is not a major importer of US corn in recent times, China was included in this study due to its influence in global trade and also due to the fact that China is among the largest export market of US agricultural products such as soybeans, feed, animal hides, and alfalfa among others.
3.3. Econometric model and data description
Based on the theoretical model developed in EquationEquation (7)(7)
(7) , the desired export supply EquationEquation (9)
(9)
(9) and the desired import demand EquationEquations (10)
(10)
(10) –(Equation14
(14)
(14) ) are specified below:
where indicates export price measured as the ratio of export value to export volume multiplied by 1000 USD ($/Bushel*1000), TECH is technology measured by time trend,
indicates the real effective exchange rate (2010 = 100),
is proportion of corn used for ethanol production (million barrels per day) to capture for domestic consumption of U.S. corn, MP is real import price or boarder price of corn measured by Pesos/Bushel for Mexico,
/Bushel for Japan, Yuan/Bushel for China, KRW/Bushel for South Korea, and EUR/Bushel for the EU. In addition,
indicates lagged corn export and lagged corn import demand to measure how previous exports and imports affect current value (i.e. to capture for feedback).
indicate pig production (million head) to capture for feed demand in Mexico, Japan, and China. Due to difficulty in getting enough data on pig production for the EU and South Korea, the study used cattle production (CAQ) and chicken production (CHQ) (in million head) to proxy for feed demand for the EU and South Korea, respectively. Furthermore,
is a dummy variable (i.e. 0 = the period before NAFTA involvement and 1 = after NAFTA involvement) to capture for trade policy between U.S. and Mexico.
is a dummy variable (i.e. the period before WTO accession = 0, and after WTO accession = 1) to capture the effect of trade policy between Japan, China, South Korea and the United States. GDP is gross domestic product per capita (current US$) to measure income,
is population growth (annual %) to proxy for market size,
is time, ln is natural logarithms,
are the intercept parameters,
,
,
,
are the unknown parameters to be estimated.
,
are the error terms. Annual time series data covering the period of 1967 to 2016 are employed. Data on corn export and corn import were gleaned from United State Department of Agriculture (USDA) (FAS). Also, pork production, chicken production and cattle production were obtained from Food and Agriculture Service (FAO), GDP, Real effective exchange rate and population growth data were sourced from World Bank, ethanol production was sourced from Energy Information Administration (EIA). Based on literature review, a prior expectation of the variables is as follows;
,
,
,
,
,
.
Since the structural EquationEquations (9(9)
(9) –Equation14
(14)
(14) ) do not fully incorporate all the variables that influence the corn market. That is, the error term in both the export equation and import equations capture other factors that influence the export supply equation and import demand equations. This means that if the structural equations are estimated with the OLS, a biased and inconsistent estimate will be obtained due to issue of serial correlation and endogeneity problem. To avoid these problems, this study employs the auto-regressive distributed lag model (ARDL) estimation developed by Pesaran et al. (Citation2001). The ARDL model essentially specifies a time series as a function of its lagged values, current, and lagged values of one or more of the regressors. The ARDL approach has several advantages over the OLS and other estimation techniques such as Engle and Granger (Citation1987), Gregory and Hansen (Citation1996), and Saikkonen and Lütkepohl (Citation2000). Previous studies have indicated that endogeneity is less of a problem in ARDL technique because appropriate lags in ARDL remove the problem that is linked to serial correlation and endogeneity (Baharumshah et al., Citation2009; Jalil & Mahmud, Citation2009; Nkoro & Uko, Citation2016). The Vector Autoregressive model (VAR) ensures that all variables should be I(1), however, the ARDL bound testing approach to cointegration can be carried out irrespective of whether the explanatory variables are I(0) or I(1). This study used Microfit Version (5.0) and EViews 10 SV software package for the estimation.
4. Results and discussion
The first objective of this study is to examine the factors that influence U.S. corn export in the long run and short run, and secondly to examine the factors that influence Mexico, Japan, China, South Korea, and the EU to demand U.S. corn in the long run and short run using the ARDL estimation. These results are presented and discussed below.
4.1. Summary statistics
Table presents the summary statistics of the variables used for the analysis. Total U.S. corn exported within the study period averaged 5,058 million metric tons. Japan recorded the highest import value averaging 1,544 million metric tons, followed by the Mexico with an average import of about 679 thousand metric tons, the EU corn imported averaged 653 thousand metric tons, South Korea recorded an import of about 450 thousand metric tons and then China with an average total import equal to 117 million dollars. Also, average ethanol production is about 1,222 million barrels per day. Japan recorded the highest GDP growth per capita around 7.42%, followed by South Korea 6.238%, China 2.55%, the EU 2.1%, and then Mexico 1.53%. China recorded the highest pork production, with the average around 361 million heads, followed by Mexico with average production around 15.2 million heads, and then Japan, which produces about 9.4 million heads. Average chicken production in South Korea within the study period is about 77 thousand head. In addition, cattle production in the EU averaged 97 million heads. Average population growth in China is around 1.25%, with a minimum growth of 0.48% and the maximum growth around 2.76%.
Table 1. Summary Statistics
4.2. Unit roots test
Tables and present the results of unit roots tests on the variables used for the analysis. The rationale for performing this test is to examine the stationarity properties of the series. For the U.S. model, when the test was carried out with only intercept, it was oberved that only corn export and export price were stationary at levels, all the other variables were not stationary at levels. However, when the test was performed with both intercept and trend, only corn exports and technology were stationary at levels.
Table 2. Unit Roots test (Intercept Only)
Table 3. Unit Roots test (Intercept and Trend)
For Mexico, when the unit root test was conducted with only intercept, it was observed that corn imports, GDP, and pork production are stationary at levels, while import price is nonstationary but when the test was conducted with both intercept and trend, only corn imports and GDP were stationary at levels. More so, for Japan, it can be observed that all variables are stationary in levels when the test was conducted with only intercept however, when the test was carried out with both trend and intercept, only import price and GDP became stationary at levels. Furthermore, for China, when the test was carried out with only intercept all variables are stationary at level except corn import. Also, when the test was conducted with both intercept and trend only corn import and population growth are stationary at level.
In addition for South Korea, it was observed that corn imports and GDP per capita growth are stationary at levels while import price and chicken production are nonstationary but when the test was conducted with both intercept and trend, only corn import was stationary at levels. For the EU market, variables import price and GDP per capita are stationary while corn import and cattle production are nonstationary when the test was conducted with intercept only, however when the test was conducted with both trend and intercept, only corn import and import price are stationary at levels. All variables that are stationary have their order of integration set to I(0), while nonstationary variables have their order of integration set to I(1). More so, unit root tests were not performed on the regional cooperation dummys such as WTO and NAFTA because dummy variables by nature are nonstationary. In addition, the study plot all variables in levels to check for stationarity (see Figures and ). The choice of the ARDL estimation is appropriate for this study, because it allows for both I(0) and I(1) variables to be used for the estimation.
Figure 3. Plot of Variables in Levels (1967–2016).
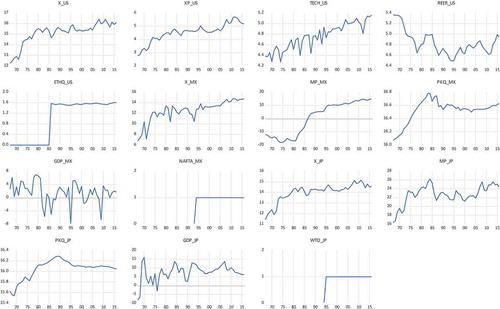
Figure 4. Plot of Variables in Levels (1967–2016).
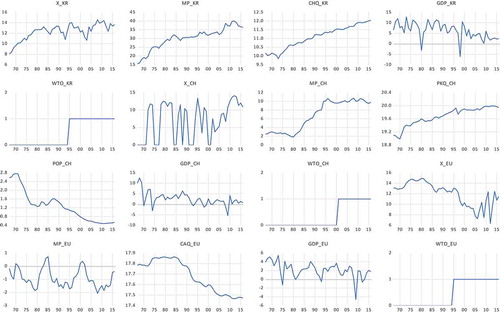
Figure 5. Trends in US Corn Exports to Major Importers (1000 metric tons).
4.3. Test for long run relationship
The Wald and F-Statistic test of cointegration indicate the presence of a long run relationship among the variables. This is shown in Table . Since the test statistic lies above the upper bound, the null hypothesis of no level effect is rejected (Table ).
Table 4. Test of Long Run relationship
4.4. The results of export supply
4.4.1. Long run estimates
Table presents the results of the long run estimates for U.S. corn exports. The results show a positive and significant constant term in the long run. This coefficient of the constant term means that U.S. corn export increases by about 4.25% due to the influence of all the other factors not captured in the model. Also, the results indicate a positive and significant relationship between current export price and corn export in the long run. That is, 1% increase in current export price leads to about 1.23% increase in U.S. corn exports. The results suggest that U.S. corn export has elastic supply.
Table 5. US Corn Export Model: ARDL (Long-Run) Estimates
Furthermore, the study found a positive and significant long run relationship between technology and corn exports. It can be observed that 1% increase in technology in the current year leads to about 0.772% in U.S. corn exports. This result suggests that advancement in technology is favorable to corn export because it leads to increase in efficiency and hence increase in corn production. More so, the study found a negative and significant relationship between real effective exchange rates and corn exports in the current year. It can be observed that 1% increase in real effective exchange rate results in about 0.878% increase in U.S. corn exports in the long run. This result suggests that a depreciation of the U.S. dollar against its trading partners leads to increase in corn exports.
In addition, coefficient of ethanol production is positive and significant, which means increased domestic consumption of corn decreases corn export. That is, every percent increase in ethanol production decreases corn exports by about 0.154% in the long run.
4.5. The short run estimates
Table presents the short run results obtained from U.S. corn exports model. Similarly, to the long run estimates, export price and technology impacted positively and significantly on U.S. corn exports in the short run analysis. In addition, real effective exchange rate and ethanol production found a negative and significant effect on corn exports. The error correction term is negative and statistically significant meaning that the variables are cointegrated and have a long run relationship. That is, the speed of adjustment value −0.649 indicates that it takes about 64.9% of the model to correct any external shock in the long run.
Table 6. US Corn Export: Error Correction Model (Short-Run)
4.6. Results of import demand equations
4.6.1. The long run estimates
This section presents the results of corn import demand by Mexico, Japan, China, South Korea, and the EU. These results are shown in Table . The DW-statistic from the ARDL is close to 2, suggesting that the ARDL model is free from serial correlation.
Table 7. Corn Import Model: ARDL Estimates
The ARDL results reveal a negative and significant relationship between current price of corn and corn import by Mexico, China, and the EU however, for Japan and South Korea, it is the previous price that negatively impact corn import. For Mexico, it was observed that 1% increase in real import price leads to a about 0.289 reduction in corn import. For the Japanese and South Korean market, the study found that a one percent increase in current price leads to about 0.191% and 0.286% increase in corn import, respectively, however, a one percent increase in lagged price of corn leads to about 0.109% and 0.203% decrease in corn imports in Japan and South Korea, respectively. The results suggest that the full effect of price on corn imports is not felt in the current year, but in the previous year. For China and the EU, it can be observed that 1% increase in current price of corn results in about 1.303% and 0.418% decrease in corn import demand. The results suggest that Mexico, Japan, South Korea, and the EU have inelastic demand for U.S. corn, while China has elastic demand for U.S. corn. The results also suggest that changes in price will have a little impact on Mexican, Japanese, South Korean, and the EU demand for U.S. corn but will have a significant effect on Chinese demand.
In addition, the results show a positive and significant relationship between pork production and corn import demand in Mexico, Japan, and China. Empirically, it was observed that 1% increase in pork production leads to about 4.837% increase in corn import by Mexico, about 1.480% increase in corn demand by Japan, and about 35.357% increase in corn demand by China. The huge coefficient of pork production for China is expected because the country is the World’s largest producer and consumer of pork. Also, the results indicate a positive and significant relationship between cattle production demand for US corn. Similarly, the study finds a positive and statistically significant relationship between Chicken production in South Korea and her demand for corn from the US. Empirically, it was observed that 1% increase in Cattle production in the EU leads to about 8.979% increase in corn import. More so, the study finds that 1% increase in chicken production in South Korea leads to about 3.236% increase in corn import from the US in the current year; however, 1% increase in chicken production in the previous year leads to about 2.845% decrease in corn import demand by South Korea. The results suggest that livestock production promotes corn import.
Furthermore, the study finds a positive and insignificant effect of GDP per capita on corn imports for Mexico, Japan, and South Korea, while the effect of GDP on corn imports was negative and insignificant for China. For the EU market, the study finds a positive and 5% significant effect of GDP on corn import. That is, it was observed that 1% increase in GDP leads to about 0.216% increase in corn import in the EU. The results suggest that Mexico, Japan, South Korea, and the EU see US corn as a normal good while China sees it as an inferior good.
In addition, the results revealed a positive and significant relationship between NAFTA and WTO involvement and corn imports. It can be observed that Mexican corn imports increased by about 1.432% after joining NAFTA. Similarly, Japanese, Chinese, South Korean, and the EU corn imports from the U.S. have increased by about 0.343%, 4.281%, 1.094%, and 0.108%, respectively, after joining WTO. The results show a 1% statistically significant level for Mexico and Japan, and 5% statistically significant level for China but insignificant for South Korea and the EU. The results suggest that trade policies that reduce barriers to import of U.S. corn should be enhanced. Also, South Korean previous involvement in WTO had a negative and significant effect on corn import from the U.S.
More so, the study finds a positive and significant relationship between population growth and corn import demand in China in the long run. The results show that increase in population growth leads to about 8.780% increase in corn import demand by China, suggesting that market size plays an integral role in corn trade between the U.S. and China. The results also show a positive and 1% percent significant effect of lagged import and current corn import.
4.6.2. The short run estimates
The short run results did not differ significantly from the long run results in terms of the signs of the coefficients. These results are presented in Table . Similarly, the short run results revealed a negative and significant effect of current corn price and corn import for Mexico. For Japan and South Korea, the results revealed a positive and significant relationship between import price and corn import. It was observed that 1% increase in current corn price leads to about −0.289% decrease in corn imports by Mexico and China, respectively, but about 0.191% and 0.273% increase in corn import by Japan and South Korea, respectively, in the short run. The effect of corn price on corn imports is 1% significant for China, Japan and South Korea. The positive relationship between corn price and corn imports for Japan and South Korea is unexpected. Possible reason for this result might be because Japan and South Korea see U.S. corn as a giffen good in the short run. In addition, the study revealed a positive and insignificant relationship between GDP and corn import for Mexico and Japan, however, this relationship is 5% significant for EU. WTO involvement shows a positive and significant effects on South Korean demand for U.S. corn in the short run. The study finds that WTO involvement increases South Korean corn import by about 1.055% in the short run. The error correction term also known as the speed of adjustment is negative and statistically significant for all importing countries suggesting that there is a long run causality running from all the explanatory variables to the dependent variable. The speed of adjustment also indicates much of the previous year’s shock converge back to the long-run equilibrium in the current year. That is, the speed of adjustment values of −0.627, −0.582, −0.700, −0.557, and −0.644 indicates that it takes about 62.7%, 58.2%, 70.0%, 55.75%, and 0.644% for Mexico, Japan, China, South Korea and the EU, respectively, to correct any deviation from the long run equilibrium. It can also be observed that China has the fastest rate of adjustment followed by the EU, Mexico, South Korea and then Japan. The overall significance of the model is statistically significant at 1% level. Also, the diagnostic test in Table indicates that the model in Table is robust and therefore can be used for policy. That is the null hypothesis of no serial correlation and homoskedasticity cannot be rejected based on the diagnostic test presented in Table . Also, the Ramsey RESET test indicates that the model is well specified.
Table 8. Error Correction Model (Short-Run) Estimates
Table 9. Results of Diagnostic tests
5. Conclusions
The study sought to estimate aggregate export supply function for US corn and bilateral import functions for US corn by Mexico, Japan, China, South Korea, and the EU using the ARDL technique. The study finds that export price, technology, and lagged export positively influenced U.S. corn exports, while real effective exchange rates and ethanol production negatively impacted U.S. corn exports both in the long run and short run. It was also observed that the U.S. has a more price elastic supply of corn. In addition, current import price negatively affected corn imports by Mexico, China, and the EU, however, for Japan and South Korea, it is the previous price that negatively affected corn imports only in the long run. The results indicate that Mexico, Japan, South Korea, and the EU have price inelastic demand for U.S. corn, while China has price elastic demand. In addition, the results revealed a positive effect of current GDP on corn imports for all importing countries except China.
More so, the study finds a positive and significant relationship between population growth and Chinese demand for US corn. More so, the study finds evidence of a positive and statistically significant relationship between pork production and demand for US corn in Mexico, Japan, and China. Also, Chicken production and cattle production had a positive and statistically significant effect on corn import in South Korea and the EU, respectively. Furthermore, NAFTA involvement impacted positively and significantly on Mexican demand for US corn. Also, WTO involvement had a positive and statistically significant impact on Japanese and Chinese demand for US corn. For South Korea and the EU, WTO involvement showed a positive and insignificant effect in determining their demand for US corn in the current year. In the previous year, WTO involvement by South Korea revealed a negative and significant effect on US corn import. The results of the study have several implications both for the US and the global economy. Policy makers and economists could use the results to form the basis to design future policies to stimulate export and import of corn in both domestic and international markets. Also, understanding of price elasticity of corn will enable policy makers to implement the appropriate tax policy to raise revenue.
Based on these findings, the study makes some suggestions to help increase US corn exports to its trading partners. It was observed that Mexico, Japan, South Korea, and the EU have price inelastic demand for U.S. corn while China have price elastic demand for U.S. corn. This suggests that China is very price sensitive. Since China is price sensitive, the US exporters can sell corn to China at a relatively low price in order to increase its market share not only in the Chinese markets but also in the international markets. Furthermore, the US can take advantage of the growing livestock industry in Mexico, Japan, China, and the EU, and the growing poultry industry in South Korea, by exporting affordable and quality corn to these countries.
In addition, trade policies that reduce barriers to import of U.S. corn by Mexico, Japan, China, South Korea, and the EU could have a beneficial effect on U.S. corn producers. Specifically, policies that enhance NAFTA and WTO involvement could lead to a dramatic increase in Mexican, Japanese, Chinese, South Korean, and the EU demand for U.S. corn. For example, the US can probably consider giving export-tax subsidies to these countries so as to increase their demand. In addition, the US can cut down tariffs to decrease import price and make the processes and transactions relating to imports by these countries easier. More so, trade war between the US and China could be eliminated to enable the US to take the maximum advantage of Chinese huge population (i.e. market size) and the growing pork industry. Lastly, increased adoption of technology will likely lead to increase in U.S. corn export. The current study is not free from limitations. The study focused on only the major importers of U.S. corn such as Mexico, Japan, South Korea, China, and the EU which account for about 63% of total US corn exports to the world. Other developing and emerging countries such as Vietnam, Egypt, Iran, Colombia, Taiwan, Malaysia, and Algeria among others also import significant amount of corn from the US; however, this paper did not include these countries. The study admits this as a limitation and hence recommend future research to include all other importers of US corn. The current study employed ARDL estimation in estimating the bilateral import function for US trading partners. Future research can also employ other estimation technique such as panel estimation.
Cover Image
Source: Author.
Additional information
Funding
Notes on contributors
Prince Fosu
Prince Fosu holds B.A. Economics and MPhil. Economics both from the University of Cape Coast, Ghana and MS Agribusiness and Applied Economics from North Dakota State University, USA. Currently, Prince is a PhD Economics candidate at the School of Analytics, Finance, and Economics, Southern Illinois University Carbondale where he is also working as a Graduate Teaching Assistant. His research and teaching interests focus on macroeconomics, international trade, econometrics, microeconomics, and applied economics.
Thomas I. Wahl
Thomas I. Wahl is a Professor in the Department of Agribusiness and Applied Economics at North Dakota State University. His research interests focus on trade policy, consumer’s attitudes and preferences, international marketing and trade, and food demand analysis. He holds a B.S and PhD in Agribusiness and Agricultural Economics, respectively from Iowa State University. Before joining North Dakota State University (NDSU), he was a Professor and Director of the International Marketing Program for Agricultural Commodities and Trade (IMPACT) Center at Washington State University.
References
- Adonizio, W., & Royales, S. (2012). Impact of the drought on corn exports: Paying the price. Beyond the numbers (Vol. 1, No. 17). Bureau of Labor Statistics.
- Babula, R. A., Ruppel, F. J., & Bessler, D. A. (1995). US corn exports: the role of the exchange rate. Agricultural Economics: The Journal of the International Association of Agricultural Economists, 13 (968-2016-75536), 75-21. Retrieved from https://ageconsearch.umn.edu/record/173708.
- Baharumshah, A. Z., Mohd, S. H., & Masih, A. M. M. (2009). The stability of money demand in China: Evidence from the ARDL model. Economic Systems, 33(3), 231–244. https://doi.org/10.1016/j.ecosys.2009.06.001
- Batres-Marquez, S. P. (2017). Top markets for US agricultural goods. Decision Innovation Solutions. Retrieved June 12, 2019, from http://www.decision-innovation.com/blog/disinsights/top-markets-for-us-agricultural-goods/on
- Dillivan, K. (2014). U.S. Corn and DDGS exports. Retrieved June 9, 2019, from https://www.farms.com/commentaries/u-s-corn-and-ddgs-exports-82777.aspx
- Engle, R. F., & Granger, C. W. (1987). Co-integration and error correction: Representation, estimation, and testing. Econometrica: Journal of the Econometric Society, 55(2), 251–276. https://doi.org/10.2307/1913236
- Fernandez-Cornejo, J. (2009). First decade of genetically engineered crops in the United States. DIANE Publishing.
- Fosu, P. (2019). Trade in CRISPR/Gene-edited wheat: A partial equilibrium analysis (Order No. 13904918) [Available from ProQuest Dissertations & Theses A&I; ProQuest Dissertations & Theses Global]. (2302688409). https://search.proquest.com/docview/2302688409?accountid=13864
- Gregory, A. W., & Hansen, B. E. (1996). Practitioners corner: Tests for cointegration in models with regime and trend shifts. Oxford Bulletin of Economics and Statistics, 58(3), 555–560. https://doi.org/10.1111/j.1468-0084.1996.mp58003008.x
- Haniotis, T., Baffes, J., & Ames, G. C. (1988). The demand and supply of US agricultural exports: The case of wheat, corn, and soybeans. Journal of Agricultural and Applied Economics, 20(2), 45–56. https://doi.org/10.1017/S0081305200017581
- Hansen, J., Marchant, M. A., Tuan, F., & Somwaru, A. (2017). US agricultural exports to China increased rapidly making China the number one market. Choices, 32(2), 1–6. https://www.choicesmagazine.org/choices-magazine/theme-articles/us-commodity-markets-respond-to-changes-in-chinas-ag-policies/us-agricultural-exports-to-china-increased-rapidly-making-china-the-number-one-market
- Hirtzer, M. (2014). China rejections of U.S. corn top 1 million tonnes after latest data. Reuters. Retrieved June 10, 2019, from https://www.reuters.com/article/china-corn-usda/china-rejections-of-u-s-corn-top-1-million-tonnes-after-latest-data-idUSL1N0MV16920140403
- Jalil, A., & Mahmud, S. F. (2009). Environment Kuznets curve for CO2 emissions: A cointegration analysis for China. Energy Policy, 37(12), 5167–5172. https://doi.org/10.1016/j.enpol.2009.07.044
- Jayasinghe, S., & Lyman, P. (2017). U.S. Corn exports to China: Significant impact from New Chinese Ag and trade policies. Retrieved June 9, 2019, from https://www.agmrc.org/renewable-energy/renewable-energy-climate-change-report/renewable-energy-climate-change-report/july-2017-report/us-corn-exports-to-china-significant-impact-from-new-chinese-ag-and-trade-policies
- Karp, L. S., & McCalla, A. F. (1983). Dynamic games and international trade: An application to the world corn market. American Journal of Agricultural Economics, 65(4), 641–650. https://doi.org/10.2307/1240451
- Lamb, R. L., & Diebold, F. X. (1996). Why are estimates of agricultural supply response so variable? (No. 96-8). Board of Governors of the Federal Reserve System (US).
- Muth, J. F. (1960). Optimal properties of exponentially weighted forecasts. Journal of the American Statistical Association, 55(290), 299–306. https://doi.org/10.1080/01621459.1960.10482064
- Nerlove, M. (1958). The dynamics of supply; estimation of farmer’s response to price (No. 04; HD1447, N4).
- Nkoro, E., & Uko, A. K. (2016). Autoregressive Distributed Lag (ARDL) cointegration technique: Application and interpretation. Journal of Statistical and Econometric Methods, 5(4), 63–91. http://www.scienpress.com/Upload/JSEM%2fVol%205_4_3.pdf
- Pesaran, M. H., Shin, Y., & Smith, R. J. (2001). Bounds testing approaches to the analysis of level relationships. Journal of Applied Econometrics, 16(3), 289–326. https://doi.org/10.1002/jae.616
- Sadoulet, E., & De Janvry, A. (1995). Quantitative development policy analysis (Vol. 5). Johns Hopkins University Press.
- Saghaian, S. Y. (2017). Export demand estimation for U.S. Corn and soybeans to major destinations [Theses and Dissertations-Agricultural Economics]. 53. https://uknowledge.uky.edu/agecon_etds/53
- Saikkonen, P., & Lütkepohl, H. (2000). Testing for the cointegrating rank of a VAR process with an intercept. Econometric Theory, 16(3), 373–406. https://doi.org/10.1017/S0266466600163042
- Thomas, W. E., Burke, I. C., & Wilcut, J. W. (2004). Weed management in glyphosate-resistant corn with glyphosate, halosulfuron, and mesotrione. Weed Technology, 18(3), 826–834. https://doi.org/10.1614/WT-03-221R
- Torrens, R. (1829). An essay on the external corn trade. Longman, Rees, Orme, Brown, and Green.
- Traore, S. B., Carlson, R. E., Pilcher, C. D., & Rice, M. E. (2000). Bt and non-Bt maize growth and development as affected by temperature and drought stress. Agronomy Journal, 92(5), 1027–1035. https://doi.org/10.2134/agronj2000.9251027x
- U.S. Grains Council. (2015). Production and exports. https://grains.org/buying-selling/corn/
- USDA, Economic Research Service. (2020). United States losing dominance in the South Korean corn import market. U.S. Department of Agriculture, Economic Research Service. Retrieved April 23, 2020, from https://www.ers.usda.gov/data-products/charts-of-note/charts-of-note/?page=1&topicId=14847
- USDA, Foreign Agricultural Service. (2018). Export sales. U.S. Department of Agriculture, Foreign Agriculture Service. Retrieved December 5, 2018, from https://apps.fas.usda.gov/esrquery/esrq.aspx
- USDA, Foreign Agricultural Service. (2020). Coarse grains. Retrieved April 24, 2020, from https://apps.fas.usda.gov/psdonline/circulars/grain-corn-coarsegrains.pdf
- Zahniser, S., & Coyle, W. T. (2004). US-Mexico corn trade during the NAFTA era: New twists to an old story. US Department of Agriculture, Economic Research Service.