
 ?Mathematical formulae have been encoded as MathML and are displayed in this HTML version using MathJax in order to improve their display. Uncheck the box to turn MathJax off. This feature requires Javascript. Click on a formula to zoom.
Abstract
Research relating to the influence of investor’s demographic factors and personality traits on financial risk tolerance receives increasing attention. Financial risk tolerance refers to the degree of uncertainty an investor is willing to bear, with regards to the financial risks taken on. The investor’s personality refers to the stable characteristics an individual tends to display in any given situation. Personality traits may therefore also be considered as a driver in investor financial decisions. Understanding the influence gender and personality traits have on an investor’s financial risk tolerance, will assist in predicting their financial and investment decisions with regards to their asset portfolios. The purpose of this article is to develop a structural equation model for investment firms to more accurately profile their female investors, considering their personality traits, level of risk tolerance and level of education. Results from this study are in line with previous investment and portfolio management research. Results indicate that male investors are more risk-tolerant than their female counterparts. Furthermore, investors’ level of education significantly influenced their level of financial risk tolerance. Personality traits were found to influence female investors financial risk tolerance.
PUBLIC INTEREST STATEMENT
In general, female investors are underrepresented in comparison with their male counterparts. It is widely accepted that male investors are more risk-tolerant, based on a variety of factors. As such, this study aimed to determine female investors’ level of risk tolerance by considering their personality traits and level of education. Understanding the influence gender and personality traits have on an investor’s financial risk tolerance, will assist in predicting their financial and investment decisions with regards to their asset portfolios. When these investors engage in investment behaviour, it is the responsibility of the investment firm to profile their clientele in terms of their risk profile. As such, investment firms will be able to more accurately profile their female investors by making use of the model developed in this study. In the event thereof, investment firms can tailor products to suit the specific needs of their female clientele.
1. Introduction
Understanding individual investment behaviour is a key factor in the financial market (Pereira da Silva, Citation2012). Financial markets encompass various risks in terms of investments as well as individual investment decisions. The most prevalent risk encountered in financial markets is financial risk (Robb & Woodyard, Citation2011). Dohmen et al. (Citation2005) contend that risk includes a certain amount of uncertainty, as well as being the main driver in the financial decision-making process of an investor. Investors display inconsistent financial risk-taking behaviour across gender (Borden et al., Citation2008). It is widely recognised that female investors are less prone to participate in risk-taking behaviours than their male counterparts (Bajtelsmit & Bernasek, Citation1996; Booth & Nolen, Citation2012; Cárdenas et al., Citation2012; Gustafson, Citation1998; Jianakoplos & Bernasek, Citation1998). A key argument in various research studies relates to the statement that males and females perceive risk-taking different from one another (Dohmen et al., Citation2005; Gustafson, Citation1998; Harris et al., Citation2006; Watson & McNaughton, Citation2007).
An individual’s inclination to take part in risk-related behaviour stems from his/her ability to make financial decisions as well as his/her understanding of financial knowledge (Hallahan et al., Citation2003; Lusardi, Citation2008). Risk-taking behaviour is described as the action of an individual taking part in an activity where the result could be either positive or negative (Boyer, Citation2006). One of the major contributors to understanding an individual’s risk-taking behaviour is his/her level of financial risk tolerance, which is impacted by economic factors and policies (Robb & Woodyard, Citation2011). However, the individual is still in charge of making his/her financial decisions (Robb & Woodyard, Citation2011).
Risk tolerance is described as the willingness of an individual to take part in behaviours where the outcomes are uncertain but also accompanied by the possibility of a negative result (Grable & Joo, Citation2004; J.E. Grable, Citation2000). An individual’s level of risk tolerance encompasses the degree to which they are willing to accept uncertainty (J.E. Grable, Citation2016). Risk tolerance can be influenced by various demographical factors such as gender, age, level of income, occupation and marital status (J.E. Grable, Citation2000). In terms of investors’ risk tolerance levels, Weller and Tikir (Citation2010) advocate that it is important to recognise the influence personality types have on the investor’s decision-making processes. Individuals frequently display unpredictable responses to risks across varied domains and situations (Schoemaker, Citation1990; Weller & Tikir, Citation2010). Moreover, unpredictable responses are frequently displayed by individuals regarding risk-taking behaviours in different situations and personality domains (Powell & Ansic, Citation1997).
The debate of risk tolerance being part of a personality domain has undertaken a similar expansion to that of personality traits in general (Blais & Weber, Citation2006). In terms of personality traits relating to risk-taking behaviour, Harris et al. (Citation2006) and Weller and Tikir (Citation2010) argue that the tendency of females’ risk aversion could be accredited to the propensity of making decisions based on emotion. Fisher and Yao (Citation2017) argue that female investors’ financial risk tolerance should be measured more reliably and accurately, as current measures are not sufficient in determining their financial risk tolerance levels.
In the financial markets, it is frequently found that females display risk-averse behaviour with regards to investment behaviour and/or financial decision-making processes (Schubert et al., Citation1999). In the South African context, previous research indicates that South Africa conforms to the literature stereotype of female risk aversion (Lawrenson, Citation2017). To aid this phenomenon, Brick et al. (Citation2012) in a study titled “Risk Aversion: Experimental Evidence From South African Fishing Communities” states that in the sample used, female participants were more risk-averse than their male counterparts. In the study titled “Resolving Risk? Marriage and Creative Conjugality”, Jackson (Citation2007) obtained similar results. As such, the purpose of this study is to develop a model for investment firms to more accurately profile their investors, considering the investor’s risk tolerance, personality traits and level of education.
2. Literature review
In fluctuating markets, investors often face uncertainty when they make financial decisions. Generally, the decisions the investors face include some degree of risk. Risk is defined as uncertainty in its most simple form (Head, Citation1967). Risk tolerance is one of the key components of risk. Risk tolerance refers to the amount of uncertainty an investor is willing to take, with the expectation of receiving something in return for the uncertainty they bear (J.E. Grable, Citation2000). Generally, investors are categorised according to their risk tolerance level. Investors can either be risk-averse, risk-neutral or risk-seeking. Risk-averse investors refer to investors who do not have any preference for risk in their financial decisions (Paulsen et al., Citation2012). Risk neutral investors refer to investors who do not have a precise preference for risk (Concina, Citation2014). Whereas, risk-seeking investors have a clear preference for risk (Concina, Citation2014). Once investors are aware of their level of risk tolerance, it is expected that they will participate in suitable financial behaviour.
The investor’s level of risk tolerance is influenced by numerous factors, including but not limited to, demographical factors and cognitive factors. Other factors generally include environmental and economic factors (Kannadhasan et al., Citation2016). Furthermore, the focus of cognitive factors is on the investor’s personality traits. The Five-Factor Model focuses on the following personality traits, namely: (i) neuroticism, (ii) extraversion, (iii) openness to experience, (iv) agreeableness, and (v) conscientiousness (Cooper, Citation2003; Mayfield et al., Citation2008; Rothmann & Coetzer, Citation2003; Vazifehdoost et al., Citation2012). Furthermore, the adapted model also focuses on investors’ inclination to invest in the short-and long-term.
The neuroticism personality trait, also known as emotionality, refers to the inclination of individuals to feel worried, unhappy, uncomfortable and also self-doubting (Cooper, Citation2003). Myers et al. (Citation2010) argue that the neuroticism or emotionality trait is also sometimes referred to as the anxiety factor. Furthermore, this trait encompasses individuals facing unfavourable emotions (Myers et al., Citation2010; Rothmann & Coetzer, Citation2003). The extraverted personality trait refers to individuals who are ambitious and more confident, as well as individuals who are more verbose and gregarious (Cooper, Citation2003). Some researchers argue that more extraverted individuals, prefer to be in more contact with other people (Myers et al., Citation2010). Furthermore, this trait displays the individual’s tendency to express their personal opinions, as well as their leadership skills (Myers et al., Citation2010; Verduyn & Brans, Citation2012).
The openness to experience personality trait relates to the ability of an individual to be inventive, sophisticated, inquisitive, and to also be unique (Cooper, Citation2003; Kaufman, Citation2013). Some researchers state that the openness to experience trait also refers to an individual’s ability to be open to new experiences, as well as the ability of the individual to accept change (Myers et al., Citation2010). Cooper (Citation2003) argues that individuals with agreeableness personality trait are inclined to be more considerate, forgiving, naïve, as well as lenient. Agreeable individuals normally display pleasant and supportive behaviour (Cooper, Citation2003). Researchers such as Myers et al. (Citation2010), argue that agreeableness is the inclination of the individual being more empathetic. Cooper (Citation2003) argues that the conscientiousness personality trait is the inclination of the individual being systematic and careful, being a hard worker, being responsible, and is also somebody who is organised and determined. Researchers such as Jackson et al. (Citation2010) and Vazifehdoost et al. (Citation2012) argue that individuals in this trait are also more strategic, and display more organised behaviour, rather than being impulsive.
Personality constructs differ between gender. Males and females do not report the same levels of differences in the five personality domains. Feingold (Citation1994) conducted a study by making use of a meta-analysis and obtained results indicating a distinct difference in personality traits based on gender. Schmitt et al. (Citation2008) conducted a study across 55 nations and found results supporting the differences in personality traits based on gender. In the study of Costa et al. (Citation2000), female participants provided higher scores on the neuroticism trait. Karwowski et al. (Citation2013) provided results indicating that three of the big five personality traits influenced both male and female participants in the same manner. However, female participants provided results for the other two personality traits, associating agreeableness negatively, and extraversion positively with creative self-efficacy. Furthermore, female investors generally display opposite behaviour in terms of their risk tolerance behaviour than their male counterparts. Gender often influences investors’ decision-making processes and their degree of risk tolerance.
In general, females are perceived to be nurturers and not the traditional providers of households (McKenzie, Citation2011). Thus, it can be concluded that females are underrepresented and disadvantaged regarding their investment behaviour. For female investors to break free from the literature stereotype and to improve their participation in investment activities, they will need a better understanding of their level of risk tolerance. The gender differences in financial risk tolerance have been studied widely (Bajtelsmit & Bernasek, Citation1996; Booth & Nolen, Citation2012; Byrnes et al., Citation1999; Cárdenas et al., Citation2012; Charness & Gneezy, Citation2011; Dwyer et al., Citation2002; Fisher & Yao, Citation2017).
Gender stereotyping is common when measuring an investor’s level of risk tolerance (Roszkowski & Grable, Citation2005; Yao & Hanna, Citation2005). It is generally believed that male investors are more risk-tolerant than their female counterparts (Dickason & Ferreira, Citation2018; Gibson et al., Citation2013; Roszkowski & Grable, Citation2005; Yao & Hanna, Citation2005). Some researchers argue that the prevalence of male risk tolerance levels may be attributed to culture and upbringing of children (Larkin et al., Citation2013; Slovic, Citation1966). It is commonly found and expected that male investors will be more risk-tolerant than their female counterparts. This risk-tolerant behaviour has also been previously found in the South African context by Jackson (Citation2007), Brick et al. (Citation2012), and Lawrenson (Citation2017). Literature suggests that female investors are associated with lower levels of financial risk tolerance, and male investors with higher levels of financial risk tolerance (Dickason & Ferreira, Citation2018; Gibson et al., Citation2013; Roszkowski & Grable, Citation2005; Yao & Hanna, Citation2005).
With regards to financial risk tolerance of an investor, education refers to the level of formal education the investor completed (J.E. Grable, Citation1997). Larkin et al. (Citation2013) argue that an investor’s level of education plays an important role in determining the investor’s level of risk tolerance. In general, researchers state that higher levels of financial risk tolerance are positively linked with higher levels of education (Grable & Joo, Citation2004; J.E. Grable, Citation1997; Larkin et al., Citation2013; Sung & Hanna, Citation1996). Hallahan et al. (Citation2003) argue that an investor’s level of education will influence the investor’s ability to take risk. Furthermore, Hallahan et al. (Citation2003) state that investors who obtained higher levels of education are considered to be more risk-tolerant in their financial decision-making. The positive association between financial risk tolerance and education can be attributed to the need for education to better understand inherent risks in certain investment decisions (Yao et al., Citation2005).
Although the literature proposes a positive relationship between education and financial risk tolerance, some researchers have obtained results indicating the opposite (McInish, Citation1982). McInish (Citation1982) obtained results in the study titled “Individual investors and risk-taking”, proposing that education and financial risk tolerance are positively correlated; however, the coefficients of education were not statistically significant in any of the regressions. Researchers agree that the demographical characteristics described above are positively correlated with the financial risk tolerance level of an investor. As such, the theoretical foundation suggests that lower levels of risk tolerance are associated with lower levels of education, and higher levels of risk tolerance with higher levels of education.
3. Methodology
The following sections identify the research approach, research instrument, the sample as well as the formulated hypothesis and statistical analysis techniques employed throughout the research article.
3.1. Research instrument
This paper made use of previously collected data, thus following a secondary data analysis (SDA) approach. An electronic questionnaire was distributed by an investment firm in 2018 in South Africa. The survey was loaded onto the investment firm’s electronic database which the firm uses to communicate with its clients. To ensure anonymity, the researcher did not know the client database of the relevant investment firm, as the company performed the screening of the participants. Therefore, the anonymity of the participants was guaranteed.
The questionnaire used to gather the data for this study comprised six sections. However, this study only made use of the following sections. Section A gathered the demographic information of the participants, Section B included a scale measuring investors’ financial well-being, the Grable and Lytton 13-item risk tolerance scale (GL-RTS), and the Survey of Consumer Finances (SCF) single risk tolerance question. Section E focussed on the investors’ personality, making use of an adapted five-factor model using the Big Five personality traits:
Neuroticism (N),
Extraversion (E),
Openness to experience (O),
Agreeableness (A),
Conscientiousness (C),
Risk aversion (RA),
Short-term intentions (ST), and
Long-term intentions (LT).
3.2. Research sample selection
The target population for this study was investors who held a formal investment at a specific private investment firm in South Africa. The target population was a representative sample of the South African context, as participants reside in all nine provinces of the country. In terms of this research study, the investment firm in question granted the use of their data, as long as their name is not mentioned in any way. A purposive sampling method was employed by the investment firm, with the sample size constituting 1 065 of their investors. Within the sample, 56.0 percent were female and 44.0 percent male. Furthermore, 55.0 percent of the sample were aged 50 years and older. Majority of the sample were classified as white (67.0%). In terms of educational level, 35.0 percent holds a diploma as their highest level of education.
3.3. Statistical analysis
Reliability analysis and independent samples t-tests were used to determine the effect of gender on investor’s risk tolerance levels. Structural equation modelling (SEM) was used to model female investor’s financial risk tolerance, considering their personality traits and level of education.
4. Empirical results and discussion
This section of the paper focuses on the empirical results obtained, as well as the discussions relating to each method of statistical analysis.
4.1. Investors’ personality traits
In terms of reliability, all the personality domains hold acceptable Cronbach alpha values (values > 0.60), except for openness to experience (Neuroticism, = 0.87, Extraversion—
= 0.77, Openness to experience—
= 0.56, Agreeableness—
= 0.72, Conscientiousness—
= 0.65, Risk Aversion—
= 0.77, Short term intentions—
= 0.70, and Long term intentions—
= 0.77). The openness to experience domain was adjusted to obtain the Cronbach alpha value of
= 0.72. This value was obtained by removing the third variable from the openness to experience domain. As such, the scale is deemed reliable as all Cronbach alpha values are higher than 0.7.
In terms of confirmatory factor analysis for the adapted five-factor model, it is evident that all factors forming part of the personality domains are significant (p < 0.01) and the factors indicated suitable loadings. Agreeableness’s fourth sub-domain indicated a very small significance, along with conscientiousness’s first and second sub-domains, also indicating a very small significance. Furthermore, investors are more concerned with their degree of risk aversion than their investment’s time horizon. However, investors prefer to invest in the long term rather than the short term (MeanRA = 3.76, MeanLT = 3.73, MeanST = 3.09). Table below presents the personality measures' estimates and p-values.
As the chi-square test is seen as an excessively strict indicator of model fit, Hancock and Mueller (Citation2010) proposed small deviations from the model. Mueller (Citation1996) is of the opinion that the chi-square statistic should be divided by the degrees of freedom (CMIN/DF). The CMIN/DF value obtained for this analysis is 4.64, which represents a good model fit (Mueller, Citation1996). A moderately adequate comparative fit index (CFI) value of 0.848 was obtained, while a root mean square error of approximation (RMSEA) value of 0.058, with a 90 percent confidence interval of [0.056; 0.061].
4.1.1. The effect of gender on investors’ risk tolerance
The SCF single risk tolerance question was included in the questionnaire as a control question to determine investors degree of risk tolerance. Majority of the investors indicated that they are willing to take average financial risks (32.3%), and above-average financial risks (29.3%). Furthermore, the GL-RTS was also used to determine investors’ degree of risk tolerance. The scale measures investors degree of risk tolerance according to three facets, namely investment risk, financial risk, and speculative risk. Speculative risk held the highest standard deviation value (Std dev = 0.96), indicating that investors were more prone to engage in speculative financial risk tolerance behaviour.
The GL-RTS was adapted and three of the constructs were removed as these constructs presented low correlations. Constructs 1, 7 and 10 were removed. Before the adapted scale, a Cronbach alpha value of 0.67 was obtained. After the scale has been adapted, the Cronbach alpha value was 0.68. The initial Cronbach alpha value of 0.67 is deemed suitable according to Malhotra (Citation2010, p. 319), as the value is > 0.60. However, based on the low correlations of the three removed constructs, the adapted scale’s Cronbach alpha value will be used to determine whether the scale is reliable. The Cronbach alpha value of 0.68 is > 0.60 and thus the scale measuring investor’s risk tolerance is deemed reliable. Table below presents the independent samples t-test for risk tolerance.
Table 1. Personality measures estimates and p-values
Table 2. Independent samples t-test for risk tolerance
Table 3. The relationship between risk tolerance and level of education
Table 4. Standardised regression weights for risk tolerance scale, personality domains and level of education
Table indicates the differences in risk tolerance of investors, based on their gender. As discussed above, it is evident that the SCF single risk tolerance question yields a small difference in investor risk-tolerant behaviour based on their gender (MMale = 2.56, MFemale = 2.54). The effect size calculated for the SCF single risk tolerance question is r = 0.01, which is indicative of a very small effect (Cohen, Citation1988).
The GL-RTS provided an effect size of r = 0.48, which is indicative of a medium-sized effect. Thus, gender does have a medium impact on the investor’s risk tolerance. Levene’s test indicated a significance value of p = 0.473, which is greater than 0.05, suggesting that the variability of the scores are comparatively the same (Levene, Citation1960). The independent t-test displays a significance of p < 0.000 at the 5 percent confidence interval. Thus, this significance value indicates that gender does have a significant impact on the investor’s risk tolerance. The mean scores obtained for the male and female portion of the sample, confirm the difference in risk tolerance based on gender (MMale = 2.14, MFemale = 1.94). The higher mean score for the male portion of the sample indicates that male investors are more likely to participate in financial risk-tolerant behaviour than their female counterparts. Results obtained in this study are in line with those obtained by J.E. Grable (Citation2000). Table presents the relationship between the investor's level of risk tolerance and level of education.
5.1.2. The effect of education on investors’ risk tolerance
The GL-RTS presented a significance value (p < 0.01), which indicates that the investor’s level of risk tolerance and level of education holds a significant relationship, as presented in the table below. In terms of effect size, the Cramer’s V (V = 0.13) indicates that the relationship between the level of risk tolerance and level of education holds a small effect, at a 99 percent confidence interval (p < 0.01).
Figure below identifies the relationship between the investor’s level of education and their level of financial risk tolerance.
Figure 1. Relationship between the level of risk tolerance and education.
From the figure above, it is evident that lower educated investors account for the majority of the sample, typically those investors with an education level of matric and diploma (60.14%). Investors who are higher educated account for the remainder of the sample (undergraduate degree and postgraduate degree—39.86%). Furthermore, investors who are less educated prefer to take more financial risks and investors who are more educated, prefer to take fewer financial risks. An interesting result is that investors who possess Matric as their highest level of education. These investors tend to take substantial financial risks, although it is expected from the literature that lower educated investors should take fewer risks. Furthermore, investors possessing Postgraduate degrees as their highest level of education only prefer to take average financial risks, this contradicts assumptions in the literature that higher educated investors tend to take greater risks (Irwin, Citation1993). As such, the investor’s level of education significantly influences their degree of financial risk tolerance. The results obtained in this study are in line with those obtained by Hallahan et al. (Citation2003) and (McInish, Citation1982).
4.2. Structural equation model
The following sections provide the statistical analyses for developing the SEM. The results are presented in the order of conducting a SEM.
4.2.1. Define individual constructs
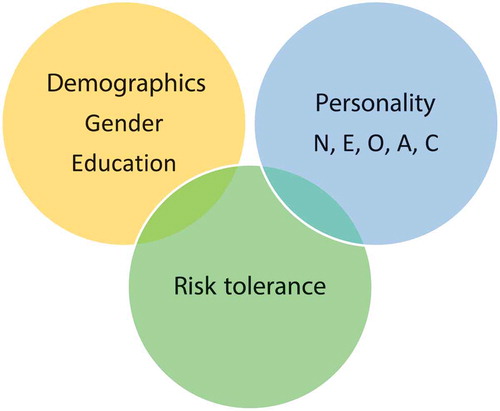
In this research study, a relationship between the investor’s demographical characteristics, their level of financial risk tolerance and their personality traits exist. Figure below identifies the theoretical relationships between these variables.
Figure 2. Theoretical relationship amongst variables.
4.2.2. Develop and identify measurement tool
As this study followed a SDA approach, the researcher made use of existing data. As such, no measurement tool was developed. However, the GL-RTS, as well as the SCF single risk tolerance question, was identified as measuring tools for the investor’s level of risk tolerance. Moreover, the adapted five-factor model was used as a measuring tool for the investor’s personality traits.
4.2.3. Indicate structural model
In terms of the structural model, a moderately adequate CFI value of 0.818 was obtained. An RMSEA value of 0.053 with a 90.00 percent confidence interval of [0.050; 0.055] was obtained. The CMIN/DF value obtained in this study is 2.66, which represents a good model fit (Mueller, Citation1996). Figure below identifies the structural model.
Figure 3. Structural equation model.

4.2.4. Assess structural model validity
Table presents the standardised regression weights for the GL-RTS, personality domains and level of education.
In terms of the GL-RTS, risk aversion has a unique statistically significant contribution (p < 0.01) to the investor’s risk tolerance with a negative extent (standardised regression coefficient = −0.62). The remainder of the personality traits and level of education did not have a unique contribution to the GL-RTS. However, all the variables aid in the explanation of the structural model.
It is concluded that all the personality domains, level of risk tolerance and level of education contributed to the development of the SEM. Risk aversion contributed significantly to the development of the model. The investors’ risk profile is thus significantly influenced by their personality traits, level of risk tolerance and level of education.
5. Conclusion
From the discussions presented above, it is evident that the investor’s personality traits could be determined by making use of the adapted five-factor model. The scale was determined to be reliable and all the factors the scale intended to measure were achieved. Furthermore, it is evident that the investor’s gender significantly influenced their level of financial risk tolerance. Male investors were found to be more risk-tolerant than their female counterparts. Moreover, the investor’s level of education also significantly influenced their level of financial risk tolerance.
This study yielded interesting results, with lower educated investors displaying higher levels of financial risk tolerance. Whereas, higher educated investors displayed lower levels of financial risk tolerance. Finally, the SEM conducted provides a measurement model for investment firms to more accurately profile their female investors based on their level of risk tolerance, personality traits and level of education. It is recommended that the same questionnaire is distributed to investors at other investment firms in South Africa, to obtain a more holistic sample.
Additional information
Funding
Notes on contributors
Z. Dickason-Koekemoer
Dr Jessica Lawrenson specialises in the field of financial risk management, recently obtaining her PhD in the same field. Her main research area is on investors’ risk tolerance and personality traits, with a specific focus on female investor behaviour.
Dr Zandri Dickason-Koekemoer also specialises in financial risk management and also obtained her PhD degree in this field. Her main research focus is on financial risk tolerance, investors’ financial well-being, and investors’ financial behaviours. She has published several articles in accredited journals regarding this field of interest.
References
- Bajtelsmit, V. L., & Bernasek, A. (1996). Why do women invest differently than men? Financial Counseling and Planning, 7, 1–14.
- Blais, A. R., & Weber, E. U. (2006). A domain specific risk-taking (DOSPERT) scale for adult populations. Judgement and Decision Making, 1(1), 33–47.
- Booth, A. L., & Nolen, P. (2012). Gender differences in risk behaviour: Does nurture matter? The Economic Journal, 122(558), 56–78. https://doi.org/10.1111/j.1468-0297.2011.02480.x
- Borden, L. M., Lee, S.-A., Serido, J., & Collins, D. (2008). Changing college students’ financial knowledge, attitudes, and behavior through seminar participation. Journal of Family and Economic Issues, 29(1), 23–40. https://doi.org/10.1007/s10834-007-9087-2
- Boyer, T. W. (2006). The development of risk-taking: a multi-perspective review. Developmental Review, 26(3), 291–345. https://doi.org/10.1016/j.dr.2006.05.002
- Brick, K., Visser, M., & Burns, J. (2012). Risk aversion: Experimental evidence from South African fishing communities. American Journal of Agricultural Economics, 94(1), 133–152. https://doi.org/10.1093/ajae/aar120
- Byrnes, J. P., Miller, D. C., & Schafer, W. D. (1999). Gender differences in risk taking: A meta-analysis. Psychological Bulletin, 125(3), 367–383. https://doi.org/10.1037/0033-2909.125.3.367
- Cárdenas, J.-C., Dreber, A., von Essen, E., & Ranehill, E. (2012). Gender differences in competitiveness and risk taking: Comparing children in Colombia and Sweden. Journal of Economic Behavior & Organization, 83(1), 11–23. https://doi.org/10.1016/j.jebo.2011.06.008
- Charness, G., & Gneezy, U. (2011). Strong evidence for gender differences in risk taking. Journal of Economic Behavior & Organization, 83(1), 50–58. https://doi.org/10.1016/j.jebo.2011.06.007
- Cohen, J. W. (1988). Statistical power analysis for the behavioural sciences. Lawrence Erlbaum Associates.
- Concina, L. (2014). Risk attitudes & economics. Foundation for an Industrial Safety Culture (Fronsci).
- Cooper, D. (2003). Understanding how personality & perception can influence risk taking. The Journal for Occupational Safety and Health Professionals, 39–46.
- Costa, P. T., Terracciano, A., & McCrae, R. R. (2000). Gender differences in personality traits across cultures: Robust and surprising findings. Journal of Personality and Social Psychology, 81(2), 322–331. https://doi.org/10.1037/0022-3514.81.2.322
- Dickason, Z., & Ferreira, S. J. (2018). The effect of gender and ethnicity on financial risk tolerance in South African. Gender & Behaviour, 16(1), 10851–10862.
- Dohmen, T., Falk, A., Huffman, D., & Sunde, U. (2005). Individual risk attitudes: Measurement, determinants and behavioural consequences. The European Economic Association, 1, 1–47.
- Dwyer, P. D., Gilkeson, J. H., & List, J. A. (2002). Gender differences in revealed risk taking: Evidence from mutual fund investors. Economics Letters, 76(2), 151–158. https://doi.org/10.1016/S0165-1765(02)00045-9
- Feingold, A. (1994). Gender differences in personality: A meta-analysis. Psychological Bulletin, 116(3), 429–456. https://doi.org/10.1037/0033-2909.116.3.429
- Fisher, P. J., & Yao, R. (2017). Gender differences in financial risk tolerance. Journal Of Economic Psychology, 61, 191–202. https://doi.org/10.1016/j.joep.2017.03.006
- Gibson, R., Michayluk, D., & Van de Venter, G. (2013). Financial risk tolerance: An analysis of unexplored factors. Financial Services Review, 22(1), 23–50.
- Grable, J. E. 1997. Investor risk tolerance: testing the efficacy of demographics as differentiating and classifying factors (Dissertation). Blacksburg.
- Grable, J. E. (2000). Financial risk tolerance and additional factors that affect risk taking in everyday money matters. Journal of Business and Psychology, 14(4), 625–630. https://doi.org/10.1023/A:1022994314982
- Grable, J. E. (2016). Financial risk tolerance. Springer International Publishing.
- Grable, J. E., & Joo, S. (2004). Environmental and biopsychosocial factors associated with financial risk tolerance. Financial Counseling and Planning, 15(1), 73–82.
- Gustafson, P. E. (1998). Gender differences in risk perception: Theoretical and methodological perspectives. Risk Analysis, 18(6), 805–811. https://doi.org/10.1023/B:RIAN.0000005926.03250.c0
- Hallahan, T., Faff, R., & McKenzie, M. (2003). An exploratory investigation of the relation between risk tolerance scores and demographic characteristics. Journal of Multinational Financial Management, 13(4–5), 483–502. https://doi.org/10.1016/S1042-444X(03)00022-7
- Hancock, G. R., & Mueller, R. O. (2010). The reviewer’s guide to quantitative methods in the social sciences. Routledge.
- Harris, C. R., Jenkins, M., & Glaser, D. (2006). Gender differences in risk assessment: Why do women take fewer risks than men? Judgement and Decision Making, 1(1), 48–63.
- Head, G. L. (1967). An alternative to defining risk as uncertainty. The Journal of Risk and Insurance, 34(2), 205–214. https://doi.org/10.2307/251319
- Irwin, C. E., Jr. (1993). Adolescence and risk taking: How are they related. In N. J. Bell & R. W. Bell (Eds.), Adolescent risk taking (pp. 7–28). SAGE Publications Inc.
- Jackson, C. (2007). Resolving risk? Marriage and creative conjugality. Development and Change, 38(1), 107–129. https://doi.org/10.1111/j.1467-7660.2007.00405.x
- Jackson, J. J., Wood, D., Bogg, T., Walton, K. E., Harms, P. D., & Roberts, B. W. (2010). What do conscientious people do? Development and validation of the behavioral indicators of conscientiousness (BIC). Journal of Research in Personality, 44(4), 501–511. https://doi.org/10.1016/j.jrp.2010.06.005
- Jianakoplos, N., & Bernasek, A. (1998). Are women more risk averse? Economic Inquiry, 36(4), 620–630. https://doi.org/10.1111/j.1465-7295.1998.tb01740.x
- Kannadhasan, M., Aramvalarthan, S., Mitra, S. K., & Goyal, V. (2016). Relationship between biopsychosocial factors and financial risk tolerance: An empirical study. The Journal for Decision Makers, 41(2), 117–131. https://doi.org/10.1177/0256090916642685
- Karwowski, M., Lebuda, I., Wisniewska, E., & Gralewski, J. (2013). Big five personality traits as the predictors of creative self-efficacy and creative personal identity: Does gender matter? The Journal of Creative Behaviour, 47(3), 215–232. https://doi.org/10.1002/jocb.32
- Kaufman, S. B. (2013). Opening up openness to experience: A four-factor model and relations to creative achievements in the arts and sciences. The Journal of Creative Behaviour, 47(4), 233–255. https://doi.org/10.1002/jocb.33
- Larkin, C., Lucey, B. M., & Mulholland, M. (2013). Risk tolerance and demographic characteristics: Preliminary Irish evidence. Financial Services Review, 22(1), 77–91.
- Lawrenson, J. (2017). Personality and risk-taking behaviour: Exploring gender-based differences. North-West University. (Masters - Thesis).
- Levene, H. (1960). Probability and statistics: Essays in honor of harold hotelling. Stanford University Press.
- Lusardi, A. (2008). Financial literacy: An essential tool for informed consumer choice? Harvard Business School.
- Malhotra, N. K. (2010). Marketing research: An applied orientation (6th ed.). Pearson Education.
- Mayfield, C., Perdue, G., & Wooten, K. (2008). Investment management and personality type. Financial Services Review, 17, 219–236.
- McInish, T. H. (1982). Individual investors and risk-taking. Journal Of Economic Psychology, 2(2), 125–136. https://doi.org/10.1016/0167-4870(82)90030-7
- McKenzie, M. N. 2011. Gender roles and South Africa. Retrieved August 12, 2018, from https://interuwcmag.wordpress.com/2011/11/10/gender-roles-and-south-africa/
- Mueller, R. O. (1996). Basic principles of structural equation modelling: An introduction to LISREL and EQS. Springer.
- Myers, S. D., Sen, S., & Alexandrov, A. (2010). The moderating effect of personality traits on attitudes toward advertisements: A contingency framework. Management & Marketing, 5(3), 3–20.
- Paulsen, D. J., Platt, M. L., Huettel, S. A., & Brannon, E. M. (2012). From risk-seeking to risk-averse: The development of economic risk preference from childhood to adulthood. Frontiers in Psychology, 3, 1–6. https://doi.org/10.3389/fpsyg.2012.00313
- Pereira da Silva, R. J. C. (2012). Risk profiling and the DOSPERT scale: An approach using prospect theory. ISEG.
- Powell, M., & Ansic, D. (1997). Gender differences in risk behaviour in financial decision-making: An experimental analysis. Journal Of Economic Psychology, 18(6), 605–628. https://doi.org/10.1016/S0167-4870(97)00026-3
- Robb, C. A., & Woodyard, A. S. (2011). Financial knowledge and best practice behaviour. Journal of Financial Counseling and Planning, 22(1), 60–70.
- Roszkowski, M. J., & Grable, J. E. (2005). Gender stereotypes in advisors’ clinical judgments of financial risk tolerance: Objects in the mirror are closer than they appear. The Journal of Behavioral Finance, 6(4), 181–191. https://doi.org/10.1207/s15427579jpfm0604_2
- Rothmann, S., & Coetzer, E. P. (2003). The big five personality dimensions and job performance. SA Journal of Industrial Psychology, 29(1), 68–74. https://doi.org/10.4102/sajip.v29i1.88
- Schmitt, D. P., Realo, A., Voracek, M., & Allik, J. (2008). Why can’t a man be more like a woman? Sex differences in big five personality traits across 55 cultures. Journal of Personality and Social Psychology, 94(1), 168–182. https://doi.org/10.1037/0022-3514.94.1.168
- Schoemaker, P. J. H. (1990). Are risk-attitudes related across domains and response modes? Management Science, 36(12), 1451–1463. https://doi.org/10.1287/mnsc.36.12.1451
- Schubert, R., Brown, M., Gysler, M., & Wolfgang, H. (1999). Financial decicion-making: Are women really more risk averse? The American Economic Review, 89(2), 381–385. https://doi.org/10.1257/aer.89.2.381
- Slovic, P. (1966). Risk-taking in children: Age and sex differences. Child Development, 37(1), 169–176. https://doi.org/10.2307/1126437
- Sung, J., & Hanna, S. D. (1996). Factors related to risk tolerance. Financial Counseling and Planning, 7, 11–20.
- Vazifehdoost, H., Akbari, M., & Charsted, P. (2012). The role of psychological traits in market mavenism using big five model. International Journal of Management and Business, 2(3), 243–252.
- Verduyn, P., & Brans, K. (2012). The relationship between extraversion, neuroticism and aspects of trait affect. Personality and Individual Differences, 52(6), 664–669. https://doi.org/10.1016/j.paid.2011.12.017
- Watson, J., & McNaughton, M. (2007). Gender Differences in Risk Aversion and Expected Retirement Benefits. Financial Analysts Journal, 63(4), 52–62. https://doi.org/10.2469/faj.v63.n4.4749
- Weller, J. A., & Tikir, A. (2010). Predicting domain-specific risk taking with the HEXACO personality structure. Journal of Behavioural Decision Making, 24(2), 117–222.
- Yao, R., Gutter, M. S., & Hanna, S. D. (2005). The financial risk tolerance of Blacks, Hispanics and Whites. Financial Counseling and Planning, 16(1), 51–62.
- Yao, R., & Hanna, S. D. (2005). The effect of gender and marital status on financial risk tolerance. Journal of Personal Finance, 4(1), 66–85.
