
 ?Mathematical formulae have been encoded as MathML and are displayed in this HTML version using MathJax in order to improve their display. Uncheck the box to turn MathJax off. This feature requires Javascript. Click on a formula to zoom.
Abstract
This paper studies the effect of new gold derivatives products, including Gold-D and Gold Online Futures, on the futures price volatility of existing gold futures with two contract sizes, 50 baht-weight and 10 baht-weight, using symmetric and asymmetric GARCH family models, namely: GARCH (1,1), TARCH (1,1), and EGARCH (1,1) models. The results reveal the existence of leverage effect in TARCH (1,1) and EGARCH (1,1) models. Moreover, TARCH (1,1) is found as the best fitting model in modelling gold futures price volatility. The results confirm that the coming into market of Gold-D significantly reduces the price volatility of existing gold futures. There is not a significant negative relationship between the introduction of Gold Online Futures and the existing gold futures price volatility. Therefore, the results suggest regulatory authority to lower the level of margin requirements for the related futures contracts, along with the issuance of new derivatives products.
PUBLIC INTEREST STATEMENT
Thailand Futures Exchange (TFEX) offers two new gold derivatives products, including Gold-D and Gold Online Futures, to make the Thai gold futures market become more active. It is interesting to analyze the effect of new gold derivatives products on the TFEX’s existing gold futures with two contract sizes, 50 baht-weight and 10 baht-weight, using GARCH family models. The results confirm that the coming into market of Gold-D significantly reduces the price volatility of existing gold future contracts. Although a negative relationship between the introduction of Gold Online Futures and the price volatility of 50 Baht Gold Futures and 10 Baht Gold Futures is not significant, the regulatory authority should consider lowering margin requirements for existing gold futures as the market becomes less volatile. Moreover, there is the presence of leverage effect on 50 Baht Gold Futures and 10 Baht Gold Futures markets. Bad news increases volatility more than good news.
1. Introduction
A gold futures contract is an instrument that can help investors to speculate in both uptrend and downtrend gold markets and to hedge against gold price fluctuations. First launch of gold derivatives in Thailand was 50 Baht Gold Futures on 2 February 2009. It was followed by 10 Baht Gold Futures contract on 2 August 2010. Both contracts on 96.5% gold bullion with London Gold AM Fixing as an underlying asset offer cash settlement. However, to make the Thai gold futures market become more active, Thailand Futures Exchange (TFEX) rolled out Gold-D, a futures contract with 99.99% pure gold as an underlying asset, on 4 September 2017. Its features of being quoted in US dollars but settled in Thai Baht, plus physical delivery, make Gold-D different from TFEX’s existing gold futures. However, investors still face the corresponding risk of adverse movements in the exchange rate when closing their investment positions. Therefore, to attract investors who have a specific view on the gold price movement and want to trade without concern for exchange rate fluctuation, TFEX launched Gold Online Futures with 99.5% pure gold as an underlying asset on 5 November 2018. It is traded and cash-settled in Thai Baht. The new contracts coming into the market have a significant impact on gold futures market. Gold-D and Gold Online Futures are expected to gain popularity and attract investors from 50 Baht Gold Futures and 10 Baht Gold Futures. Therefore, the price volatility of 50 Baht Gold Futures and 10 Baht Gold Futures may alter significantly due to a decrease in trading activity.
Futures price volatility is an important factor affecting decisions to alter the level of margin requirements and hedging strategies in futures market. Therefore, understanding futures price volatility has been a key issue in futures market research. Previous research concentrates on the relationship among futures price volatility, trading volume, open interest, and time to expiration. Considerable evidence, such as Madarassy Akin (Citation2003), Xin et al. (Citation2005), Kuo et al. (Citation2005), Pati (Citation2006), Ripple and Moosa (Citation2009), Jongadsayakul (Citation2014a), and Kadioğlu et al. (Citation2016), shows a positive relationship between futures price volatility and trading volume. However, the volatility–volume relationship might depend on the type of trader. Daigler and Wiley (Citation1999) find that the positive volatility‐volume relationship is driven by the general public whereas the inverse relationship between volatility and volume is driven by clearing members and floor traders. Jongadsayakul (Citation2015) also shows a negative role of trading volume in determining silver futures price volatility. In addition to trading volume, open interest is also a proxy for futures trading activity. The expectation is that open interest is negatively related to volatility (Xin et al., Citation2005; Feng & Chuan-zhe, Citation2008; Ripple & Moosa, Citation2009; Kadioğlu et al., Citation2016), as the availability of more contracts represents increased market depth, implying greater liquidity. However, the studies by Madarassy Akin (Citation2003), Pati (Citation2006), and Jongadsayakul (Citation2015) show the positive volatility-open interest relationship. In case of time to maturity as an explanatory for futures price volatility, Samuelson (Citation1965) states that futures price volatility should increase as the contract approaches expiration. His hypothesis has been supported in various studies (Madarassy Akin, Citation2003; Duong & Kalev, Citation2008; Karali et al., Citation2009; Karali & Thurman, Citation2010; Kadioğlu et al., Citation2016). In addition, the maturity effect tends to be stronger in agricultural and energy commodities than in financial futures (Daal et al., Citation2006). However, the inverse maturity effect is found in crude oil futures listed in TFEX (Jongadsayakul, Citation2014a).
Jongadsayakul (Citation2014b) models the price volatility of 50 Baht Gold Futures and 10 Baht Gold Futures in TFEX using Linear Regression and Generalized Autoregressive Conditional Heteroskedasticity (GARCH). The results of both models confirm a positive role of trading volume and a negative role of open interest in determining futures price volatility. The price volatility of gold futures also increases when the futures contract approaches expiration. Since the maturity effect has been investigated in several studies, this paper focuses on the effect of new gold futures contracts on the price volatility of existing gold futures, including 50 Baht Gold Futures and 10 Baht Gold Futures. The price volatility of existing gold futures may alter significantly because of the variation in trading volume and open interest. Following Jongadsayakul (Citation2014b), this paper uses GARCH model to examine the price volatility of 50 Baht Gold Futures and 10 Baht Gold Futures. However, the price volatility of 50 Baht Gold Futures and 10 Baht Gold Futures may be asymmetry. Therefore, this paper considers other GARCH type models like TARCH and EGARCH. Two dummy variables are also included in the model as suggested by Bin and Wen (Citation2014) to examine the effect of Gold-D and Gold Online Futures coming into the market on the price volatility of existing gold futures. This is significant because margin requirements and optimal hedging positions should be adjusted according to volatility changes.
The rest of the paper is organized as follows. Section 2 is a brief discussion of gold derivatives market in Thailand. Section 3 describes the GARCH family models, which are employed to analyze the effect of new gold derivatives products on the price volatility of existing gold futures. Then, Section 4 describes the data and outlines the methodology. Section 5 presents empirical results and analysis. Finally, Section 6 summarizes the findings of this study.
2. Gold derivatives market in Thailand
Gold derivatives products open an opportunity for investors to get profits in both uptrend and downtrend gold markets with less money and high returns. Gold derivatives trading also serves as a tool for gold investment risk management. At present, TFEX has four gold derivatives products, including 50 Baht Gold Futures, 10 Baht Gold Futures, Gold-D, and Gold Online Futures.
Gold futures trading in TFEX has developed steadily since its 2 February 2009 introduction of 50 Baht Gold Futures, with an increase in total trading volume from 311,591 contracts in 2009 to 4,462,867 contracts in 2018. 50 Baht Gold Futures is the first gold derivatives product traded in TFEX. After the introduction of 10 Baht Gold Futures on 2 August 2010, 10 Baht Gold Futures gained popularity and finally, the trading volume surpassed that of 50 Baht Gold futures in 2011. More than 90% of gold derivatives trading has been 10 Baht Gold Futures since 2015. Both 50 Baht and 10 Baht Gold Futures are based on gold bullion with a purity of 96.5% and are cash-settled. TFEX has continued to offer new products to better suit investors’ demand. Gold-D, a physical settlement futures contract based on gold bar with 99.99% purity, is the third gold derivatives products offered in TFEX on 4 September 2017, followed by Gold Online Futures with 99.5% pure gold as an underlying asset on 5 November 2018. As shown in Table , 10 Baht Gold Futures was considered the most active gold futures in 2018, representing 91.93% of the total gold futures trading volume, followed by 50 Baht Gold Futures at 3.71%, Gold-D at 2.38%, and Gold Online Futures at 1.98%, respectively.
Table 1. Trading volume of gold derivatives products
In 2018, 10 Baht Gold Futures contract’s average daily trading volume reached 16,745 contracts, an increase of 16.71% compared to that of 2017. Its open interest dropped from 47,953 contracts to 21,793 contracts, a decrease of 54.55% over 2018. Moreover, Gold Online Futures slowly gained popularity since its introduction in late 2018. Its average daily trading volume of 2,327 contracts surpassed that of 50 Baht Gold Futures and Gold-D. Both 50 Baht Gold Futures and Gold-D show a decrease in average daily trading volume along with a decrease in open interest as shown in Table .
Table 2. Average daily trading volume and open interest of gold derivatives products
Table shows investor breakdown by total trading volume in 2018. The most trading volume of precious metal futures, including 50 Baht Gold Futures, 10 Baht Gold Futures, and Gold Online Futures, was from local investors, accounting for 41% of the total precious metal futures trading volume, with 38% was made by local institutions, while another 21% was made by foreign investors. Local investors and local institutions had a net sell while foreign investors had a net buy. On the other hand, local institutions were the main investors in Gold-D market as evidenced by their trading activities which accounted for 56–57% of total Gold-D trading volume. They also have net long positions. The shares for local investors and local institutions were 43% and 0.3%, respectively. They were net sellers of Gold-D.
Table 3. Gold derivatives trading in 2018 by investor types
3. GARCH family models
Financial data typically show the spread and clustering of the volatility of the data. The Autoregressive Conditional Heteroskedasticity (ARCH) and Generalized Autoregressive Conditional Heteroskedasticity (GARCH) models were designed to capture such features of volatility of data. The ARCH model introduced by Engle (Citation1982) explicitly recognizes the difference between the unconditional and the conditional variance allowing the latter to vary linearly with the lagged squared residuals. The ARCH model is represented as follows:
where Et-1[·] represents expectation conditional on information available at time t-1, and zt is a sequence of iid random variables with mean zero and unit variance. In the basic ARCH model, zt is assumed to be iid standard normal. The restrictions α0 > 0 and αi ≥ 0 (i = 1, … , q-1), as well as αq > 0 are required for σt2 > 0. However, if the maximum lag in ARCH model becomes too large, problems with the non-negativity constraints might occur if the estimates are not restricted appropriately. Therefore, Bollerslev (Citation1986) developed the GARCH model by including p lagged values of the conditional variance on the right-hand side of Equationequation (3)(3)
(3) . This leads to the GARCH (p, q) process as follows:
where sufficient conditions for the non-negativity of the conditional variance of this process are α0 > 0, αi ≥ 0 (i = 1, … , q-1), αq > 0, βi ≥ 0 (i = 1, … , p-1), and βp > 0. With p = 0, we have ARCH (q) model. For the empirical modelling of financial market data, a GARCH (1,1) model is often sufficient. It is given by
with α0 > 0, α1 > 0, and β1 > 0. However, the GARCH model has not only the non-negativity constraints but also the disadvantage that positive and negative shocks exert the same impact on the conditional variance as the signs disappear due to squaring. It is well known that the reaction of price volatility is different if the shocks are negative than if they are positive. This leverage effect leads to higher volatility as a result of negative shocks as compared to positive ones. Two extensions of the symmetric GARCH model are presented which are capable to treat such asymmetric effects.
The Threshold ARCH (TARCH) model was introduced by Zakoian (Citation1990) and Glosten et al. (Citation1993). The main target of this model is to capture asymmetries in terms of negative and positive shocks. Thus, the specification of the conditional variance equation for the TARCH (1,1) model is given by
where dt = 1 if ϵt < 0, and 0 otherwise. If γ > 0, the leverage effect is observed as the impulse α1 + γ of negative shocks is larger than the impulse α1 of positive shocks.
The Exponential GARCH (EGARCH) model, developed by Nelson (Citation1991), not only captures asymmetries but also ensures that the conditional variance is always positive. The EGARCH model considers a natural logarithm of the conditional variance equation. The specification of the conditional variance equation for the EGARCH (1,1) model can be written as
where the standardised residuals ϵt/σt are used. The ARCH effect is produced by the absolute value of the standardised residuals and not by their squares. The asymmetry is also captured by the standardised residuals. If the leverage term is non-zero, γ ≠ 0, we find an ARCH effect of α1 + γ for positive residuals and one of α1—γ for negative residuals. Therefore, the leverage effect exists when the sign of γ is negative.
4. Data and methodology
Using daily data downloaded from the website of SETSMART, the sample data consist of settlement prices of 50 Baht Gold Futures and 10 Baht Gold Futures from the period 2 August 2010 to 26 February 2019 for the nearest even month contracts with 2,097 sample data points. The daily data are collected for a period starting 2 August 2010 due to the first trading date of 10 Baht Gold Futures together with 50 Baht Gold Futures. I construct sample data by switching or rolling over to the next maturing contract one day before the last trading date. For example, the constructed series of 50 Baht Gold Futures and 10 Baht Gold Futures start with the August 2010 futures on 2 August 2010, then switch to the next even month contract, the October 2010 futures, a day before the last trading day of the August 2010 futures. On the last trading day of October 2010 futures, it is rolled over to the December 2010 futures. The process continues until the settlement prices of 50 Baht Gold Futures and 10 Baht Gold Futures are collected from the February 2019 futures on 26 February 2019, a day before the last trading day of the February 2019 futures. The futures return, Rt,, are obtained by taking the difference of natural log of futures prices, Rt = ln Ft—ln Ft-1. The Augmented Dickey–Fuller (ADF) test without trend is also conducted to evaluate whether the futures return series are stationary or not. Table shows that the futures return series are stationary at the 1% level of significance, when the critical value is −4.011. The selection of the zero lag length is based on Schwarz information criterion.
Table 4. The unit root test results
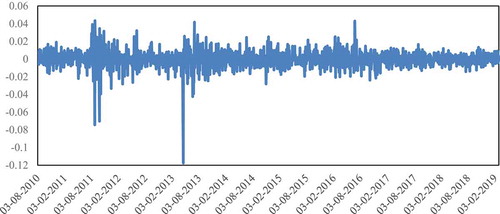
Figures and are daily log-returns of 50 Baht Gold Futures and 10 Baht Gold Futures, which show volatility clustering.
Figure 1. Daily log returns of 50 Baht gold futures from the 3/8/2010 to the 26/2/2019.

Figure 2. Daily log returns of 10 Baht gold futures from the 3/8/2010 to the 26/2/2019.
Moreover, this paper conducts the Lagrange Multiplier (LM) test for ARCH effects in the residuals as shown in Table . In case of 50 Baht Gold Futures, the LM test statistic is 11.9349 (P-value = 0.0006), which implies that the null hypothesis of no ARCH effects can be rejected at the 1% level of significance. In case of 10 Baht Gold Futures, the LM test statistics is 12.4522 (P-value = 0.0004), which also implies that the null hypothesis of no ARCH effects can be rejected at the 1% level of significance. The test results indicate that there are obvious ARCH effects existing in our data, so GARCH family models are suitable for this research.
Table 5. The Lagrange multiplier test results
Due to the existence of volatility clustering, this paper employs the GARCH (1,1) model. However, the conditional variance of futures returns often shows the different responses for the positive and negative shocks. The TARCH (1,1) model and the EGARCH (1,1) model are also used to capture the leverage effect. In addition, this paper adds two dummy variables into conditional variance equation as suggested by Bin and Wen (Citation2014) to analyze the effect of the introduction of two new derivative products, Gold-D and Gold Online Futures, on the price volatility of 50 Baht Gold Futures and 10 Baht Gold Futures. These two dummy variables, GD and GO, are defined as follows:
GD = 1 if data belong to a period of time starting the launch of Gold-D on 4 September 2017, and 0 otherwise.
GO = 1 if data belong to a period of time starting the launch of Gold Online Futures on 5 November 2018, and 0 otherwise.
The following models are then estimated to investigate the influence of the two new derivatives products, Gold-D and Gold Online Futures, coming into gold futures market.
Model 1: GARCH (1,1) Model
The augmented GARCH model with constant mean can be written as follows:
where Rt is the futures return, and where ϵt is modelled as
where zt is assumed to be iid standard normal, and where σt2 is expressed as
where α1 is the ARCH coefficient, and where β1 is the GARCH coefficient. GD and GO are two dummy variables. GD = 0 for the period 2 August 2010 to 1 September 2017 and GD = 1 for the period 4 September 2017 to 26 February 2019. GO = 0 for the period 2 August 2010 to 1 November 2018 and GO = 1 for the period 5 November 2018 to 26 February 2019.
The leverage effect is caused by the fact that a negative shock tends to increase future volatility more than a positive one of the same magnitude. This paper considers two of the most popular models to represent it: TARCH (1,1) and EGARCH (1,1)
Model 2: TARCH (1,1) Model
To capture asymmetries in terms of negative and positive shocks, the augmented TARCH model specifies the conditional variance equation as follows:
where the positive sign of γ indicates the leverage effect. The model includes two dummy variables, GD and GO. GD = 0 for the period 2 August 2010 to 1 September 2017 and GD = 1 for the period 4 September 2017 to 26 February 2019. GO = 0 for the period 2 August 2010 to 1 November 2018 and GO = 1 for the period 5 November 2018 to 26 February 2019.
Model 3: EGARCH (1,1) Model
To capture asymmetries in terms of negative and positive shocks and to guarantee a positive conditional variance, the augmented EGARCH model specifies the conditional variance of ϵt as follows:
where the negative sign of γ indicates the leverage effect. In the model, GD = 0 for the period 2 August 2010 to 1 September 2017 and GD = 1 for the period 4 September 2017 to 26 February 2019. GO = 0 for the period 2 August 2010 to 1 November 2018 and GO = 1 for the period 5 November 2018 to 26 February 2019.
5. Empirical results
To study the effect of new gold derivatives products, Gold-D and Gold Online Futures, on the price volatility of 50 Baht Gold Futures and 10 Baht Gold Futures, the GARCH family models, including GARCH (1,1), TARCH (1,1), and EGARCH (1,1), are augmented by adding two dummy variables, GD and GO, into conditional variance equation. The models given by Equationequation (8)(8)
(8) to (12) are then estimated under the assumption that the residuals follow a conditional normal distribution.
Table presents the estimated results of the GARCH family models for 50 Baht Gold Futures, displaying the estimated coefficients and their P-values, as well as diagnostic tests. The validity of the estimated models is assessed first by employing Ljung–Box Q-test statistics to check for serial correlation in the standardized residuals as well as the Ljung–Box Q test statistics on the squared standardized residuals and the Lagrange multiplier test to search for ARCH effects. The results show that the null hypothesis of no serial correlation and the null hypothesis of no ARCH effects cannot be rejected at a confidence interval of 95%. The insignificant Ljung–Box Q statistics and LM ARCH statistics imply that the residuals of the estimated models, including GARCH (1,1), TARCH (1,1), and EGARCH (1,1), are reasonably well behaved and adequately capture the persistence in the variance of returns.
Table 6. Estimation results of the GARCH family models for 50 Baht gold futures
The estimation results of GARCH (1,1) model show that the coefficient for the previous shock (the ARCH coefficient: α1) is 0.089718 and that for its lagged conditional variance (the GARCH coefficient: β1) is 0.880706. The ARCH coefficient and the GARCH coefficient are highly statistically significant at the level of 0.01. For the estimation results of TARCH (1,1) model, all estimated coefficients in the variance equation (except the effect of the launch of Gold Online Futures into the market) are significant at the level of 0.01. The good news has an impact on conditional volatility of 0.060380 while the bad news has an impact of 0.133407. The leverage effect is observed as the impulse of negative shocks is larger than the impulse of positive shocks. The EGARCH (1,1) model also shows the existence of leverage effect. The estimated coefficients, α1 and β1, are statistically significant at the level of 0.01. The leverage term, γ, is statistically different from zero at a significant level of 0.01. Due to the negative sign of γ, we find the ARCH effect of 0.148379 for positive residuals and one of 0.251079 for negative residuals.
Based on the GARCH family models, including GARCH (1,1), TARCH (1,1), and EGARCH (1,1), the coefficient of GD dummy is shown to be negative and significant at the level of 0.01, implying a significant negative relationship between the launch of Gold-D and 50 Baht Gold Futures price volatility. However, a negative relationship between the launch of Gold Online Futures and 50 Baht Gold Futures price volatility is not statistically significant. In Figure , we also plot the predicted volatility of 50 Baht Gold Futures from the GARCH family models. It shows that the estimated volatility of GARCH (1,1) is very close to the estimated volatility of TARCH (1,1) and EGARCH (1,1). However, the TARCH (1,1) model is found as the best fitting model in modelling 50 Baht Gold Futures price volatility due to the lowest values of Akaike Information Criterion (AIC) and Schwarz Criterion (SC).
Figure 3. Price Volatility of 50 Baht Gold Futures predicted using GARCH Family Models.
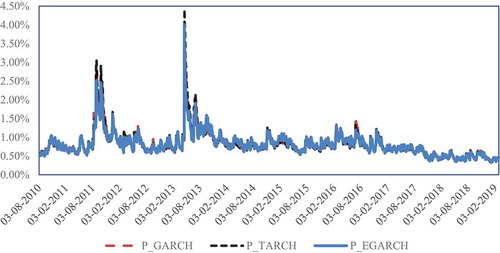
Table presents the estimated results of the GARCH family models for 10 Baht Gold Futures, displaying the estimated coefficients and their P-values, as well as diagnostic tests. This study employs Ljung–Box Q-test for serial correlation in the standardized residuals as well as the Ljung–Box Q test statistics on the squared standardized residuals and the Lagrange multiplier test to search for ARCH effects. The results show that the null hypothesis of no serial correlation and the null hypothesis of no ARCH effects cannot be rejected at a significance level of 5%. They imply that the residuals of the estimated models, including GARCH (1,1), TARCH (1,1), and EGARCH (1,1), are reasonably well behaved and adequately capture the persistence in the variance of returns.
Table 7. Estimation results of the GARCH family models for 10 Baht gold futures
In the GARCH (1,1) model, the ARCH coefficient (α1) is 0.088803, and the GARCH coefficient (β1) is 0.882633. Both coefficients are highly statistically significant at the level of 0.01. For the estimation results of TARCH (1,1) model, the estimated coefficients, α1, β1, and γ, are statistically different from zero at a significant level of 0.01. The leverage effect is significant in the TARCH (1,1) model. The reaction to positive shocks is 0.059561 and 0.132487 on negative shocks. The leverage effect is also statistically different from zero in the EGARCH (1,1) model at the 0.01 level, clearly indicating the existence of an asymmetric shock on the price volatility of 10 Baht Gold Futures. The estimated coefficients, α1 and β1, are also statistically significant at the level of 0.01. Since the sign of γ is negative, the ARCH effect of 0.247294 for negative shocks is larger than the ARCH effect of 0.146052 for positive shocks.
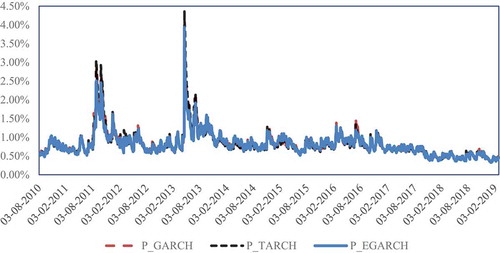
Based on the GARCH family models, including GARCH (1,1), TARCH (1,1), and EGARCH (1,1), the coefficient of GD dummy is shown to be negative and significant at the level of 0.01. This result indicates that Gold-D coming into market significantly reduces 10 Baht Gold Futures price volatility. The launch of Gold Online Futures into 10 Baht Gold Futures market also has a negative impact on its price volatility, but the effect is not statistically significant. In Figure , we also plot the predicted volatility of 10 Baht Gold Futures from the GARCH family models. It shows that the estimated volatility of GARCH (1,1) is very close to the estimated volatility of TARCH (1,1) and EGARCH (1,1). However, the TARCH (1,1) model is found as the best fitting model in modelling 10 Baht Gold Futures price volatility since it provides the lowest values of Akaike Information Criterion (AIC) and Schwarz Criterion (SC).
Figure 4. Price volatility of 10 baht gold futures predicted using GARCH family models.
6. Conclusions
This study investigates the effect of new gold derivatives products, Gold-D and Gold Online Futures, on the price volatility of 50 Baht Gold Futures and 10 Baht Gold Futures using the following GARCH family models: GARCH (1,1), TARCH (1,1), and EGARCH (1,1) models. Among all three models, TARCH (1,1) is found to be the best fitting model to estimate the price volatility of 50 Baht Gold Futures and 10 Baht Gold Futures. There is the presence of leverage effect on 50 Baht Gold Futures and 10 Baht Gold Futures markets. Bad news increases the volatility more than good news. Introducing new gold futures contracts, Gold-D and Gold Online Futures, lowers levels of the price volatility of the existing contracts, although the results are statistically significant only in the case of Gold-D.
These results are important for both regulatory authority and market participants. It suggests regulatory authority to lower the level of margin requirements for the related futures contracts, along with the issuance of new derivatives products. For market participants, speculators may find it is less beneficial to trade in existing futures contracts as lower volatility implies lower short-term profit opportunities. On the other hand, hedger should adjust their positions in existing futures contracts according to volatility changes.
Acknowledgements
The author acknowledges financial support from Department of Economics, Kasetsart University.
Additional information
Funding
Notes on contributors
Woradee Jongadsayakul
Woradee Jongadsayakul is an associate professor of economics at Kasetsart University, Bangkok, Thailand. She received her B.B.A. in finance from Chulalongkorn University (Bangkok, Thailand) in 1999, M.F. from Saint Louis University (Missouri, USA) in 2001, M.A. in economics from University of Colorado at Boulder (Colorado, USA) in 2003, and Ph.D. in economics from University of Colorado at Boulder (Colorado, USA) in 2006. Her teaching and research interests are in business economics, financial risk management, and industrial organization. Her recent research focuses on Thai gold derivatives market and developing models for understanding and characterizing gold futures price volatility.
References
- Bin, W., & Wen, L. (2014). Analysis on the effect of new futures contract coming into market: Taking the related metal futures in SHFE for example. 2nd International Conference on Information Technology and Quantitative Management (ITQM 2014). https://doi.org/10.1016/j.procs.2014.05.258
- Bollerslev, T. (1986). Generalized autoregressive conditional heteroscedasticity. Journal of Econometrics, 31(3), 307–14. https://doi.org/10.1016/0304-4076(86)90063-1
- Daal, E., Farhat, J., & Wei, P. (2006). Does futures exhibit maturity effect? New evidence from an extensive set of US and foreign futures contracts. Review of Financial Economics, 15(2), 113–128. https://doi.org/10.1016/j.rfe.2005.03.001
- Daigler, R. T., & Wiley, M. K. (1999). The impact of trader type on the futures volatility-volume relation. Journal of Finance, 54(6), 2297–2316. https://doi.org/10.1111/0022-1082.00189
- Duong, H. N., & Kalev, P. S. (2008). The Samuelson hypothesis in futures markets: An analysis using intraday data. Journal of Banking & Finance, 32(4), 489–500. https://doi.org/10.1016/j.jbankfin.2007.06.011
- Engle, R. F. (1982). Autoregressive conditional heteroscedasticity with estimates of the variance of United Kingdom inflation. Econometrica, 50(4), 987–1007. https://doi.org/10.2307/1912773
- Feng, W., & Chuan-zhe, L. (2008). Determinants of the volatility of futures markets price returns: the case of chinese wheat futures. 2008 International Conference on Management Science and Engineering 15th Annual Conference Proceedings. https://doi.org/10.1109/ICMSE.2008.4668988
- Glosten, L. R., Jagannathan, R., & Runkle, D. E. (1993). On the relation between the expected value and the volatility of the nominal excess return on stocks. Journal of Finance, 48(5), 1779–1801. https://doi.org/10.1111/j.1540-6261.1993.tb05128.x
- Jongadsayakul, W. (2014a), Determinants of the crude oil futures price volatility: The case of Thailand futures exchange. Proceedings of 52nd Kasetsart University Annual Conference: Education, Economics and Business Administration, Humanities and Social Science. https://kukr.lib.ku.ac.th/db/index.php?/BKN/search_detail/result/13745
- Jongadsayakul, W. (2014b). Determinants of the gold futures price volatility: The case of Thailand futures exchange. Applied Economics Journal, 21 (1), 59–78. http://www.journal.eco.ku.ac.th/upload/document/thai/20140613111613.pdf
- Jongadsayakul, W. (2015). Determinants of silver futures price volatility: Evidence from the Thailand futures exchange. International Journal of Business and Finance Research, 9 (4), 81–87. http://www.theibfr2.com/RePEc/ibf/ijbfre/ijbfr-v9n4-2015/IJBFR-V9N4-2015-7.pdf
- Kadioğlu, E., Kɪlɪç, S., & Öcal, N. (2016). Determinants of price volatility of futures contracts: Evidence from an emerging market. Journal of Applied Finance & Banking, 6 (2), 103–115. http://www.scienpress.com/Upload/JAFB%2fVol%206_2_7.pdf
- Karali, B., Dorfman, J. H., & Thurman, W. N. (2009). Does futures price volatility differ across delivery horizon. Proceedings of the NCCC-134 Conference on Applied Commodity Price Analysis, Forecasting, and Market Risk Management. http://ageconsearch.umn.edu/record/53036/files/confp02-09.pdf
- Karali, B., & Thurman, W. N. (2010). Components of grain futures price volatility. Journal of Agricultural and Resource Economics, 35 (2), 167–182. http://ageconsearch.umn.edu/record/93205/files/JARE_Aug2010__01_pp167-182.pdf
- Kuo, W.-H., Hsu, H., & Chiang, C.-Y. (2005). Price volatility, trading activity and market depth: Evidence from Taiwan and Singapore Taiwan stock index futures markets. Asia Pacific Management Review, 10 (1), 131–143. https://pdfs.semanticscholar.org/b097/3e72d4702c0fab1a7516bdd5d279e2565ce8.pdf
- Madarassy Akin, R. (2003), Maturity effects in futures markets: evidence from eleven financial futures markets. UC Santa Cruz Economics Working Paper No. 03-6. https://www.escholarship.org/uc/item/1n04g31b.pdf;origin=repeccitec
- Nelson, D. B. (1991). Conditional heteroskedasticity in asset returns: A new approach. Econometrica, 59(2), 347–370. https://doi.org/10.2307/2938260
- Pati, P. C. (2006). Maturity and volume effects on the volatility: evidences from NSE fifty futures. 10th Capital Markets Conference, Indian Institute of Capital Markets Paper. https://doi.org/http://dx.doi.10.2139/ssrn.962319
- Ripple, R. D., & Moosa, I. A. (2009). The effects of maturity, trading volume, and open interest on crude oil futures price range-based volatility. Global Finance Journal, 20(3), 209–219. https://doi.org/10.1016/j.gfj.2009.06.001
- Samuelson, P. A. (1965). Proof that properly anticipated prices fluctuate randomly. Industrial Management Review, 6(2), 41–49. https://doi.org/10.1142/9789814566926_0002
- Xin, Y., Chen, G., & Firth, M. (2005). The determinants of price volatility in China’s commodity futures markets. China Accounting and Finance Review, 7(1), 24–145. http://hdl.handle.net/10397/60080
- Zakoian, J. M. (1990). Threshold heteroskedastic model. Journal of Economic Dynamics and Control, 18(5), 931–955. https://doi.org/10.1016/0165-1889(94)90039-6