
 ?Mathematical formulae have been encoded as MathML and are displayed in this HTML version using MathJax in order to improve their display. Uncheck the box to turn MathJax off. This feature requires Javascript. Click on a formula to zoom.
Abstract
This work built on financial literature on rolling window Granger-causality testing (RWGCT) methodology, specifically expanding its early theme of speculative trading which emerged in 2009 following the food price crisis. Although many times driving the commodity prices in reality, the unexpected often remains unexplained in equilibrium modelling. Financial speculation is a distinct, unexpected phenomenon which allows us to determine temporal order of affecting market forces in equilibrium dynamics. A logical framework retraces price and quantity adjustment directions from underlying speculative demand or supply curve shifts; using it, we extracted these shifts with RWGCT from the price and arrival quantity data of Delhi potato wholesale markets. The main results confirmed the framework, more speculation was detected on demand side compared to supply side. The food price crises of 2007–2009 and 2011–2012 saw most demand-side speculation, as financial liquidity poured also to potato markets, whereas supply-side speculation was most likely detected due to unexpectedness related to approaching harvest or its aftermath when considerably supply becomes available, and thus also greater potential gains from timing sales.
PUBLIC INTEREST STATEMENT
This paper makes use of the rolling window Granger-causality testing (RWGCT) to detect speculation in financial time series. Trader speculation increases price fluctuation and overshooting which harms potato supply in India and in developing countries more generally. Easing potato supply would have positive effects for developing country urban conditions; curbing food price speculation would also improve particularly the profits of the poor farmers who often lack means of transport and post-harvest storage and thus have to sell their produce at low prices to better-positioned middlemen.
1. Introduction
Markets of finance attract interest in abundance and various specialist consensuses exist on factors affecting commodity prices. The research often constructs supply and demand equations for equilibrium model estimation, but quantifying temporally locations and persistence of these assumed impacts is hard. Partly the limits to estimation are due to complex interactions present in real world, requiring considerable consideration and wisdom of hindsight on anomalies to successfully model in econometrics as trade periods, areas, and items differ in characteristics. The likely reason for mixed evidence on a general theory of how prices are influenced by changing supply- and demand-side factors is often stated by adherents of the rolling window estimation; the relations between variables are not stable but variable in time. This paper describes in its introductory part how these complexities handicap equilibrium estimates particularly in the potato scene and then proceeds to illustrate how the rolling window Granger-causality testing (RWGCT) detects speculation in the equilibrium dynamics.
The main objective of the paper is to present a methodology, together with empirical data-driven results, for spotting periods of financial speculation from current high-frequency time series. The paper also aims to elicit discussion on the role of supporting statistical tests in choosing parameters for RWGCT, particularly as such tests penalise for lag length but are myopic to time which is needed for real-world market adjustments; this paradox results in overweight of low-frequency studies in published literature as the use of high-frequency series, which improves on accuracy, needs greater lag length for the same reaction time. The work contributes by proposing a general RWGCT framework for detecting speculation as a distinct economic phenomenon from unexpected shifts in supply and demand as they appear in competitive markets. Its empirical contribution is in detectable speculative action in the market studied, particularly in detecting food crises as major periods where demand side initiated speculative buying action. The results also imply that the Delhi wholesale market for potatoes is competitive, fitting into the framework which used RWGCT to detect supply- and demand-side speculation.
2. Potato supply and demand in India: few links to world markets
According to Timmer (Citation2009, p. 14), in the short-run, price driving unexpectedness tends to be due to the supply-side behaviour for commodities for which inventory data are reasonably reliable, whereas commodities with poor data on inventories due to millions of small agents (farmers, traders, consumers) tend to have their price behaviour generated by rapidly changing price expectations themselves, with dishoarding and hoarding of the commodity. Although in commodity price and storage research the potato attracts little attention, we can reasonably expect that in developing countries generally—also in India—it belongs to the latter classification with unexpectedness in the short-run coming from both supply and demand sides. Even with all ongoing short-run action, the supply and demand for the potato is particularly local compared to many other food articles, which favours analytical frameworks for a single marketplace, such as RWGCT of prices and arrival quantities undertaken in this study. Also, when viewed from another angle, concerns on realism have surfaced with increasingly occurring applications of world market hypothesis to potato trade: “IMPACT model used [...] in the Global Futures Project incorporates the assumption of single world market for this commodity which is characterized by perfect price transmission and in which all country level prices are determined by a single world market price. Understandably we were somewhat unhappy with this assumption.” (Kleinwechter & Suarez, Citation2013), and while continuing to analyse actual trade flows the study further notes: “India’s trade is to a large extent limited to the island states of the Indian Ocean”. For example, potato price in Finland (Jalonoja & Pietola, Citation2001) can hardly affect India due to institutional and competitive constraints, and the instability of Indian potato markets (Scott & Suarez, Citation2011, Citation2012). Thus also, as the IMPACT version used in potato supply and demand assessment for India (Scott et al., Citation2019a, Citation2019b) unhesitatingly connected with its system of equations to global trade 159 production land areas, not only Finland, great redundancy in potato trade route parameters ensued. More equilibrium modelling assumes parameters, even if the model is true, more likely are empirical problems due to collinearity, or by chance, some of the variables affecting others due to their statistical data properties only, consequently biasing and diluting true effects. Such concerns are too often ignored, particularly where results confirm general beliefs of the profession. It would be prudent to at least differentiate between developed and developing countries due to their differing economic structures, especially touching the cross-border trade of the bulky and perishable potato (Imai et al., Citation2017; Morshed, Citation2007; Prakash, Citation2008; Salmensuu, Citation2021; Scott, Citation2002), although no model that assumes a stable relationship between two variables can capture temporal connections between the variables, even though such are part of larger market chain consequences that lead to equilibria in market consisting of all goods and whole interconnected world (Timmer, Citation2009, p. 20).
2.1. Potato prices in Delhi
Much-emphasised rural-urban migration unlikely solves developing country problems without agricultural revival (Christiaensen et al., Citation2011; Haggblade & Hazell, Citation1989; Imai et al., Citation2017; de Janvry & Sadoulet, Citation2010; Johnston & Mellor, Citation1961; Rehman et al., Citation2016). Affordable year-round supply of potatoes to urban centres is a major aid to the poor and also instrumental for the success of continued urbanisation, such as occurred naturally, particularly during the 19th and 20th centuries in western temperate countries usually without preconceived administrative intentions, or through potato orientated agricultural planning such as recent times in China have now seen. Common to many developing countries, however, potato prices in India exhibit wide seasonal price fluctuation; ensuing price risk is a notable cost to potato dealers, resulting in high consumer prices. Price fluctuation also directly deters potato cultivation as poor producers, being constrained in means of storage and transport, are forced to sell at low prices.
The monthly potato report of the Indian government diagrammatically presents, of all the listed state-wise wholesale statistics, only Delhi prices and arrivals alongside whole India averages, underlining centrality of this marketplace. Still, despite their importance and data availability, studies concentrating on Delhi potato prices are relatively rare. Complementing price forecasting developments (Chandran & Pandey, Citation2007; Salmensuu, Citation2018), the present study contributes to price behaviour analysis through locating speculation in price series by RWGCT. The capital city area observes weaker marketing efficiency and slower areal price integration (Dahiya et al., Citation2002; Salmensuu, Citation2017) comparing to other Indian potato markets, which invites speculation and price overshooting, and ensuing political unrest. In addition to speculation in potato prices, onion prices are causing concern in India. Concerning these two vegetables of great political interest, the potato markets may be assumed to be competitive where hoarding and other speculative periods are received from the hands of millions independent agents, acting as a herd, whereas the onion markets are known for their high degree of cartelisation and price manipulation aimed to prevent entry of new players into the network (Fuglie, Citation1999; Madaan et al., Citation2019). Comparing results of this study to reactions by policy-makers to speculation as covered by media, at least in regard to statistical significance, buffer stock policies appear promising in quieting demand-side speculation in potato prices (PTI, Citation2015).
2.2. Detecting speculation
In addition to instability of how and when variables are affecting each other, a distinct phenomenon for financial commodities blurs the matter further, i.e. speculative trading, which can move the variables farther from their natural relations. Rather than the forces of demand and supply bringing inevitably equilibrium price and quantity levels, in speculative trading environments the norm is breaking away from such equilibria. The study of temporal effects by RWGCT is gaining popularity nowadays in many financial applications. Its use format basically follows attempts in Robles et al. (Citation2009) and Timmer (Citation2009) to locate food price speculation due to other markets by inspecting how variable linkages evolve in time based on rolling Granger-test p-values. This methodology of graphical recognising and inference has thereafter also found non-agricultural implementations in modified forms using various interrelations between currency, commodity, stock and housing markets, energy and other consumption, national outputs (Aye et al., Citation2014; Chen et al., Citation2018; Fernandez-Perez et al., Citation2017; Tsai, Citation2019), etc. Much of this later literature replaces standard assumptions of asymptotic distributions with residual bootstrap techniques that may alleviate biases in small samples. Diminishing window (=sample) size is, at its best, still a trade-off that is aiming to possible gains in result representativeness at costs to test accuracy. Loss of accuracy is seen particularly from inflated significance limits; most of published RWGCT literature now uses low-frequency data, monthly or quarterly, and 10% significance, doubling the usual 5% limit. The availability of high-frequency data allows us to retain a high degree of accuracy, still representativeness in calender time matching above low-frequency studies. Continuing on the food price speculation theme, we preserve its earlier specifications, presentation techniques, and the common F-test methodology.
In this paper we develop a tool based on RWGCT for locating from time-series data approximate phases of speculative, unexpectedly occurring supply or demand shifts and for assessing their persistence in a commodity market having otherwise characteristic conditions of perfect competition that is often assumed for market models. Perfect competition provides structure that separates unexpected from expected concerning supply and demand movements. To improve our chances in detecting these short-run effects, this research is benefiting from daily data including arrival quantities, which provide a clearly distinguishable supply side. These modifications considerably aid RWGCT inference as we study the market forces behind the potato price formation in the very short run. How speculation as a distinct economic phenomenon can be used as a tool to detect unexpected supply or demand shifts is a notable difference to earlier RWGCT research that likewise built on the idea of spotting recognisable linkages from test result graphs. The methodological tool is likely useful in various markets for establishing similar causal evidence behind equilibrium adjustment mechanisms. Here, our actual results contribute foremost to the evaluation of local risks for potato wholesale dealers by locating speculation in time-series. Paying attention to and acting on potato price speculation is a little touched structural issue, which extends ramifications beyond dealers’ potato marketing risks through the price system also to other levels; notably to consumer prices and potato use in urban centres, which is a time-tested key to successful urbanisation, and also to farm gate prices, affecting potato supply and partaking of the producers to profits. The research meets on-going needs, as many governments struggle with urbanisation issues and particularly the Indian government now aims at reducing agricultural poverty by doubling farmer profits by 2022, before the end of its 5-year term.
3. Data
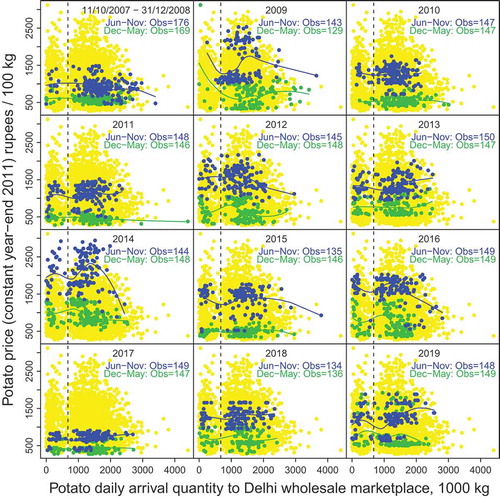
The wholesale potato market data came from the National Horticulture Board of India (NHB). It contains daily fresh potato modal price quotations in Delhi wholesale marketplace from 11 October 2007, until 31 December 2019, and their corresponding arrival quantities. These series allow visually exploring statistical causalities between arrival quantity and price at particular time intervals. Four data points were removed due to apparent typing errors. All remaining price outliers lie in the interval of reported daily minimum and maximum. The price series was adjusted with Indian wholesale price index inflation. Figure scatter plots the data. Typically, arrival quantity is 1000–2000 metric tons of potatoes in a trading day and a gap exists at about 600–800 tons, dividing arrival quantities into two clusters, separated by a vertical dashed line. The trading points are either equilibrium points or gradual adjustment points, before new equilibria, after some specific supply or demand schedule changes. An example with discussion of such adjustments follows in connection of Figure . The most important supply-related change is seasonal; the supply of potatoes in India is highest and prices lowest due to the main harvest. For illustration, the data set is split annually to its usual high-price and low-price seasons, June–November versus other months, i.e. January–May and December, respectively. Their loess curves in Figure visualize that the price may stay markedly stable with regard to changes in the arrival quantity, but these two can also associate with a change to same or opposite direction.
Figure 1. Cross-plots of potato arrival quantities and prices and seasonal loess curves
The time series of price and arrival quantity appear alongside RWGCT results (Figure ). Arrival quantities display notable variation whereas prices are generally more stable, comparing adjacent days. A notable arrival quantity change from the previous day usually brings no notable immediate price change or vice versa, implying that an adjustment lag exists. RWGCT inference in this paper is also validated by this observation, that fluctuation in arrival quantities causes trading parties no distress, as it supports perfect knowledge that is part of the perfect competition assumption. The earlier daily frequency RWGCT study (Timmer, Citation2009) used 15 days lag length and 6 months fixed rolling window size, and similarly we will have 15 trading days lag, and 150 trading days fixed window size which corresponds to approximately 6 months throughout our data. Spuriously statistically significant results due to overfitting occur in Granger-causality testing increasingly likely smaller the sample size. Nevertheless, researchers selecting lag lengths often use information criteria carrying penalty for lags, such as BIC and AIC, which leads to lag lengths of two and three being common in literature (Bruns & Stern, Citation2019). This tendency in turn favours using low-frequency data and small sample sizes since the information criteria also make no distinction between frequency, e.g. whether data points occur hourly or monthly. This problem restricts studies in finance and other fields rich in high-frequency data, the information criteria are simply myopic to needed real-time adjustment lengths in potato markets in India. An early warning system needed 2–3 weeks of data for its over 60% accuracy in classifying between whether hoarding or weather affected prices, whereas forecasting accuracy still remained below 70% beyond few weeks when potato already requires cold storage (Madaan et al., Citation2019). It seems natural to use a real lag which approximately corresponds to Indian conditions and perishing of potato stocks without cold storage (Fuglie, Citation1999; Madaan et al., Citation2019) together with sensitivity analysis, acknowledging that adjusting reactions in physical markets are rarely immediate but require some time. The selected window size corresponds to maximal storage time of up to 5–6 months in India (Wustman et al., Citation2011; Madaan et al., Citation2019, the latter study also uses 6-month validation periods for anomaly detection). ADF testing rejects the unit root null hypothesis for both price and arrival quantity series even at 1% risk level using the chosen lag length. We therefore conclude that both series are stationary.
4. Methods
4.1. Supply and demand adjustments in speculative trading
Plenty of research on trading of financial assets exists. Literature, particularly on causality, price discovery and price–volume relationship for stock and housing markets, is wide and its methods numerous. In stock markets, price is often leading volume. In housing markets, where prices are more rigid especially downwards, the opposite is true (Narayan & Smyth, Citation2015; Tsai, Citation2018, Citation2019). This paper presents a tool based on RWGCT for understanding how equilibria are disturbed in speculative trading environments and how new market equilibria are consequently reached. Comparing to Timmer (Citation2009), the early attempt to locate food price speculation by RWGCT of prices between various markets, we choose instead, in addition to prices, a direct measure of supply, i.e. arrival quantities. The logic behind this choice is simple and Tsai (Citation2019) is closely related by applying RWGCT between American average housing prices and transaction volume. We use particular characteristics of NHB data to improve on general price–volume relationship assumptions; here arrival quantity is not only information on market conditions, it is actual supply that enters the market. Similarly to many other markets, potato wholesale sellers decide on the quantities that are sent to Delhi marketplace, or their speed, i.e. quantity per some time unit. And buyers correspondingly decide on the amount of money they bring to purchase potatoes. It is rather obvious that buyers are unable to directly influence the speed of arriving potatoes to the marketplace, but instead through lower or higher price bidding they signal changes in their demand. Similarly sellers have no direct influence on money or purchasing power directed to the market in question, but they can only decide their supply for the prevailing price level in markets of perfect competition. These market conditions should allow us to separate supply-led speculation from demand-led speculation by considering whether price or quantity was first-moving in processes leading to new price-quantity equilibria. Speculators enter the trade looking to profit from uncertain price action. Separating supply and demand sides is essential; sellers are on average closer to producer role compared to buyers. A producer is normally unable to sell his supplies speculatively in advance whereas a buyer may speculate by hoarding as price rises on a harvest delay.
Figure 2. Speculating on a supply (S) decrease, demand shifts from to
with price-quantity adjustment following broad arrows. Narrow arrows depict return to normal demand with or without the supply shift leftward that buyers anticipated.Footnote1
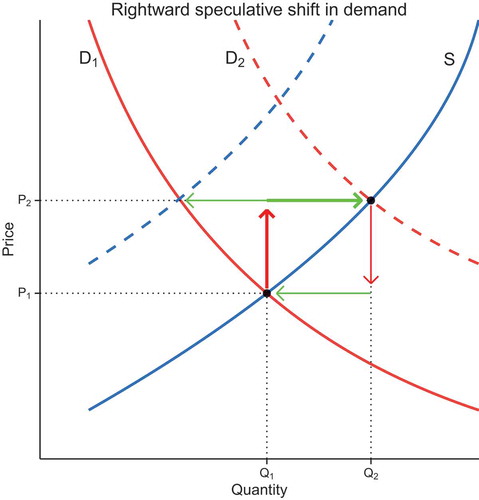
In Figure , anticipating a supply decrease from S to the dashed blue curve, the buyers speculatively bid higher prices for their demanded quantities, and thus the demand shifts from to its speculative level, the dashed red curve
. Through this move speculative buyers receive potatoes at increased quantity and at a price that is still below their near future expected price. Price, that buyers can directly influence with their purchasing power, moves first in speculation, and quantity, that sellers by their possessions directly influence, then rationally adjusts to it, as depicted by the broad arrows, red and green. Speculators as a group are looking to resell the commodity. Exceptions exist. Some market participants on the buying side speculatively hasten or delay their intended purchase, similarly as sellers in the supply chain do hasten or delay their intended sale, but on aggregate we are justified in looking at buyer speculation by considering what happens when buyers succeed or fail to exit the trade with a profit. Optimally buyers succeed in reselling as their anticipated supply decrease materialises following the narrow green arrow at price
. Speculatively changed demand is of temporary nature. It will return to its original position as speculative buying no longer supports it. This return to normal does manifest itself in weakening of buying power, thus no longer supporting trade at
, the speculative equilibrium of greater price and quantity. In this weakening of speculative demand, price changes first and quantity then adjusts to it. The speculators who failed to exit their trades and are still looking for a suitable moment to resell the commodity face losses, depending on their individual entry and exit timing, but eventually the old equilibrium
ensues as depicted by the narrow red and green arrows in Figure .
Above example of Figure presents the most prevalent type of potato market speculation in India, i.e. potato price tends to go up when harvesting period is over and the commodity is hoarded expecting better prices, as recognised by trader agencies and research (Wustman et al., Citation2011, several other sources present without origin a similar list of Indian potato market affecting factors). Speculatively anticipating this seasonal supply decrease and its resulting price rise presents potential for hoarding profit even several fold of the original investment in a few months. This type of speculation appears most prevalent also in our present study, marked by blue-coloured dots of detected demand-side speculation, in the price and arrival quantity series of Figure in the Results section.
Buyers anticipating a supply shift rightward and the two cases of supply-side speculation where sellers anticipate a demand shift are similar in their basic construct, merely requiring a little care for economic logic in modifications; only contrary to direction of Figure arrows, supply-side speculation, being initiated by sellers, changes first quantity and then price. Noticeably, first-moving quantity change of a speculative supply shift may be retraced if speculators succeed in anticipating an upcoming demand shift. In Figure example, the anticipated supply curve is found in the same general direction where also first-moving price changes—upwards—whereas when quantity moves first, in case of supply-side speculation, it moves opposite the direction of an anticipated demand shift. This difference, derivable from asymmetry of market forces, makes lagged detecting of anticipatory supply-side speculation harder compared to demand-side speculation. Trivially, also simply note that speculative demand can anticipate real demand changes and similarly speculative supply can anticipate real supply changes. Also, speculation may anticipate that it will be followed by late-comers. In these cases, the speculative curve simply shifts towards its anticipated position, which will also result in quantity adjustment following price change or vice versa depending on whether demand or supply moved speculatively. Although the speculators may be incorrect in their anticipation of potential shifts, rational adjustment reactions to their speculatively changed schedules still occur. Concerning non-speculative shifts to supply or demand, they remain undetectable from lagged adjustments when market participants are informed and aware of events as they happen on both sides of trading.
4.2. Model of Granger-causality
Above, we described a logical framework for speculative demand or supply changes. Their market occurrences may be tested in Granger-causality regressions (Granger, Citation1969). Rational quantity adjusting, lagging behind a speculative demand shift, becomes visible from the testing result ‘Price (Granger-causes) Arrival quantity’. Similarly, rational price adjusting, lagging behind a speculative supply shift, becomes visible from the testing result ‘Arrival quantity
Price’. Choosing a fixed time window and moving it after each estimation by one observation, until it has passed through the data from the beginning to the end, accomplishes rolling regressions between price and arrival quantity. This rolling method, RWGCT, distinguishes time periods where a variable is first-moving or lagging behind the other one. Granger-causality tests are applied to two directions for each of the rolling windows using the bivariate VAR model of EquationEquations 1
(1)
(1) and Equation2
(2)
(2) .
In these regressions is the potato price at time
, the trading day in question. Similarly,
is the potato arrival quantity at time
. Error terms
and
are uncorrelated. The number of lagged terms is denoted by
for both series, potato price and arrival quantity. This research applies rolling regressions with time window size
and lag length
.
Concerning EquationEquation 1(1)
(1) , the joint significance of
coefficients is tested by the null hypothesis
:
does not predict
if
, which implies Granger-non-causality, the lags of
do not belong into EquationEquation 1
(1)
(1) . The alternative hypothesis,
, for Granger-causality:
does predict
if
or
. (Testing the joint significance of
coefficients in EquationEquation 2
(2)
(2) has analogous hypotheses as above;
in place of
and switching places for
and
.)
F-test determines causality concerning EquationEquation 1(1)
(1) (EquationEquation 2
(2)
(2) is analogous; for it
needs to replaced with
, and
with
.) using residual sum of squares (
);
, and
,
where in the preceding denotes the error term that is received from the regression restricted not to include any terms with
coefficients, and
corresponds to the last time point used in the regression which number here
, after subtracting the lag length from the window size. We find statistical significance if the F-distributed test statistic (with m, T-2m-1 degrees of freedom),
exceeds the critical value at 5% risk level, or equivalently if p-value < 0.05; Gujarati (Citation1995, pp. 620–623), Brandt and Williams (Citation2006, pp. 32–34). We define, as Timmer (Citation2009), causality as , where
means p-value of the F-test.
Each time window regression, of either EquationEquation 1(1)
(1) or 2, or their restricted form, is a special case of linear regression. Their corresponding F-tests null hypothesise the non-significance of the predictors of interest. The test is therefore often called also Granger-non-causality. For simplified expression, this paper uses the term cause in the meaning that, in regression, inclusion of lags of the other variable does predict or Granger-cause the dependent variable. Similarly, these statistical significances in Granger testing are called demand- or supply-side speculation without always reminding of the above framework behind the thinking. We next proceed with RWGCT to answer two research questions related to EquationEquations 1
(1)
(1) and Equation2
(2)
(2) compared to their restricted forms, respectively.
1. What do time periods where potato price causes arrival quantity reveal? Are they conforming to our explanatory framework of demand-side speculation moving prices first, followed by a rational adjustment in arrival quantity? Are causal patterns linked to particular price cycle phases?
2. Similarly, does inspecting time periods where arrival quantity causes price reveal something, and is this resulting view conforming to the explanatory framework of supply-side speculation? Can patterns be linked to price cycles?
5. Results from rolling window Granger-causality tests
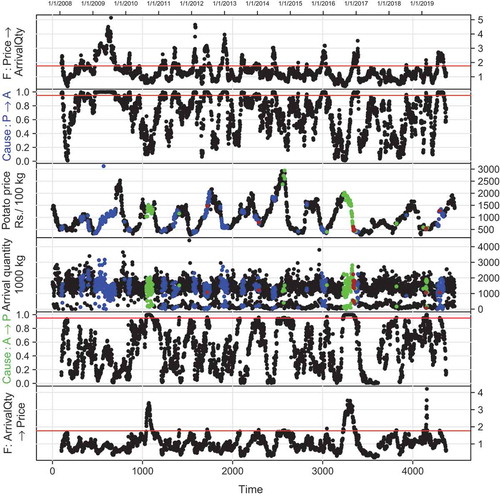
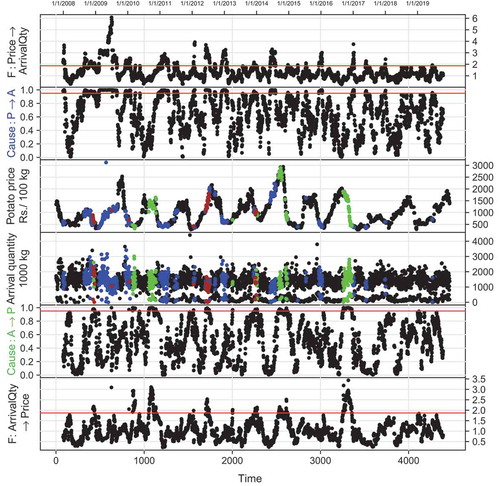
With a total of 3529 data points for both price and arrival quantity, we rolled regressions forward using fixed 150 trading days window from data beginning to end which came after 3380 windows. Each window was thus tested using 15 days lag history in two directions of causality; first from price to arrival quantity, and then from arrival quantity to price. In Methods-section we related detected causal periods to speculation, the first initiated by buyers, i.e. demand-side, and the latter by sellers on the supply side. The presentation technique for results adopted from the earlier food price speculation themed RWGCT studies, which graphed F-series (Robles et al., Citation2009, F-test statistic) and cause-series (Timmer, Citation2009, cause = one minus p-value of the F-test) against the critical value, which is 0.95 in its inverse p-value scaling; both adhered to 5% risk level. In what follows, presenting same results in these two scales is beneficial for inspecting the details above and below the critical line.
Consider RWGCT results in Figure . The uppermost of its graphs presents Granger-causality test F-statistics compared against their critical value, which is the horizontal red line. When the F-statistic of a test rises above the critical line, we reject its non-causality null hypothesis at 5% risk level, concluding for this point that it presents evidence of ‘Price causes Arrival quantity’, which is demand-side speculation by framework set in Methods. The graph next below it, the second one from above, presents the same result in inverse p-value scaling, or cause. The last two graphs of Figure present RWGCT results for ‘Arrival quantity causes Price’, which reveals supply-side speculation. The two middle graphs present prices and arrival quantities; coloured dots correspond to the middle of a rolling window that reveals speculation. As is now common in RWGCT research, each p-value corresponds to middle point of its test window. Most of the time, supporting perfect competition hypothesis, the dots remain black since the critical line remains unsurpassed. Causality from price to arrival quantity occurred in 643 tests (blue colour in Figure ) and from arrival quantity to price in 186 tests (green colour). Of these two directions, in 20 test windows both occurred, thus indicating two-ways causality (brown colour replaces blue/green). Price-leading causality thus occurred thrice as often compared to quantity-leading; even so, in Methods-section we discussed that RWGCT has difficulty at detecting all supply-side speculation.
Figure 3. Rolling tests. Potato wholesale price in constant year-end 2011 rupees Granger-causing (, blue dots) daily arrival quantity to Delhi wholesale marketplace. Reverse causality, to price from arrivals, (
) is dotted in green. Two-ways causality (
) is also dotted, but in brown, to price and arrival graphs. Parameters for window size and lag length: n = 150, m = 15.
5.1. Testing ‘price causes arrival quantity’ for demand-side speculation
As discussed in connection of Figure in Methods, RWGCT of ‘Price causes Arrival quantity’ can in a perfect competition environment reveal speculative demand shifts, affecting first price followed by rational arrival quantity adjustments by sellers on supply side. The most persistent period of demand-side speculation occurs during the 2007–2009 food price crisis. Substitute food prices increased due to increasing speculative liquidity, which also increased potato demand. Although potato price rise was modest in 2008 compared to 2009, the test results signal demand-side speculation already at early phases of the crisis; price was leading and arrival quantity kept adjusting with a lag. The 2011–2012 food price crisis pushed the F-statistic up again. The framework constructed in Methods appears correct; the food price crises intensified demand-side speculation, which is highly logical.
The cycles in causality were of special interest to Timmer (Citation2009), which influenced the presentation technique in the cause-graph. It would be particularly rewarding, here, as well as for causalities from arrival quantity to price in the lower part of Figure , to solve the connection that affects cycle changes in different years. From price to arrivals, cause-series obeys cyclical movements as does potato price. Dissimilar to potato price, whose cycles follow annual potato cropping calender, in varying years cycles in cause switch to different positions; cause seems often uncertain on the direction of its next cycle and has often several ups and downs during one potato price cycle. Still, regularity is detectable. From 2011 until 2015, the blue colour particularly clearly phases into two intervals of annual price cycle, indicating demand-side speculation. Speculation is observable at near bottom prices or early price climbing periods and then again at higher prices ahead of main harvest. Food price crisis years of 2008 and 2009 witness these intervals also although extensions in periods of detected speculation make the intervals less separable from each other. Concerning remaining years, 2010, and 2016 onwards, studying the cause-series for details below the critical line reveals causal cycles that attempt to rise towards 0.95 particularly at each early climbing and also before tumbling without always succeeding. Although it appears that two phases of causal cycle occur during a potato price cycle, the evidence remains incomplete.
5.2. Testing ‘arrival quantity causes price’ for supply-side speculation
RWGCT of ‘Arrival quantity causes Price’ reveals unexpected supply shifts from the sellers. These speculative shifts start with sellers applying a change to arrival quantity which is followed by rational price adjustment from buyers, gradually reaching the new equilibrium; detected supply-side speculation is visible in the lower part of Figure , when F- and cause-series (the bottom and the second from the bottom graphs of Figure , respectively) rise above the red horizontal critical value line. Notably, arrival quantities cause prices statistically significantly only rarely. Comparing to demand side, RWGCT is weaker to detect speculative shifts on the supply side; this limitation was discussed in Methods. Nevertheless, the test statistics moved above the red line for statistical significance a few times; particularly three times at high prices in late 2010, 2014, and 2016, and also noticeably in early 2019. This last speculative spike appears as rising highest in F-statistic at the bottommost graph of Figure and as green and then brown dots in the arrival quantity graph just above it. Perhaps also this last appearance of supply-side speculation attracted demand-side speculation, which during more tranquil time of two preceding years only shortly touched the limit for statistical evidence. On the whole, supply-side speculation should appear most likely with the availability of year-change main harvest supplies, in the wake of annually occurring price crash, as plenty of potato stock has become available and thus also greater profits from successful timing of sales. Traders are known to speculate by withholding their supply from markets particularly when they expect prices after post-harvest bottoming to soon start rising. But as speculating sellers are correct and prices soon rise, RWGCT is found weak in detecting this kind of speculation as discussed in Methods. Still we can see some green and brown at these low-price areas. Insufficient statistical evidence to confirm that seller speculation occurs every harvest period is undoubtedly due to the limits of RWGCT in detecting supply-side speculators when they succeed in anticipating upcoming demand shifts. Similarly two-way causality appears relatively rarely to detection although periods of continuing demand shifts such as food crises likely attract speculators from both sides. The supply-side speculation related cause-series appears as cyclical or counter-cyclical to price level, as was the case with demand-side speculation-related testing. Some of the cycles are comparably wider and even appear between silent periods when cause oscillates relatively low. Perhaps, after a speculative streak, which shifts the supply curve, many of the market participants become wary and prepare for its renewal. This wariness may discourage attempting similar speculation again with the next year’s harvest. The buyers may also prepare faster price adjustment to regularly occurring speculative supply-side behaviour, leading to undetectability in our statistics which extract adjustments which are lagging behind a speculative shift. This explains also why causal cycles sometimes switch direction; market participants update their behaviour based on previous experiences.
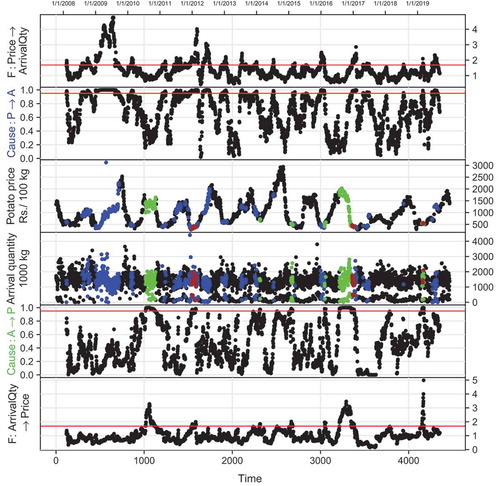
Figure 4. Rolling tests. Potato wholesale price in constant year-end 2011 rupees Granger-causing (, blue dots) daily arrival quantity to Delhi wholesale marketplace. Reverse causality, to price from arrivals, (
) is dotted in green. Two-ways causality (
) is also dotted, but in brown, to price and arrival graphs. Parameters for window size and lag length: n = 180, m = 18.
6. Robustness
A major limitation of RWGCT is generally in multiple testing issues, i.e. no correction is applied for testing adjacent, often very similar windows. When few observations shortly only touch the limit of statistical significance, refraining from offering any special interpretation on them would be conservative and good, acknowledging the multiple testing limitation. By a random chance of 1 in 20 such single visits above the limit occur. This is another aspect that speaks for robustness of our main results; they display convincing persistence and logic instead of short visitations above the statistical limit. In comparison much RWGCT literature uses even inflated 10% limit instead of 5%, and thus often makes strong inference even on solitary points of observed causality that occur with a random chance of 1 in 10. In addition, sensitivity analysis is often neglected. Strong results may be confirmed by sensitivity testing with alternative parameters. We performed sensitivity checks ( variation in window size and lag length in Figures and ) to verify Figure of the Results section.
6.1. Sensitivity checks
Instead of n = 150 window size and m = 15 lag length specification, which was presented in Figure of the Results section, Figures and run same procedures using alternative parameters. In this study, these parameters (n = 180, m = 18; n = 120, m = 12) naturally correspond to sensitivity checks for movement in both window size and lag length. Sensitivity testing confirms our main results. The overweight in detected demand-side speculation compared to supply-side speculation appears also in sensitivity testing, particularly during the food price crises, while supply-side speculation is most likely detected in the proximity of a new harvest and its supplies.
Figure 5. Rolling tests. Potato wholesale price in constant year-end 2011 rupees Granger-causing (, blue dots) daily arrival quantity to Delhi wholesale marketplace. Reverse causality, to price from arrivals, (
) is dotted in green. Two-ways causality (
) is also dotted, but in brown, to price and arrival graphs. Parameters for window size and lag length: n = 120, m = 12.
7. Discussion
In this paper, RWGCT demonstrated its capability to detect financial speculation from time-series price and quantity data and relate it to either demand or supply side, depending on whether quantity adjustment was lagging behind price change or vice versa.
7.1. Findings
Demand-side speculation was strongest during the food price crises of 2007–2009 and 2011–12. The crises attracted speculative money to food commodities, and increased their prices generally. This trade environment increased naturally also potato demand due to substitutability of food articles. Supply-side speculation was rarer and most likely detected at high prices nearing new main harvest—possibly early, unexpected shipments directed from other markets. We also detected some speculation at lower prices, which empirical result is logical and known by practice, as potato traders, according to their possibilities for storage, tend to postpone sales during post-harvest period in the anticipation of later on receiving higher prices.
Two phases of annual potato price cycle seem to be particularly linked to speculation. The first phase occurs at low prices, before major price rising, particularly as the demand-side speculators wish to enter their trades hoping to profit from price run-up, or supply-side speculators withhold from selling for same reason. The second phase of speculation occurs at near high prices or as prices start to fall, as potato buyers postpone purchases or earlier speculatively held positions are exited in the anticipation of price fall. Some of the causality that is detected at higher prices may be due to unexpected levels of inventory. Also, at price cycle top or near it, as potato storage is being emptied, unexpected shifts in supply are more likely to be responded by buyers through price adjustment immediately, which hinders the detection of speculation by the lag-based method used in this study. All in all, detecting that causal cycles clearly and continuously would be linked to potato price cycle was impossible. Rather the cycles seem to live a life of their own, likely due to continuously changing expectations that answer to speculative behaviour. Inability to establish two phases of demand-side speculation for each year up to the evidence of the critical line is no surprise; at least partial independence of the annual price level cycles from causal cycles confirms that market participants are generally expecting the elements that make price cycle; harvest supplies and post-harvest adding storage costs and running out of potatoes. A cob-web type behaviour in market participant wariness or changing expectations in response to earlier speculation likely exists. When speculation is becoming more expected at certain interval, its profit potential and temptation weakens. Also, RWGCT is weak in detecting supply-side speculation where the initiating quantity change is retraced if it is successful in anticipating demand shifting. This methodological feature also generally explains greater occurrence of demand-side speculation, compared to supply side. Demand-side speculation overweight in the results for its part indicates correctness of our prescriptions concerning temporal order of price and arrival quantity movements in Methods-section, test result inference, and that RWGCT can bring visible speculation in the wholesale potato markets in Delhi.
7.2. Comments
Comparing to the early high-frequency study on food price speculation (Timmer, Citation2009), which also detected speculative cycles of changing expectations, an important difference is that instead of linking two markets (oil, rice, currency prices), this study concentrated on a single market and data that was separable for both sides of the trade. The arrival quantity data allowed added structure to RWGCT and thus made feasible inference on supply and demand roles and their comparison to occurring potato price phases. In addition, thanks to the structure provided by the potato markets and other advantages, this study could devise some rules on the likelihood of speculation. Comparing to recent low-frequency monthly housing market studies (Tsai, Citation2018, Citation2019), where price data were paired with transaction volume bearing similarity to present research, RWGCT results are revealing markets’ conditions; economic shocks of unsteady market climate or speculation.
Perfect competition, a common assumption in market models, makes all market participants price takers. Although individual traders on both sides of the market in such environments have no power for market manipulation, they may and often attempt to time their sales and purchases. These attempts to guess near future market movements then lead to a departure from the prevailing market equilibrium as many market participants, without any agreements made between them, either as buyers or sellers, deviate from their rationally expected roles. Speculative sellers, deviating from their rational supply schedule, can directly affect quantity of merchandise supplied to the marketplace, whereas similarly buyer speculation can through money or buying power directed to the markets affect demand only, causing speculative prices of the available merchandise. After either one, price or quantity, has speculatively changed in a shift of demand or supply, the other one, quantity or price, which is still lagging behind the first-mover, is adjusted rationally by the other side of the trade. These unexpected shifts offer the methodological basis for detecting speculation from lagged responses by RWGCT of price and quantity in perfect competition environments where a temporal lag between observed price and quantity changes is quantitatively distinguishable. The potato’s wholesale marketplace in Delhi allowed added structure, markets of perfect competition, and also provided daily arrival quantity and price data in sufficient frequency for detectability of lagged responses. These structural and data advantages benefited the framework which acted in this study as a solid basis for RWGCT inference and served for spotting instances where speculative shifts to supply and demand are at work. For selecting and testing alternative markets, similar feasibilities should be evaluated; proper parameters, variables and also nonlinear functional forms, will likely bring related knowledge on the topic of financial speculation.
For the potato in developing countries, the effects of food price speculation manifest themselves in high consumer prices but also low profits for growers who are due to lacking knowledge, capital, storage technologies and infrastructure worse positioned compared to wholesaler dealers for the business of storing and trading large quantities. Thus, although unexpected dishoarding and hoarding of the commodity by traders, which further ignites price fluctuation and overshooting, adds to both positive and negative risk of the speculators, it has often plainly detrimental effects to potato use among the urban poor and livelihood of farmers. Seller speculation aiming to profit from the usual price cycle is well known, and also buyer speculation since the opening of futures trading for potatoes has been widely discussed. Apart from allowing an added vehicle for speculators, futures trading provides an opportunity to settle prices in advance for large suppliers, which helps reduce future possibilities for price variation, thus also reducing elements which draw speculators to the potato.
For policy, partly already publicity of speculative holdings that are approximately detected through storage registers or analytical frameworks such as developed in the present study should increase adjustment efficiency, discouraging particularly harmful speculation that receives its profits from unexpectedness and lack of market efficiency. With such knowledge, also dynamic policy that directs supplies of food or buying power to markets where prices are in a speculative state becomes an option. It appears that policies planning for buffer stocks to counter speculation in Delhi potato prices discouraged demand-side speculation as less of its evidence is detectable, i.e. blue-coloured dots which mark visits above the limit of statistical significance in Figure , in a few years since their media reporting (PTI, Citation2015). Knowledge and actions which for their part lower risks in potato holding and its middleman margins hold the promise of greater supply of affordable potatoes to retail consumers also in urban Delhi and a greater share of potato income to its producers.
correction
This article has been republished with minor changes. These changes do not impact the academic content of the article.
Acknowledgements
The initial version of this paper was presented 24.4.2013 at Seminar of Statistics, University of Eastern Finland (UEF), Joensuu, Finland. The event was hosted by Lecturer Esko Valtonen. Thanks to all participants for comments and advice. The initial results were presented 4.6.2013 at the Mini-Symposium of Economic Development, UEF, Joensuu, Finland. Thanks to all participants, especially to Prof K.R.G. Nair, Dr Alia Dannenberg and to the host of the event Adj Prof Matti Estola for comments and advice. Thanks for guidance in development of this paper to Prof Mikael Lindén and Prof Lauri Mehtätalo, and to Dr Antti Rautiainen for his commentary and helping hand. Thanks to anonymous referees for all comments.
Additional information
Funding
Notes on contributors
Olli Salmensuu
The author is finalising his PhD thesis in economics as an early-stage researcher at University of Eastern Finland (UEF). His research concentrates on potato prices in developing countries. He has previously worked as a researcher doing statistical programming at the Finnish Forest Research Institute (Metla, 2013–2014), statistician at UEF (2016), and as a specialist in economic and labour policy at the Blue parliamentary group (in the Finnish government coalition, 2017–2019).
Notes
1. There are helpful internet resources (pages accessed 11.9.2019) for drawing such figures; http://stats.stackexchange.com/questions/380772/supply-and-demand-graphs-in-r/380797 directed my attention to http://www.andrewheiss.com/blog/2017/09/15/create-supply-and-demand-economics-curves-with-ggplot2 that provided code for the graphics, with some alterations.
References
- Aye, G. C., Balcilar, M., Bosch, A., & Gupta, R. (2014). Housing and the business cycle in South Africa. Journal of Policy Modeling, 36(3), 471–17. https://doi.org/10.1016/j.jpolmod.2014.03.001
- Brandt, P. T., & Williams, J. T. (2006) Multiple time series models (A Sage University Paper). Vol. 148: Sage Publications.
- Bruns, S. B., & Stern, D. I. (2019). Lag length selection and p-hacking in Granger-causality testing: Prevalence and performance of meta-regression models. Empirical Economics, 56(3), 797–830. https://doi.org/10.1007/s00181-018-1446-3
- Chandran, K. P., & Pandey, N. K. (2007). Potato price forecasting using seasonal ARIMA approach. Potato Journal, 34(1-2), 137–138. http://epubs.icar.org.in/ejournal/index.php/PotatoJ/article/view/33141
- Chen, Y., Mantegna, R. N., Pantelous, A. A., & Zuev, K. M. (2018). A dynamic analysis of S&P 500, FTSE 100 and EURO STOXX 50 indices under different exchange rates. PLoS ONE, 13(3). https://doi.org/10.1371/journal.pone.0194067
- Christiaensen, L., Demery, L., & Kuhl, J. (2011). The (evolving) role of agriculture in poverty reduction: An empirical perspective. Journal of Development Economics, 96(2), 239–254. https://doi.org/10.1016/j.jdeveco.2010.10.006
- Dahiya, P. S., Srinivas, K., & Pandey, N. K. (2002) “Economic analysis of potato prices and marketing efficiency in three principal terminal markets in India,” in S. M. P. Khurana, G. S. Shekhawat, S. K. Pandey, & B. P. Singh eds. Potato, global research & development. Proceedings of the global conference on Potato, (Vol. 2, pp. 1212–1217). New Delhi, India, 6-11 December, 1999.
- de Janvry, A., & Sadoulet, E. (2010). Agricultural growth and poverty reduction: Additional evidence. The World Bank Research Observer, 25(1), 1–20. https://doi.org/10.1093/wbro/lkp015
- Fernandez-Perez, A., Frijns, B., & Tourani-Rad, A. (2017). Precious metals, oil and the exchange rate: Contemporaneous spillovers. Applied Economics, 49(38), 3863–3879. https://doi.org/10.1080/00036846.2016.1270416
- Fuglie, K. O. (1999). Economics of potato storage: Case studies. Symposium on Potato storage, processing and marketing, at the global conference on potato. New Delhi, India, 7-9 December, 1999.
- Granger, C. W. J. (1969). Investigating causal relations by econometric models and cross-spectral methods. Econometrica, 37(3), 424–438. https://doi.org/10.2307/1912791
- Gujarati, D. N. (1995). Basic econometrics (3rd ed.). McGraw Hill.
- Haggblade, S., & Hazell, P. (1989). Agricultural technology and farm-nonfarm growth linkages. Agricultural Economics, 3(4), 345–364. https://www.sciencedirect.com/science/article/abs/pii/016951508990008X
- Imai, K. S., Cheng, W., & Raghav, G. (2017). Dynamic and long-term linkages among agricultural and non-agricultural growth, inequality and poverty in developing countries. International Review of Applied Economics, 31(3), 318–338. https://doi.org/10.1080/02692171.2016.1249833
- Jalonoja, K., & Pietola, K. (2001). Whole sales market for fresh potatoes in Finland. Agricultural and Food Science in Finland, 10(2), 69–80. https://doi.org/10.23986/afsci.5687
- Johnston, B. F., & Mellor, J. W. (1961). The role of agriculture in economic development. American Economic Review, 51(4), 566–593. https://www.jstor.org/stable/1812786
- Kleinwechter, U., & Suarez, V. (2013). Really a nontraded commodity? A look at the international trade network (dataset and R code). Retrieved 20 June 2019, from https://perspectivesandforesight.wordpress.com/2012/11/08/really-a-nontraded-commodity-a-look-at-the-international-potato-trade-network
- Madaan, L., Sharma, A., Khandelwal, P., Goel, S., Singla, P., & Seth, A. (2019). Price forecasting & anomaly detection for agricultural commodities in India. COMPASS ’19, July 3-5, 2019. Accra, Ghana.
- Morshed, A. K. M. M. (2007). Is there really a “border effect”? Journal of International Money and Finance, 26(7), 1229–1238. https://doi.org/10.1016/j.jimonfin.2007.06.002
- Narayan, S., & Smyth, R. (2015). The financial econometrics of price discovery and predictability. International Review of Financial Analysis, 42(C), 380–393. https://doi.org/10.1016/j.irfa.2015.09.003
- Prakash, A. (2008). The global potato economy (FAO International Year of the Potato factsheet). Food and Agriculture Organization of the United Nations (FAO). http://www.fao.org/potato-2008/en/potato/economy.html
- PTI. (2015). Centre plans potato, onion buffer stock to check price rise. Press Trust of India (PTI). Bennett, Coleman & Co. Ltd. Retrieved 7 July 2020, from https://economictimes.indiatimes.com/news/economy/agriculture/centre-plans-potato-onion-buffer-stock-to-check-price-rise/articleshow/45841213.cms
- Rehman, A., Jingdong, L., Khatoon, R., Iqbal, M. S., & Hussain, I. (2016). Effect of agricultural growth on poverty reduction, its importance and suggestions. Transylvanian Review, 24(5), 449–453. https://transylvanianreviewjournal.org/index.php/TR/article/view/306
- Robles, M., Torero, M., & vonBraun, J. (2009). When speculation matters (International Food Policy Research Institute (IFPRI) Issue Brief 57). International Food Policy Research Institute.
- Salmensuu, O. (2017). A potato market integration analysis for India: Speculation in Delhi slows price integration. Review of Market Integration, 9(3), 111–138. https://doi.org/10.1177/0974929217744657
- Salmensuu, O. (2018). Potato price forecasts in Delhi retail from Bayesian regime switching. Advances and Applications in Statistics, 53(6), 731–770. https://doi.org/10.17654/AS053060731
- Salmensuu, O. (2021). Macroeconomic trends and factors of production affecting potato producer prices in developing countries. The Journal of Developing Areas, 55(1). , 91-105. https://doi.org/10.1353/jda.2021.0008
- Scott, G. (2002). Maps, models, and muddles: World trends and patterns in potato revisited. Potato Research, 45(1), 45–77. https://doi.org/10.1007/BF02732218
- Scott, G. J., Petsakos, A., & Juarez, H. (2019a). Climate change, food security, and future scenarios for potato production in India to 2030. Food Security, 11(1), 43–56. https://doi.org/10.1007/s12571-019-00897-z
- Scott, G. J., Petsakos, A., & Suarez, V. (2019b). Not by bread alone: Estimating potato demand in India in 2030. Potato Research, 62(3), 281–304. https://doi.org/10.1007/s11540-019-9411-x
- Scott, G. J., & Suarez, V. (2011). Growth rates for potato in India and their implications for industry. Potato Journal, 38(2), 100–112. https://hdl.handle.net/10568/67711
- Scott, G. J., & Suarez, V. (2012). The rise of Asia as the centre of global potato production and some implications for industry. Potato Journal, 39(1), 1–22. https://hdl.handle.net/10568/66527
- Timmer, P. C. (2009). Did speculation affect world rice prices? (FAO - ESA Working paper No. 09-07). Agricultural and Development Economics Division of the Food and Agriculture Organization of the United Nations.
- Tsai, I.-C. (2018). Information content of transaction volume: The housing market in the United Kingdom. International Journal of Strategic Property Management, 22(5), 348–357. https://doi.org/10.3846/ijspm.2018.5219
- Tsai, I.-C. (2019). Dynamic price-volume causality in the American housing market: A signal of market conditions. North American Journal of Economics and Finance, 48(C), 385–400. https://doi.org/10.1016/j.najef.2019.03.010
- Wustman, R., Haverkort, A., Zhang, X., & Rathee, G. (2011). An overview of the potato sector in India and prospects of Indo-Dutch cooperation. Applied Plant Research. Unit Arable Farming, Multifunctional Agriculture and Field Production of Vegetables.