?Mathematical formulae have been encoded as MathML and are displayed in this HTML version using MathJax in order to improve their display. Uncheck the box to turn MathJax off. This feature requires Javascript. Click on a formula to zoom.
Abstract
This study examines the convergence in military expenditure and economic growth for a panel of 35 African countries between 1990 and 2015. We employ the Phillips and Sul methodology to achieve our objective. Overall, the results at Africa level reveal no evidence of convergence in military expenditure and growth. However, after robustness tests, the final club classification results do support the hypothesis of club convergence for the two variables. The results of the analysis show that there exist: (i) two convergence clubs for military expenditure; and (ii) five convergence clubs for growth. The empirical findings further suggest that the Regional Economic Communities (RECs) form distinct convergent and divergent clubs, exhibiting considerable heterogeneity in the underlying defence and growth patterns. In addition, the empirics confirm that the countries in each region appear to have chosen dissimilar defence and growth transition paths. The policy implications are discussed in the concluding section of this study.
Public interest statement
Convergence of military expenditure implies that countries which initially allocate a smaller share of national income to defence will catch up with the countries that initially allocate a bigger share of national income to defence. Convergence of growth is the hypothesis that the per capita income of poorer economies will tend to grow at faster rates than richer economies. In this article, we examine the convergence in military expenditure and economic growth in Africa and its regional economic communities (RECs) based on economic, defence, and security cooperation amongst them. Overall, the results at Africa level reveal no evidence of convergence in military expenditure and growth, while the RECs form distinct convergent and divergent clubs. The findings in this study will help African policymakers to identify diverging countries and recommend policies that facilitate their convergence in terms of defence spending and growth.
1. Introduction
Since the seminal work of Solow (Citation1956) and Swan (Citation1956) on economic convergence, other studies like Barro et al. (Citation1991) and Barro and Sala-i-Martin (Citation1992) have also dealt with the issue. In their Barro et al. (Citation1991), Barro & Sala-i-Martin (Citation1992) focused on the concepts of β- and σ-convergence. These concepts paved the way for D. Quah (Citation1993), Carlino and Mills (Citation1993), Bernard and Durlauf (Citation1995), and Evans (Citation1998) to seriously question the econometric validity of these concepts. This is because on the one hand, the neoclassical economists believe that the real GDP per capita of countries should converge over time once the diversities in economic structures such as population growth rates, savings rates, depreciation rates, etc., are incorporated into the model (Solow, Citation1956; Swan, Citation1956). To better approximate the data, scholars like Mankiw et al. (Citation1992) have tried to modify the Solow-Swan model by introducing the role of human capital, and this was found to provide a better fit for the data. On the other hand, authors such as D. Quah (Citation1993), Quah (Citation1996), Citation1997) argue that countries do converge in real GDP per capita, but only within clubs of countries which have relatively similar characteristics. Based on this, the study seeks to know whether the hypothesis of African countries converging into clubs is plausible, by using a convergence club algorithm.
Empirical investigation into the defence-growth nexus and other macroeconomic variables has attracted considerable attention and debate by researchers, yet without reaching a robust consensus (inter alia: Dunne & Smith, Citation2010; Alptekin & Levine, Citation2012; Dunne & Tian, Citation2013 ; Heo & Ye, Citation2016; Saba & Ngepah, Citation2018; Saba & Ngepah, Citation2019a, Citation2019b; Saba & Ngepah, Citation2019c; Kollias & Paleologou, Citation2019). While there are continuing theoretical and empirical studies on this nexus, little is known about the convergence in Africa’s military expenditure (henceforth MILEX) and economic growth (henceforth, EG). Despite this, some studies have nevertheless investigated the convergence of economic growth, and the dynamics of prices, policies, income, interest rates, globalisation, inflation and public expenditure across groups of economies (inter alia: Akhmedjonov & Lau, Citation2012; Akhmedjonov et al., Citation2013; Kasman et al., Citation2005: Suvankulov et al., Citation2012). To the best of our knowledge, only a limited number of previous studies ̶ including those of Soler I Lecha (Citation2010), Arvanitidis et al. (Citation2014), Arvanitidis and Kollias (Citation2016), Lau et al. (Citation2016), Arvanitidis and Kollias (Citation2016, Citation2017), Güri̇ş et al. (Citation2017), and Solarin (Citation2019) ̶ investigate the convergence of military spending.
The estimation strategies mainly used by the previous studies include the conventional unit root convergence and cointegration tests methods, which have been found to be incapable of dealing with problems such as heterogeneity or unique transition patterns across different countries, sectors, states or regions. In order to overcome these estimation problems, we thus applied the club convergence test developed by Phillips and Sul (Citation2007, Citation2009) to 35 African countries between 1990 and 2015, to investigate the club convergence of real GDP per capita (proxy for economic growth) as well as the convergence of MILEX. Therefore, this study attempts to fill this gap in the existing literature by using the methodological approach developed by Phillips and Sul (Citation2007, Citation2009) which helps to overcome the econometric problems associated with previous studies in testing for convergence. A further contribution of the study is that it uses SIPRI’s new consistent dataset since the post-cold war on MILEX (Perlo-Freeman, Citation2017; Perlo-Freeman & Sköns, Citation2016). This is because it allows scholars in the field of defence and peace economics to obtain more reliable, consistent and robust empirical results, inferences and conclusions over a long time period, as recent studies addressing various aspects of MILEX have done (inter alia: d’Agostino et al., Citation2017; Kollias et al., Citation2017; Malizard, Citation2016).
A glance through the existing literature shows that studies related to the topic at hand have shed some light on various aspects, with different results and conclusions. However, an investigative study that analyses the club convergence in MILEX and EG over a period of 26 years (1990–2015) is yet to be done for Africa. Therefore, we are eager to know not only the club convergence in MILEX and EG, but also to graphically demonstrate whether African countries display similar patterns or behaviours in their transition paths. The empirical results and analysis of this study will help in policy recommendation for African countries. The study is relevant because: (i) inferences from testing the convergence of MILEX at Africa and RECs level can help determine whether a target set for the defence series, especially MILEX, is achievable, given the guns and butter associated with MILEX; (ii) it enables us to know whether idiosyncratic country-specific factors could be the reason behind the differences in MILEX across the African RECs; (iii) theoretically, the existence of convergence in MILEX is evidence that the theory of a security web introduced by Rosh (Citation1988) exists in a particular continent/region. The concept of a security web refers to when a country usually sees other, neighbouring countries as threats. Thus, any increase (or decrease) in the MILEX of neighbouring countries will influence the MILEX of a country.
The 35 African countries were further disaggregated into eight regional groupings in order to assess their defence-growth, convergence clubs and transition paths. Africa’s Regional Economic CommunitiesFootnote1 (RECs) include eight sub-regional bodies, which are the building blocks of the African Economic Community. They were established in the 1991 Abuja Treaty and provide the overarching framework for continental economic integration. Africa’s RECs not only constitute key building blocks for economic integration in order to promote growth and development in Africa, but are also key actors working in collaboration with the African Union (AU), in ensuring peace, security and stability through defence cooperation. The aims and objectives of regional integration in Africa are, among others, to promote political, defence and economic cooperation. The seminal work of the Economic Commission for Africa (ECA) (2006) identified the different purposes driving the African countries to join the RECs within the continent. While these objectives varied from country to country, and the weight ascribed to each also varied across countries, the growth and defence goals were key to each REC member. Thus, the desire to promote growth or defence dynamics through integration is not only common across the countries, but the weight prescribed to it tends to be significant. Given the economic growth and security challenges facing the countries, it is therefore not surprising that theoretical and empirical discourse presents regional integration as a possible catalyst for growth/income and defence convergence. This is due to it being based on a framework that has both poor and relatively rich countries cooperating, so that the poor countries will gradually reach the level of growth already attained by the richer countries that they are cooperating with. Europe is a good example and a realistic case study of how this cooperation can lead to the development of poor countries. In Africa, despite some progress in economic integration, has this led to growth and military expenditure convergence? This is a critical question that this study seeks to address. Studies of growth/income and defence spending convergence for the African continent are few, and so far, there are very few that are specific to the continent’s various African RECs. An earlier study of Ghura and Hadjimichael (Citation1996) finds that there is evidence of conditional convergence of per capita income in the group of 29 sub-Saharan African (SSA) countries during the period 1981–1992, while McCoskey (Citation2002) utilizes time series’ stochastic convergence based on 37 countries and claims that the lack of convergence in sub-Saharan Africa might be due to the huge intra- and inter-regional differences among the countries considered.
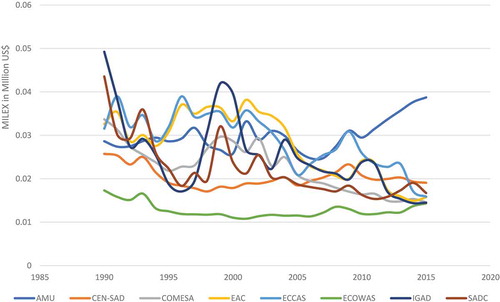
below shows a comparative 26-year average performance of each Africa’s RECs real GDP per capita. The trends for span the period between 1990 and 2015. The graphs show that AMU is leading other regions in terms of growth, followed by SADC, CEN-SAD, COMESA, ECOWAS, ECCAS, IGAD and EAC. This shows that the growth experience in each REC differs from one another, and further provides an insight into how each region has been performing economically. below also shows the average trends in military expenditure as a percentage share of GDP in each of the eight African RECs for the period 1990–2015. A visual inspection of the graphs shows that the ECOWAS region has the lowest spending among all the regions. AMU’s spending increased steadily from 2007 to 2015. IGAD had the highest spending in 1990, and then started to decrease steadily until 2015. One of the possible reasons that could be attributed to the rise in MILEX of AMU could be the recent social and political crisis in the region that has impeded the process of peace, security and stability in Tunisia and Libya, and to a lesser extent in Morocco. The rest of the regions have experienced both upward and downward trends in spending. The graphs below give some insight into how MILEX has evolved in the regions between 1990 and 2015.
In each region, African governments’ response to security challenges could have been the possible reasons behind the fluctuations in military spending. This is because a number of Africa regions are characterized by insecurity caused by the following: activities and threats of insurgency and rebel groups (such as Al Shabaab, Seleka, the White Army, anti-Balaka, Boko Haram, the Lord’s Resistance Army (LRA), etc.); the rise of piracy; internal and border wars/conflicts; emerging regional arms races; and the desire of some authoritarian governments to secure their grip on power. These insurgent groups cause conflicts which play out differently in African countries, thereby exhibiting cross-border dimensions. In this study, the reason for classifying the countries into their respective regional groupings and testing for club convergence include: (i) increasingly, national security strategies have started to recognize that nations cannot provide for their own security without also developing/contributing to the defence and security of their regional and international context (Bush, Citation2002); (ii) African RECs have a degree of defence and economic cooperation elements in their respective treaties, due to the multifaceted defence and economic challenges facing them; (iii) convergence clubs are useful in comparing and inspecting a region’s development with reference to other regions (or identifying groups of countries within each region that converge to different equilibria, allowing individual countries to diverge); (iv) with all these groups, we can identify the similarities or differences between countries within RECs, making it easier to either generalise or make specific inferences (Bernard & Durlauf, Citation1995). Finally, the reasons why the African RECs that do not belong to any convergence group have diverged can be identified, thereby enabling us to shed more light on the factors behind the similarities or differences in MILEX and economic growth among the RECs.
This paper is structured as follows: the introduction is followed by a literature review in section two. Section three explains the econometric methodology of Phillips and Sul (Citation2007, Citation2009), while the empirical results and discussion are presented for Africa and RECs in sections four and five, respectively. Finally, section six concludes the paper.
2. Literature review
The existing empirical literature that has so far considered the macroeconomic convergence and the nexus between MILEX and EG are mixed in their findings and conclusions. Therefore, the issues of real income convergence and the relationship between MILEX and EG among countries and across regions thus remains highly controversial. This section is divided into a brief review of empirical studies on real GDP/real GDP per capita/income convergence from different regions of the world, and the empirical findings concerning the convergence in the defence spending/burden.
2.1. Empirical studies on real GDP/real GDP per capita/income convergence
In the literature, the most cited scholars on the subject matter under investigation are Barro and Sala-i-Martin (Barro et al., Citation1991; Barro & Sala-i-Martin, Citation1992), although, economic convergence or divergence is derived from the neoclassical growth model, originating with Solow (Citation1956). Since the seminal paper of Solow (Citation1956), theoretical and applied studies on convergence of per capita real income have continued. Despite the large number of studies, different measurements, assessments, and econometric methodologies of convergence differ among scholars in the literature, with many conceptual and statistical problems. Although much empirical work exists, the convergence debate has continued. Income convergence as a theoretical concept is related to neoclassical growth theory, according to which income between units converges as long as structural characteristics are the same, regardless of the initial level of income and capital stock. Baumol (Citation1986), Barro and Sala-i-Martin (Citation1992), Mankiw et al. (Citation1992), and Islam (Citation1995) remain the notable scholars among others, who have contributed to the methodological landmarks that helped in translating the Solow model into an empirical test for convergence.
Initial empirical tests of the convergence hypothesis implement β-convergence tests, where researchers estimate the growth rate of per capita real income on an initial value of real per capita income with or without other conditioning variables. β-convergence provides a suitable testing method for convergence within an economy, but Binder and Pesaran (Citation1999) questioned the adequacy of it in the case of a stochastic technological progress. Nevertheless, the Barro and Sala-i-Martin (Citation1992) study before Binder and Pesaran (Citation1999) questioning, examines the convergence of gross income for 92 countries. Their results indicate convergence only if the determinant factors of the steady-state income remain constant. In another important study, Mankiw et al. (Citation1992) use a cross-sectional methodology for 98 countries and conclude that conditional convergence exists, controlling for population growth and capital accumulation. Islam (Citation1995) employs panel estimation techniques to test for convergence in terms of per capita real income. He also concludes that conditional convergence exists for per capita real income. According to σ-convergence, a group of economies converges if the cross-sectional variance of the per capita output declines across time. Friedman (Citation1992), and Cannon and Duck (Citation2000) propose regression specifications to test for σ-convergence. But this was also criticised in the way that σ-convergence provides a necessary, but not sufficient, ingredient for observing reductions in real per capita income dispersion (Friedman, Citation1992; D. Quah, Citation1993). In the literature, researchers define club convergence as the tendency of output per capita of economies to converge to multiple steady-state equilibria, one for each basin of attraction, which depends on initial conditions. Studies that have contributed to the development of this method include Galor (Citation1996), Canova (Citation2004), P.C. Phillips and Sul (Citation2003), and Phillips & Sul (Citation2007, Citation2009). A number of empirical studies on economic growth adopt the nonlinear time-varying Phillips and Sul (Citation2007, Citation2009)) factor model to determine convergence clubs; these include Apergis et al. (Citation2010), Fritsche and Kuzin (Citation2011), Bartkowska and Riedl (Citation2012), Monfort et al. (Citation2013), Borsi and Metiu (Citation2015), and Von Lyncker and Thoennessen (Citation2017) among others, while other studies have adopted different approaches.
Sala-i-Martin (Citation1996) analyses β- and σ-convergence in real income per capita for 90 regions spanning eight European countries between 1950 and 1990, and finds that regional incomes converge at a moderate speed. In contrast, Ramajo et al. (Citation2008) estimate the speed of convergence for a sample of 163 EU regions over the period 1981–1996. Their results provide further evidence in support of separate spatial convergence clubs, where the regions in the EU cohesion fund countries (Ireland, Greece, Portugal, and Spain) are found to converge faster than the rest of the regions. The aggregate macroeconomic evidence has likewise led to mixed results. Cuaresma Crespo et al. (Citation2008) assess β-convergence in per capita real GDP between 1960 and 1998 for the EU-15 and show that EU membership significantly improves the degree of economic integration and long-term growth. They further argue that the positive effect of EU membership on growth is relatively higher for poorer countries. Von Lyncker and Thoennessen (Citation2017) investigate club convergence in income per capita in 194 European NUTS-2 regions using a nonlinear, time-varying factor model that allows for individual and transitional heterogeneity. The study extends the existing club clustering algorithm with two post-clustering merging algorithms that finalise club formation. They also apply an ordered response model to assess the role of initial and structural conditions, as well as geographic factors. Their results indicate the presence of four convergence clubs in the EU-15 countries. To support the club convergence hypothesis, their study finds that initial conditions matter for the resulting income distribution. Diop (Citation2002) uses β- and σ-convergence to analyse nominal and real convergence of economies of the Economic Community of West African States (ECOWAS). The study establishes that there is an absence of real convergence of the zone’s economies in which nominal convergence has experienced success. In this way, over the entire period analysed, nominal convergence did not lead to real convergence in ECOWAS countries. When limited to WAEMU member countries, the author finds per capita GDP convergence. He explains these differences in results by those in mobility of factors, diversification of production in the economies, and price and wage flexibility. Hammouda et al. (Citation2009) analyse income convergence in African regional economic communities based on three kinds of convergence: β-, σ- and conditional convergence. The study uses the methodology described by Caselli et al. (Citation1996). Based on empirical analysis using African countries’ data, the study presents evidence that there has been little progress in income convergence in Africa. The study shows that despite the importance of regional integration, there has been limited progress, and prospects for the African integration process are not as promising as would be expected for such an important pillar in Africa’s development agenda.
2.2. Empirical studies on convergence in defence spending/burden
Theoretically, military expenditure can promote as well as impede economic growth through three main channels: the supply, demand, and security channels (Churchill & Yew, Citation2018; Dunne et al., Citation2005). The supply channel deals with the opportunity cost associated with military expenditure (such as the crowding-out effect, adverse balance of payments, and distortions), and the spillover effect of military expenditure (such as the development of new technology and infrastructure by the military sector that benefits the private sector). The demand channel proposes that military expenditure increases aggregate demand, employment, and capital utilisation through the Keynesian multiplier effect. On the other hand, the security channel stresses the importance of military expenditure in providing security for the nation from both internal and external threats (Dunne et al., Citation2005). On the empirical side, studies on MILEX convergence in the empirical literature are limited. However, recent studies like those of Arvanitidis et al. (Citation2014), Arvanitidis and Kollias (Citation2016), Lau et al. (Citation2016), and Arvanitidis et al. (Citation2017) consider this important subject matter for investigation. For example, Arvanitidis et al. (Citation2014) investigate the convergence in defence burdens at the international level. The study uses σ-convergence and β-convergence techniques, with a sample of 128 countries spanning 1988–2008. The overall findings support the process of convergence in defence burdens internationally. The Arvanitidis and Kollias (Citation2016) study builds on the published findings of Arvanitidis et al. (Citation2014) to further investigate the convergence of defence burdens by taking into consideration both the Cold and post-Cold War periods for 86 countries between 1970 and 2015. The study uses β-convergence and the club convergence (proposed by Baumol and Wolff (Citation1988)) to achieve its objective. The findings of the study show that there is convergence in the defence burdens for the 86 countries. Arvanitidis et al. (Citation2017) use the β and σ-convergence, and Markov chain methodologies to examine the convergence of defence policy in the NATO alliance. The findings of this study suggest that there is evidence of a defence policy convergence process within the sample period of the study.
Lau et al. (Citation2016) investigate the convergence of MILEX for 37 countries between 1988 and 2012 by using a nonlinear cross-sectionally augmented Dickey-Fuller (NCADF) technique. The regression results show that 22% of the countries converge to the USA; 39% converge to Germany; 33% converge to China; 11% converge to Russia; and 53% converge to the world’s average MILEX. Conversely, Güri̇ş et al. (Citation2017) utilise linear and nonlinear unit root tests to investigate the convergence hypothesis of MILEX for NATO countries for the period 1953 to 2014. The findings of the study show that the MILEX of Germany, Greece, Portugal, the UK, and Luxembourg converges to the NATO mean, while the rest of the member states diverge. Solarin (Citation2019) examines the convergence of military burdens in the Asia-Pacific countries. The study adopts a two-step method for both stochastic and beta convergence with the use of datasets from both the Stockholm International Peace Research Institute (SIPRI) and the World Military Expenditures and Arms Transfers (WMEAT). The results of the study suggest a weak convergence in military burdens of the region. This finding differs from the few existing studies in the empirical literature that have provided strong evidence of convergence for the region.
The few empirical studies that have examined the convergence of MILEX suggest the following: firstly, none of the foregoing studies has used the methodological approach proposed by Phillips and Sul (Citation2007, Citation2009) to examine the club convergence of MILEX and economic growth for Africa and its RECs. Secondly, the post-Cold War dataset of SIPRI has not been used to test the club convergence of military expenditure for African countries in the existing studies. Lastly, the previous studies have not focused attention on Africa, hence, this study.
3. Methodology and data
This study utilises the methodological approach proposed by Phillips and Sul (Citation2007, Citation2009) because of the following advantages it has over other methodological approaches. First, it does not have specific assumptions on the stationarity of the variables and/or the presence of common factors are necessary. Second, it is based on a general form of nonlinear time-varying factor models. Third, it assimilates the possibilities of transition heterogeneity or transition divergence. Fourth, it helps to identify the existence of club convergence or clusters in which different convergence paths can be distinguished among heterogeneous economies involved in a convergence process. In this section, we briefly discuss and explain the different steps involved in executing the clustering algorithm that allows us to classify African countries into different convergent or divergent clubs.
3.1. Log t convergence test
Phillips and Sul (Citation2007) propose log which is decomposed into two parts, one common factor,
, and the other, idiosyncratic factor loading
and this also absorbs the error terms
. Both the common factor (
) and idiosyncratic factor loading (
) are time-varying. The
determines both the common MILEX and growth path according to the relation:
The above formulation enables us to test whether the factor loading converge or not. To accomplish this, Phillips and Sul (Citation2007) constructed the panel relative transition coefficient/parameter,
, as:
which helps in measuring the coefficient of factor loading in respect to the panel average of the transition path for the economy i. The relative transition curves portray the relative transition coefficients
, estimated from Equationequation (2)
(2)
(2) . Convergence implies that an individual unit approaches the sample average over time. Therefore, the following holds:
From Equationequations 3(3)
(3) , Equation4
(4)
(4) and Equation5
(5)
(5) , to account for possible nonstationary panel transition behaviour which may be caused by the decrease in the cross-sectional variance of a sample even when there is no panel convergence and only local convergence within certain subgroups, Phillips and Sul (Citation2007) for this course propose the following semiparametric specification of
:
where is the time-invariant part of the country-specific factor loading
, L(t) is a slowly varying increasing function (with
,
is the decay rate (i.e., the speed of convergence), and
is a weakly autocorrelated random error variable (
is iid(0,1)). Based on the time-varying factor presentation in Equationequation (1)
(1)
(1) , Phillips and Sul proposed a convergence test and clustering algorithm based on the log
convergence test that is based on a simple time-series regression involving a one-sided t-test. In the framework, the null hypothesis is as follows:
The testing procedure involves the following three steps.
1. Calculation of the cross-sectional variance ratio
(from EquationEquation 5)
(5)
(5) .
2. Estimation of the following OLS regression:
3. One-side t test for using
(
and HAC standard error. g (g ∈ (0, 1)) is a truncation parameter that shortens the regression by a certain fraction of the first observations. Monte Carlo simulations by Phillips and Sul (Citation2007) suggest the use of g = 0.3 and L(t) = log t for samples up to T = 26. Given the assumptions outlined by Phillips and Sul (Citation2007), the standard critical values can be applied such that the null hypothesis of convergence is rejected at the 5% level if
.
3.2. Club clustering/convergence algorithm
The log t test is rejected for samples that do not converge overall. Phillips and Sul (Citation2007) developed a club clustering algorithm to detect both convergence clubs and diverging regions, countries or sectors. The algorithm consists of the following four steps:
Step 1 (Last Observation Ordering): We order the member of the panel according to the last observation, since evidence of convergence will, in general, be most apparent in the recent years. However, in the case of substantial time-series volatility in , the ordering of the series can be done based on time-series averages of the final observations. In our study, the first approach will be used.
Step 2 (Core Group Formation): We try to identify a core group of countries that provide strong evidence of convergence. Specifically, we estimate a sequence of regression using the
highest members (Step 1) for all different values of
(i.e
). We choose the regression that generates the maximum convergence t-statistic
(where
so that convergence is ensured for the corresponding group). The corresponding group forms the core convergence group.
Step 3 (Club Membership): We now evaluate each individual country not included in the core convergence group (Step 2) for membership in this group. More in detail, we add one country at a time and calculate the convergence t-statistic from the regression. The new country (member) satisfies the membership condition if the associated t-statistic is greater than a chosen critical value
(i.e
). All countries that satisfy the membership condition are added to the core convergence group. Finally, we check whether the whole group (i.e. the members of the initial core group and the additional selected members) satisfies the criterion for convergence.
Step 4 (Recursion and Stopping): We run the regression for all the countries for which
in the previous step. If the null hypothesis is not rejected, therefore these countries will form a second convergence club. But in case it is rejected, we repeat steps 1–3 on the remaining countries to determine whether the group itself can be subdivided into convergence clusters. If there is no
in step 2 for which
, we conclude that the remaining countries display a divergent behaviour.
3.3. Club merging algorithm (robustness test)
The analysis of this study is further complemented with the application of the Phillips and Sul (Citation2009) test of club merging in order to ensure the robustness of our results for both MILEX and economic growth of the regions under investigation. This is because Phillips and Sul (Citation2009) argue that their convergence club methodology tends to overestimate the number of clubs than their true number. To avoid this overestimation, they run the algorithm across the sub-clubs to assess whether there is any evidence that exists in support of merging clubs into larger clubs. Since the steps highlighted above enable one to identify cluster algorithm formations with all possible configurations, that is, panel convergence, panel divergence, converging subgroups and single diverging units. Given that Phillips and Sul (Citation2007) recommended conservative values of the critical value c in step 3 of section 3.3, in particular c = 0, in order to reduce the risk of including a false member into a convergence group, the clustering procedure becomes also conservative, i.e. there is a tendency to find more convergence clubs than the true number. For this reason, Phillips and Sul (Citation2009) propose convergence testing between convergence clubs, too. If the null is not rejected, the corresponding clubs can be merged into a larger club. For this purpose, we consider another formulation of the alternative hypothesis apart from the one given in the above section in EquationEquation 7(7)
(7) (i.e
):
Where the number of individuals and
aggregates to N.
This can also be extended to the case of multiple clubs. The relative transition coefficient is then defined as:
and:
For all , 1 and
, and we finally arrive at a log t regression model of the form of EquationEquation 8
(8)
(8) . Where
represent
;
represent
; and
represent
used in EquationEquation 7
(7)
(7) .
Applying the above procedure helps us to test the club convergence or divergence of MILEX and EG. There are few missing data at some point in the data set for military expenditure variable for Benin, Côte d’Ivoire, Mali, Zambia, and Zimbabwe. But we corrected it by using the projection linear trend extrapolation of matching known data points for least squares method and moving average interpolation procedure for missing data in between two data points. These techniques have proven to be far better than mean imputation and it has been applied in studies by Besley and Burgess (Citation2003), Kalwij and Verschoor (Citation2007), and David (Citation2019), Saba and Ngepah (Citation2019a, Citation2019b). The dataset of MILEX and EG is transformed into logarithmic values and the variables can be found in Table . The list of selected African countries and Africa's RECs can be found in Table and Table respectively in the appendix.
4. Continental empirical results and discussion
This section presents the empirical results and a discussion at the Africa level. Table shows that the log t test applied to the full panel suggests that the null hypothesis of overall convergence is rejected for MILEX, since the t-value for the variable is less than −1.65. Thus, we performed the Phillips and Sul (Citation2007) club clustering procedure. Table reports the summary results for the club merging clustering algorithm. Three clubs can be identified, and they all converge. Given that the t-value for the variable is greater than −1.65, the club merging algorithm and the merging algorithm for diverging or converging countries led to the amalgamation of the convergence clubs. Therefore, Table shows the final club classification for MILEX. The results of the club merging and final club classifications are also reported in Table . There is evidence of sub-clubs for the MILEX variable, which is the reason for including the club merging algorithm results for it. The empirical findings show that for all the convergence clubs, there is evidence to support mergers of the initial clubs (in Table ). We merged clubs 1 and 2 since the t-statistic: 1.498 is greater than the 5% critical value: −1.65. Therefore, the null hypothesis of merging convergence clubs is accepted at the 5% significance level. We could not merge club 2 and 3 since the t-statistic: −12.270 is less than the 5% critical value: −1.65. Therefore, the null hypothesis of merging convergence clubs is rejected at the 5% significance level. After merging, our final club classification is two, as against the initial three. The results of the final club classification show that countries in club 1 and 2 are converging, since the t-statistics (1.498 and 6.313) for both clubs are greater than the 5% critical value: −1.65. Therefore, the null hypothesis of club convergence for the final club classification is accepted at the 5% significance level for both club 1 and 2. The divergence of the full sample implies that there are military spending gaps among African countries. These gaps could result from the different reasons that African countries demand for military spending, even though the primary aim of defence spending is to provide national security. Sometimes these gaps could depend on the mix of military capabilities necessary to meet peacetime crises and long-term competition criteria. However, an assessment of this mix is difficult to perform.
Table 1. Dataset
Table 2. Military expenditure results
Table 3. Final club convergence results (club merging) for military expenditure
The divergence of the panel could be an indicator of African countries not fully committing to pursuing and achieving their respective defence aims and objectives. This is because resources that are committed to defence in relation to other sectors, especially health and education, are not yielding the optimal desired results in Africa. This is particularly true of states with meager resources. The seminal contributions of Smith (Citation1980, Citation1989)) have shown that several factors could be responsible for the levels of resources allocated to defence sectors. These include external as well as domestic security considerations, economic constraints, strategic aspirations, and the ideological and political orientation of the incumbent governments (inter alia: Bove & Brauner, Citation2016; Douch & Solomon, Citation2016; Dunne & Perlo-Freeman, Citation2003; Dunne et al., Citation2008; Pamp & Thurner, Citation2017). Thus, any of these factors could contribute to the divergence of the full sample, since African countries are not immune to any of them. The results for club 1 and 2 imply that African countries can still be grouped into clubs that exhibit some degree of convergence, despite the full sample divergence. This means that African governments are still making efforts to effectively utilise resources allocated to the defence sector. Given that military expenditure as a percentage share of GDP represents the resources allocated by countries for the implementation of national defence policies and programmes, the panel findings of this study could temporarily be interpreted as indicating a process of policy divergence for African countries, while the club convergence findings show that some African countries could possibly still have some elements of similar characteristics in defence policies and programmes. The findings could also possibly mirror the emergence of “diverging” security challenges faced by African countries and hence drive them towards the adoption of divergent defence policies, given the economic constraints that they face. The results obtained in this section could be a possible strong argument for the need for defence cooperation at African regional levels. The existence of convergence is evidence that the concept of a security web introduced by Rosh (Citation1988) exists in a region. But in the case of this study, the absence of panel convergence of MILEX implies that the concept of a security web does not exist. This is indeed true because not all countries in Africa see their neighbouring countries as threats. Thus, any increase (or decrease) in the defence indicators, including the defence burden of neighbouring countries, may not necessarily influence the MILEX of such countries, while the presence of club convergence implies that the security web concept introduced by Rosh (Citation1988) now holds. This is because some countries see their neighbouring/allied countries as threats to their national security.
Figures and below show the relative MILEX transition paths of African countries within their respective clubs. The transition path is given by the relative transition coefficient as defined in EquationEquation 2
(2)
(2) . The transition curves report a graphical picture about the tendency of the cluster participants (or groups of clusters) to converge or diverge from above or below 1, which is the convergence path reference point. Visual inspection of these curves enables us to gain some insight into the outcomes of the testing methodology and monitor the MILEX course for each country relative to the sample average, with respect to MILEX. In summary, Figure illustrates the relative transition curves for MILEX of countries in club 1. The countries in club 1, which is the largest club with 25 countries, exhibit lesser convergence within their club, as indicated by relatively time-constant transition paths. Figure illustrates the transition paths for MILEX of countries in club 2. The countries in club 2, which is the smallest club, with 10 countries, exhibit greater convergence within their club, as indicated by the relatively time-constant transition paths.
Figure 1. Military Expenditure Transitional Curves for club 1
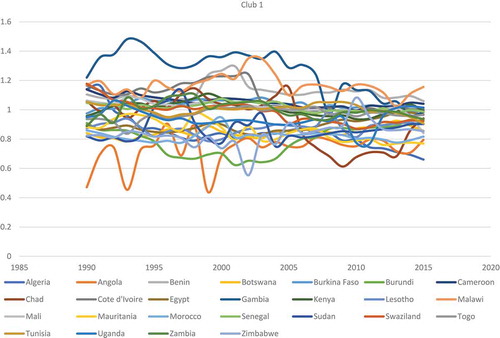
Figure 2. Military Expenditure Transitional Curves for club 2
Transition Paths for Military Expenditure at Africa Level:
Table reports the results of the panel convergence methodology for the real GDP per capita (proxy for economic growth (EG)). Columns 3 and 5 of Table show the results of the full convergence log t test (i.e. convergence among all sample countries and the club clustering algorithm), and the t-statistics. As the third and fifth columns in Table indicate, the null hypothesis of full convergence is rejected at the 5% significance level for the period under scrutiny. Specifically, the point estimate of is −0.677 (t-statistic: −45.328) for the period. This result is in line with the Apergis et al. (Citation2010), and Apergis et al. (Citation2012) studies. The results of the club clustering algorithm reported in Table further show that six convergent clubs are formed, comprising all countries except Burundi, which is in the seventh club. We also did a robustness test for economic growth in order to avoid overestimation of the number of clubs being more than their true number (Phillips & Sul, Citation2009). The results of the club merging and final club classifications are reported in Table for EG. There is evidence to merge clubs for the EG variable, and that is why the results for the merging algorithm of clubs are reported in Table . The interpretation of the results follows the same rule of thumb as explained in the methodological section. The results of the final club classification show that countries in club 1, 3 and 4 are converging, since the t-statistics (18.139, 0.051 and 6.274) for the clubs are greater than the 5% critical value: −1.65. Therefore, the null hypothesis of club convergence for the final club classification is accepted at the 5% significance level for clubs 1, 3, and 4, respectively. The sign on the point estimate suggests a positive speed of adjustment for countries in club 1, 3, and 4 (i.e. club 1 =
= 0.507∕2; club 3 =
= 0.002∕2; club 4 =
= 1.037∕2), indicating strong convergence over the time period. We find evidence of convergence for countries in club 2. Therefore, null hypothesis of convergence is accepted (
= −1.288>-1.65), indicating that EG converges at the same steady rate for countries in club 2. The sign on the point estimate suggests a negative speed of adjustment for countries in club 2 (i.e.
= −0.063∕2), indicating weak convergence over the time period.
Table 4. Economic growth results
Table 5. Club convergence results (club merging) for economic growth
The divergence of the full sample implies that there are EG gaps among African countries. These gaps could result from different factors that hinder growth in developing regions such as Africa. According to Ndulu et al. (Citation2007), challenges for African growth include: poor institutional capacity; poor infrastructure such as transport (roads, railways, ports, energy (renewable sources)); water and sanitation; and information and communication technology; investment; human capital; rural development; facilitation and regulation of trade-in-goods and trade-in-services (addressing tariff and non-tariff barriers and regulatory obstacles); public sector governance; and the terrorism threat. All these challenges could possibly contribute to the divergence of African countries. Given that the panel result does not follow a convergence pattern, this shows that more intense growth policies among African countries are required to facilitate a closer and faster convergence process. To this end, since convergence is not an automatic process, African countries should open their economies more widely to knowledge-based production technologies, to strategies that enhance their investment efforts in physical capital, to human capital and infrastructural enlargement, and to regulatory and institutional changes. All these actions will contribute in one way or another to a faster convergence process among African countries. The convergence club results imply that certain groups of African countries could still possibly have some similar characteristics in growth patterns or policies over time. Hence, we see convergence of countries in their group of clubs, other than in the second and the fifth clubs. Lack of full sample convergence could also be a reason for economic cooperation among African countries. Based on this, we conducted a club convergence test at African RECs levels.
Figures – below depict the relative transition curves of each country’s real GDP per capita, calculated from EquationEquation 2(2)
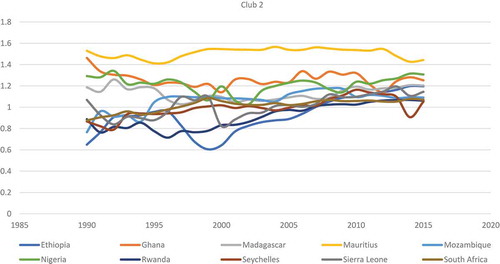
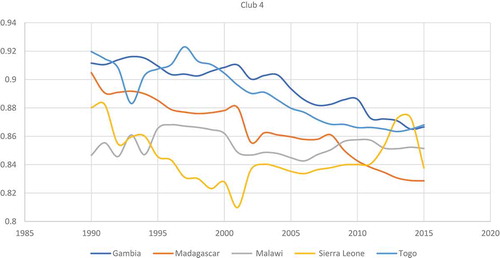
(2) . These curves show the behaviour of the variable of interest of country i relative to the panel average. According to theory, under the assumption of convergence for the full panel of countries, the relative transition path tends to be in unity for all countries. On the other hand, under the assumption of club convergence (i.e. when groups of countries converge to different equilibria), the relative transition paths of the members of each club converge to different constants. Visual inspection of these curves enables us to gain some insight into the outcomes of the testing methodology and monitor the EG course for each country, relative to the sample average. In summary, Figures illustrate the relative transition curves for EG of countries in clubs 1 to 4. A careful visual inspection of the curves shows that these countries exhibit both convergence and divergence at some point, implying that the transition paths for the African countries’ EG could not be generalised over the study period.
Figure 3. Growth Transitional Curves for club 1
Figure 4. Growth Transitional Curves for club 2
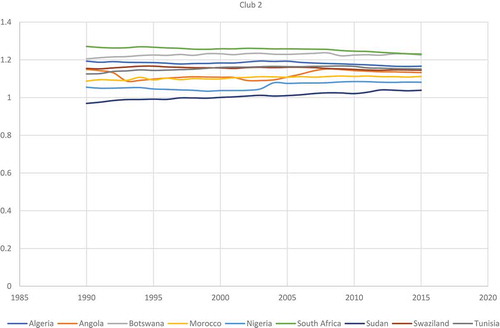
Figure 5. Growth Transitional Curves for club 3
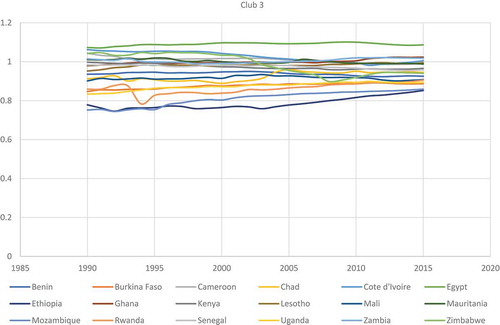
Figure 6. Growth Transitional Curves for club 4
Transition Path for Economic Growth
5. Regional empirical results and discussion
This section reports the findings for panel convergence and club convergence of real GDP per capita (proxy for economic growth (henceforth, (EG)) as well as the MILEX for each of the economic regions. We begin by examining the AMU region, where Table reports the results of the panel convergence methodology for EG and MILEX for this region. On the one hand, under MILEX, the first row reports the result of testing for full convergence (i.e. convergence among all sample countries in the economic region), while rows 2 and 3 show the results of the club clustering procedure/algorithm. Under the full sample for MILEX, the null hypothesis of full panel convergence is rejected (= −192.359 < −1.65) indicating that MILEX does not converge to the same steady state in the AMU region. According to Phillips and Sul (Citation2007), the sign of the point estimate is also a way of evaluating convergence patterns. Since
̂ =
=
= −1.755/2 is negative, the speed of adjustment implies weak convergence for AMU over the full sample period. This implies that the defence cooperation element in the AMU’s aims and objectives to maintain peace, security and stability are yet to be achieved. The absence of overall convergence in MILEX for AMU could possibly be connected to common defence and the non-interference in domestic affairs of member States, central to Article 2 of the treaty instituting AMU. According to Ndomo (Citation2009), AMU has no working defence or conflict resolution structures. Its treaty states in Article 14: “any act of aggression against any of the member countries will be considered as an act of aggression against the other member countries” but provides no definition of what would constitute “aggression”. Common defence and non-interference in the domestic affairs of the partners are important aspects of the Treaty but have not been translated into practice. This could possibly have contributed to the panel nonconvergence.
Table 6. Military expenditure and economic growth convergence results for AMU
Furthermore, the club clustering algorithm results show that countries in club 1 converge, while club 2 diverges. For club 1, the null hypothesis of club convergence is accepted since (= 0.136> −1.65), while for club 2, the null hypothesis of club convergence is rejected since (
= −129.262< −1.65). This implies that despite the panel divergence, some countries still share some similar defence characteristics in terms of policies, programmes etc. On the other hand, under the full sample for EG, the null hypothesis of full panel convergence is rejected (
= −30.355< −1.65) indicating that EG does not converge to the same steady state in the AMU region. The point estimate, which helps in evaluating convergence patterns (
̂ =
=
= −0.771/2) is negative, which means that the speed adjustment is weak for convergence in AMU. The empirical results imply that the most important objective of integration attempts in AMU, which is to work towards the convergence of per capita income or growth among the economies of countries participating in the integration efforts, is yet to be achieved, while the club clustering algorithm results show that countries in club 1 converge and in club 2 they diverge. This implies that despite the panel divergence, some countries in the AMU region still share to some extent similar economic policies, programmes etc.
Figures and below depict the panel relative transition curves of real GDP per capita and MILEX, calculated from EquationEquation 2(2)
(2) . These curves show the behaviour of the variables for AMU relative to the panel average. According to theory, under the assumption of convergence for the full panel of countries, the relative transition path tends to be in unity for all countries. On the other hand, under the assumption of club convergence (i.e. when groups of countries converge to different equilibria), the relative transition paths of the members of each club converge to different constants. Visual inspection of these curves enables us to gain some insight into the outcomes of the testing methodology and monitor the MILEX and EG course for each country relative to the sample average. In summary, a careful visual inspection of the curves for countries in AMU shows that these countries exhibit divergence over the study period. We have not reported the results for the club merging algorithm for all the RECs because they did not support the merging of the clubs.
Figure 7. Military Expenditure Panel Transitional Curves for AMU
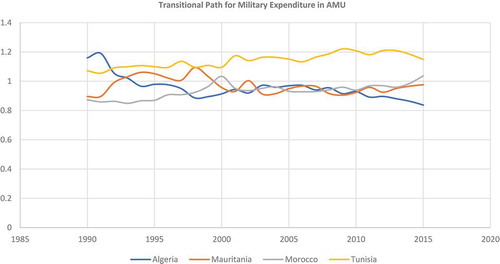
Figure 8. Growth Panel Transitional Curves for AMU
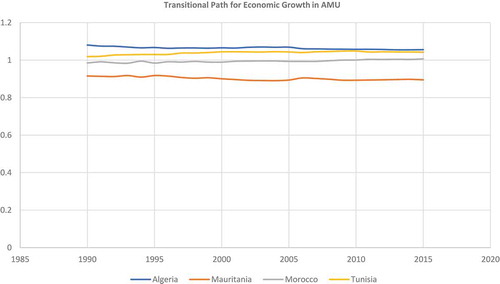
Table presents the results of the panel convergence methodology for MILEX and EG for the CEN-SAD region. Under MILEX, the first row reports the result of testing for full convergence, while rows 2 to 4 show the results of the club clustering algorithm. Under the full sample for MILEX, the null hypothesis of full panel convergence is rejected (= −23.958< −1.65) indicating that there is divergence in MILEX of the CEN-SAD region. Since the point estimate (
̂ =
=
= −1.107/2) is negative, the speed of adjustment implies weak divergence for CEN-SAD over the full sample period. This implies that the defence cooperation element in CEN-SAD’s aims and objectives to maintain peace, security and stability are yet to be achieved. This could possibly be because the CEN-SAD community is the region where instability is the most endemic in Africa, and this is reflected in the results of the full sample for the convergence test obtained in this study. This could be due to its geographical positioning between Western Europe and the Sahel-Saharan space, which has long been subject to strong migratory turbulence. Additionally, it has become the place of most intra-African conflict, and the sanctuary of all the continent’s jihadist movements. Thus, peace, security and stability have become essential topics within this community. The challenges facing CEN-SAD can be seen in a number of conflicts where member states have had difficulty fulfilling the protocols, as evidenced in the conflicts in the Central Africa Republic, South Sudan and the Sudan, the post-conflict developments between Eritrea and Ethiopia, and the Arab Spring uprisings and their aftermath.
Table 7. Military expenditure and economic growth convergence results for CEN-SAD
The club clustering algorithm results show that countries in clubs 1 and 2 converge, while those of club 3 diverge. For clubs 1 and 2, the null hypothesis of club convergence is accepted respectively since ( = 1.121> −1.65 and
= 7.928> −1.65). This implies that despite the panel divergence, some countries still share some similar defence characteristics in terms of policies, programmes, etc. On the other hand, under the full sample for EG, the null hypothesis of full panel convergence is rejected (
= −495.308< −1.65) indicating that EG does not converge to the same steady state in CEN-SAD region. The point estimate which helps in evaluating convergence patterns (
̂ =
=
= −0.883/2) is negative, which means that the speed adjustment is weak for divergence in CEN-SAD. The empirical results point to the fact that the most important objective of regional integration attempts in CEN-SAD, which is to work towards the convergence of per capita income or growth among the economies of countries participating in these integration efforts is not being achieved, while the club clustering algorithm results show that countries in clubs 1 and 2 converge and in club 3 they diverge. This also implies that despite the panel divergence, some countries in the CEN-SAD region still share to some extent similar economic policies, programmes etc.
Figures and depict the panel relative transition curves of MILEX and EG, calculated from EquationEquation 2(2)
(2) . These curves show the behaviour of the variables for CEN-SAD relative to the panel average. Visual inspection of these curves shows that these countries exhibit divergence over the study period.
Figure 9. Military Expenditure Panel Transitional Curves for CEN-SAD
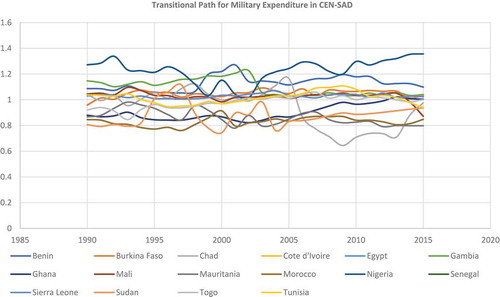
Figure 10. Growth Panel Transitional Curves for CEN-SAD
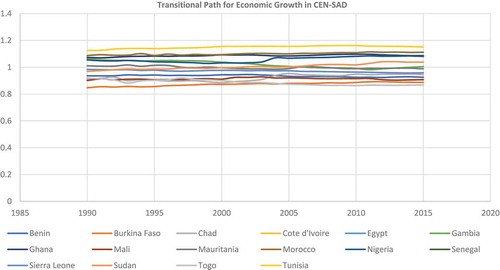
Table reports the results of the panel convergence methodology for MILEX and EG for the COMESA region. Under MILEX, the first row reports the result of testing for full convergence, while rows 2 show the results of the club clustering algorithm. Under the full sample for MILEX, the null hypothesis of full panel convergence is accepted (= −1.549>-1.65) indicating that there is convergence in MILEX of the COMESA region. Since the point estimate (
̂ =
=
= −0.105/2) is negative, the speed of adjustment implies weak convergence for COMESA over the full sample period. This implies that the defence cooperation element in COMESA’s aims and objectives to maintain peace, security and stability are yielding results, but at a slow rate, given that the speed of adjustment to convergence is negative. The club clustering algorithm reports similar result to those of the panel convergence. On the other hand, under the full sample for EG, the null hypothesis of full panel convergence is rejected (
= −37.770< −1.65) indicating that EG does not converge to the same steady state in the COMESA region. The point estimate which helps in evaluating convergence patterns (
̂ =
=
= −0.684/2) is negative, which means that the speed of adjustment is weak for convergence in COMESA. The empirical results point to the fact that the most important objective of regional integration attempts in COMESA, which is to work towards the convergence of per capita income or growth among the economies of countries participating in the integration efforts, is yet to be achieved. The club clustering algorithm results show that countries in clubs 1 to 3 converge, while those of club 4 diverge. The point estimate for clubs 1 to 3 are positive, which means that the speed of adjustment is strong for the club convergence in COMESA. This implies that despite the panel divergence, some countries in the COMESA region still share some similar economic policies, programmes etc.
Table 8. Military expenditure and economic growth convergence results for COMESA
Figures and depict the panel relative transition curves of MILEX and EG calculated from EquationEquation 2(2)
(2) . These curves show the behaviour of the variables for COMESA relative to the panel average. Visual inspection of these curves shows that these countries exhibit both divergence and convergence over the study period.
Figure 11. Military Expenditure Panel Transitional Curves for COMESA
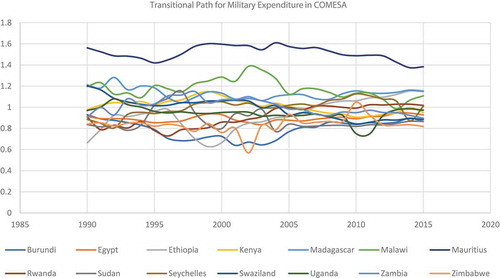
Figure 12. Growth Panel Transitional Curves for COMESA
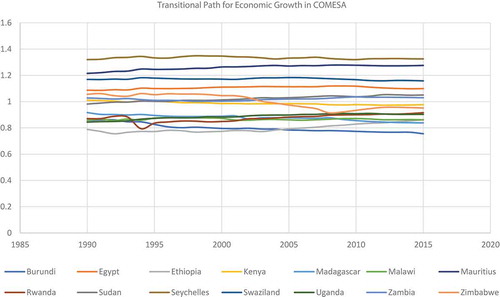
Table reports the results of the panel convergence methodology for MILEX and EG for the EAC region. Under MILEX, the first row reports the results of testing for full convergence, while row 2 shows the results of the club clustering algorithm. Under the full sample for MILEX, the null hypothesis of full panel convergence is accepted ( = 8.373>-1.65) indicating that there is convergence in MILEX of the EAC region. Since the point estimate (
=
=
= 1.059/2) is positive, the speed adjustment implies strong convergence for EAC over the full sample period. This implies that the defence cooperation element in the EAC’s aims and objectives to maintain peace, security and stability is yielding results at a fast rate. The club clustering algorithm reports similar results as those of the panel convergence. On the other hand, under the full sample for EG, the null hypothesis of full panel convergence is rejected (
= −113.256< −1.65) indicating that EG does not converge to the same steady state in the EAC region. The point estimate, which helps in evaluating convergence patterns (
̂ =
=
= −1.031/2) is negative, which means that the speed of adjustment is weak for convergence in the EAC. The empirical results point to the fact that the most important objective of regional integration attempts in EAC, which is to work towards the convergence of per capita growth among the economies of countries participating in the integration efforts is yet to be achieved, while the club clustering algorithm results show that countries in club 1 converge, and those of club 2 diverge. The point estimate for club 1 is positive, which means that the speed of adjustment is strong for club convergence. This implies that despite the panel divergence, some countries in the EAC region still share some similar economic policies, programmes etc., which must have contributed to the convergence of the club.
Table 9. Military expenditure and economic growth convergence results for EAC
Figures and depict the panel relative transition curves of MILEX and EG, calculated from EquationEquation 2(2)
(2) . A careful visual inspection of the curves of MILEX and EG shows that these countries exhibit both divergence and convergence at some point over the study period.
Figure 13. Military Expenditure Panel Transitional Curves for the EAC
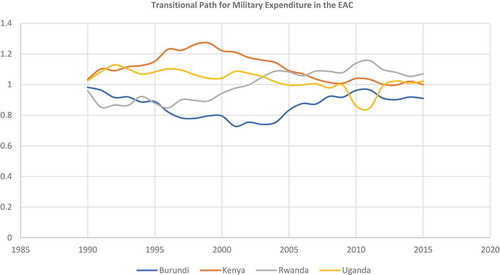
Figure 14. Growth Panel Transitional Curves for the EAC
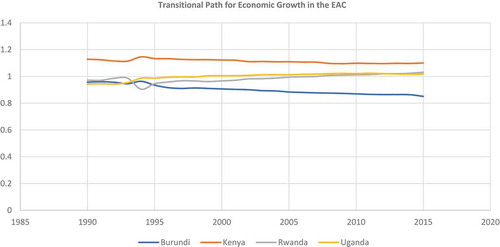
Table reports the results for the ECCAS’ MILEX and EG. The first row under MILEX reports the test for full convergence, while rows 2 and 3 show the results of the club clustering procedure. The results of the full sample reject the null hypothesis of MILEX convergence, since the log(t) statistic is −4.020 (with critical value of −1.65). There is a formation of two different convergence clubs, which shows that there exist two clubs for ECCAS. The point estimate for MILEX ( ̂ =
=
= −0.426/2) is negative, which means that the speed of adjustment is weak for divergence in ECCAS. This implies that the defence cooperation element in the ECCAS’ aims and objectives to maintain peace, security and stability is yet to be achieved. Under the full sample for EG, the null hypothesis of full panel convergence is rejected (
= −254.423< −1.65) indicating that EG does not converge to the same steady state in the ECCAS region. The point estimate (
̂ =
=
= −0.943/2) is negative, which means that the speed of adjustment is weak for divergence in ECCAS. The empirical results point to the fact that the most important objective of regional integration attempts in ECCAS, which is to work towards the convergence of per capita income or growth among the economies of countries participating in the integration efforts, is yet to be achieved. The club clustering algorithm results show that countries in club 1 converge, and in club 2 they diverge. The point estimate for club 1 is positive, which means that the speed of adjustment is strong for the club convergence. This also implies that despite the panel divergence, some countries in the ECCAS region still share some possible similar economic policies, programmes etc., which must have contributed to the convergence of the club.
Table 10. Military expenditure and economic growth convergence results for ECCAS
Following Phillips and Sul (Citation2007), we alternatively estimate the relative transition measures, hit, defined in EquationEq. (2(2)
(2) ), which capture the transition paths with respect to the panel average. Figures and show the relative transition curves at each point for the panel convergence associated with MILEX and EG. A visual inspection at the curves of MILEX and EG shows that these countries exhibit divergence at some point over the study period.
Figure 15. Military Expenditure Panel Transitional Curves for ECCAS
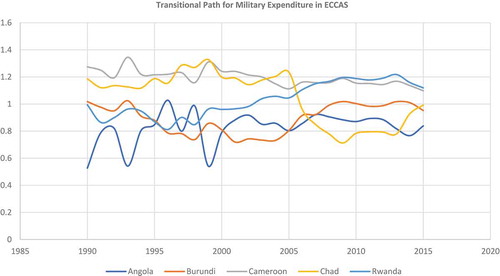
Figure 16. Growth Panel Transitional Curves for ECCAS
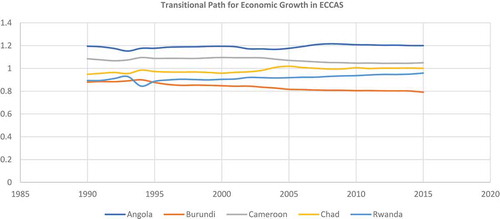
Table presents the results of the panel convergence methodology for MILEX and EG for the ECOWAS region. The MILEX result indicates that the null hypothesis of full convergence is rejected at even the 5% significance level, the point estimate of is −0.914 and the corresponding t-statistic: −11.009. Looking at club formation, as can be seen from Table , the clustering algorithm identifies two convergent clubs with the t-statistics equal to 9.788 and 2.370, respectively, and one divergent club. The empirical results point to the fact that the most important objective of regional integration attempts in ECOWAS, which is to work towards the convergence of per capita income or growth among the economies of countries participating in the integration efforts, is not being achieved. The EG result indicates that the null hypothesis of full convergence is rejected at even the 5% significance level, the point estimate of
is −1.172 and the corresponding t-statistic: −33.852. Looking at club formation, as can be seen in Table , the clustering algorithm identifies two convergent clubs with the t-statistics equal to 0.491 and 4.792 respectively, and one divergent club, t-statistic: −76.449. This also implies that despite the panel divergence, some countries in the ECOWAS region still share to some extent similar economic policies, programmes, etc. The EG convergence result is in line with the Diop (Citation2002) study.
Table 11. Military expenditure and economic growth convergence results for ECOWAS
Figures and illustrate the relative transition curves for MILEX and EG, respectively, across the ECOWAS region. The plots provide evidence of both convergence and divergence among the member states. Some of the members in the panel converge to a point above the region’s average, while some countries have a steady state towards a point below the region’s average for both MILEX and EG. This is justified by the club convergence results.
Figure 17. Military Expenditure Panel Transitional Curves for ECOWAS
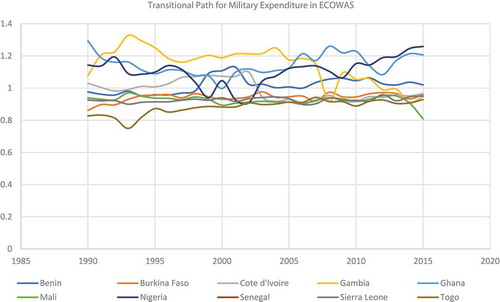
Figure 18. Growth Panel Transitional Curves for ECOWAS
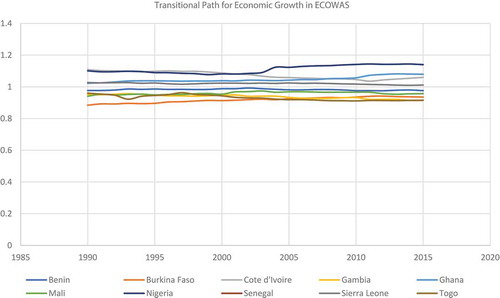
Table presents the results of the panel convergence methodology for MILEX and EG for the IGAD region. The MILEX results indicate that the null hypothesis of full convergence is rejected at even the 5% significance level, the point estimate of is −1.561, and the corresponding t-statistic: −6.099. Looking at club formation, which is seen in Table , the clustering algorithm identifies one convergent club with t-statistics equal to 0.104, and one divergent club. The empirical results point to the fact that the most important objective of regional integration attempts in IGAD, which is to work towards the convergence of per capita income or growth among the economies of countries participating in the integration efforts, is yet to be achieved. The EG result indicates that the null hypothesis of full convergence is rejected at even the 5% significance level, the point estimate of
is −0.105, and the corresponding t-statistic: −2.141. Looking at club formation in Table , the clustering algorithm identifies one convergent club with t-statistics equal to 6.806, and one divergent club. This also implies that despite the panel divergence, some countries in the IGAD region still share similar economic policies, programmes etc., to some extent.
Table 12. Military expenditure and economic growth convergence results for IGAD
Figures and illustrate the relative transition curves for MILEX and EG, respectively, across the IGAD region. The plots provide evidence of both convergence and divergence among the member states. Some of the members in the panel converge to a point above the region’s average, while some countries show a steady state towards a point below the region’s average for both MILEX and EG. This is further justified by the club convergence results.
Figure 19. Military Expenditure Panel Transitional Curves for IGAD
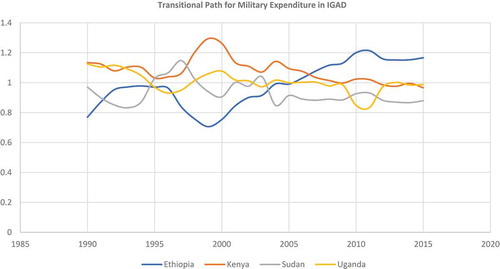
Figure 20. Growth for Panel Transitional Curves for IGAD
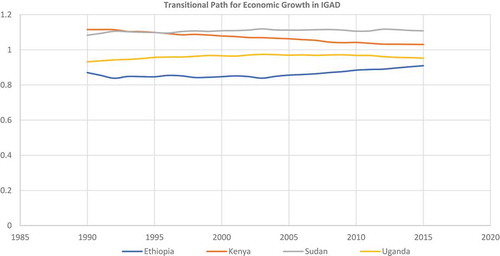
Table reports the results of the panel convergence methodology for MILEX and EG for the SADC region. The MILEX results indicate that the null hypothesis of full convergence is rejected at the 5% significance level, the point estimate of is −0.454 and the corresponding t-statistic: −13.062. Looking at club formation, as can be seen from Table , the clustering algorithm identifies three convergent clubs with t-statistics equal to 3.992, 4.429 and 1.111, respectively, and with no divergent club. The empirical results point to the fact that the most important objective of regional integration attempts in SADC, which is to work towards the convergence of per capita income or growth among the economies of countries participating in the integration efforts, is not being achieved. The EG results indicate that the null hypothesis of full convergence is rejected at even the 5% significance level, the point estimate of
is −0.729 and the corresponding t-statistic: −86.927. Looking at club formation, as can be seen in Table , the clustering algorithm identifies three convergent clubs with the t-statistics equal to 18.139, 3.267 and 20.834, respectively, and one divergent club, t-statistic: −6.024. This also implies that despite the panel divergence, some countries in the SADC region still share similar economic policies, programmes etc., to some extent.
Table 13. Military expenditure and economic growth convergence results for SADC
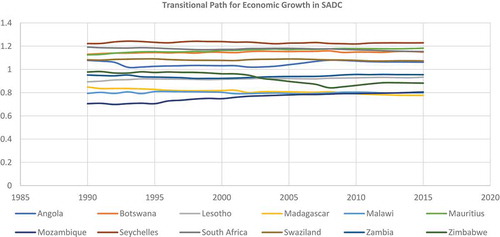
Figures and illustrate the relative transition curves for MILEX and EG, respectively, across the SADC region. The plots provide evidence of both convergence and divergence among the member states. Some of the members in the panel converge to a point above the region’s average, while some countries have a steady state towards a point below the region’s average for both MILEX and EG. This is justified by the club convergence results.
Figure 21. Military Expenditure Panel Transitional Curves for SADC
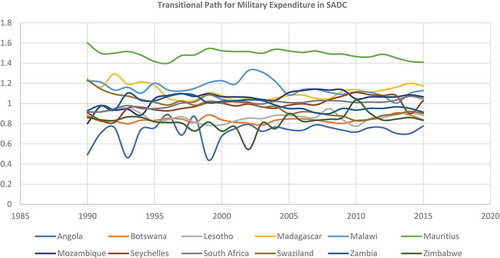
Figure 22. Growth Panel Transitional Curves for SADC
6. Conclusions and policy implications
The issue of convergence in MILEX has not attracted much interest among many researchers. This study therefore contributes to the existing literature by investigating the convergence of MILEX and EG for African countries for the period 1990–2015, by means of the methodology introduced by Phillips and Sul (Citation2007, Citation2009). This methodology uses a non-linear factor model with a common and an idiosyncratic component ̶ both time varying, which allows for technical progress heterogeneity across provinces, regions, states, etc. From an empirical point of view, the main advantage of this methodology ̶ in addition to its robustness of stationarity properties for the series under scrutiny ̶ is the provision of a simple algorithm that can be used to identify groups of countries that converge to different equilibria when the full panel of countries under examination diverges. To measure economic growth, we used real GDP per capita. We tested the hypothesis that military expenditure and economic growth in these countries converge or diverge over time. However, after the robustness tests, the final club classification results support the hypothesis of club convergence for the two variables. The results of the analysis show that there exist: (i) two convergence clubs for military expenditure; and (ii) five convergence clubs for growth.
This study also analysed the degree of convergence of military expenditure and economic growth across eight RECs of African countries for the period 1990–2015. The panel convergence results for the eight African RECs suggest the following: (i) both convergence (i.e. in COMESA and EAC) and divergence (i.e. in AMU, CEN-SAD, ECCAS, ECOWAS, IGAD and SADC) in military expenditure; (ii) divergence in economic growth for all the RECs. The following results emerged for club convergence: (i) MILEX forms 2, 3, 1, 1, 2, 3, 2 and 3 clubs in AMU, CEN-SAD, COMESA, EAC, ECCAS, ECOWAS, IGAD and SADC respectively; (ii) growth forms 2, 3, 4, 2, 2, 3, 2 and 4 clubs in AMU, CEN-SAD, COMESA, EAC, ECCAS, ECOWAS, IGAD and SADC respectively.
The non-convergence of the full sample and the presence of the different subgroup convergence clubs for both variables implies that African countries are characterised by individual factors that determine an idiosyncratic course of their own path for defence and growth policies. The results of this study further suggest that the convergence club of military expenditure and economic growth cannot be generalised across the RECs of African countries, and likewise for the overall convergence of the regions, despite the defence and economic cooperation elements in the RECs mutual pacts. The nonconvergence of the full sample and the presence of the different subgroup convergence clubs for both variables imply RECs of African countries are characterized by individual factors, which in turn determine an idiosyncratic course of their own path for defence and growth policies. The empirics further confirm that African countries and their RECs appear to have chosen dissimilar defence and growth transition paths.
For policy direction, African RECs should accomplish or aim at achieving, attaining and sustaining a convergence pattern for military expenditure and growth by genuinely dealing with both internal and external security threats of member states in order to be able to: promote the peace and security needed for economic and industrial activities; avoid potential waste of precious national resources through unnecessary and unproductive ventures by investing scarce state funds in research and development projects and important infrastructural facilities (such as airports, highways and rail transport, hospitals, bridges, transport hubs, network communications, the media, electricity grids, dams, seaports, oil refineries, etc.), thus increasing capital accumulation. This study also recommends that African RECs should; (i) formulate, harmonise, coordinate and ensure implementation of their defence and growth policies together in order to achieve a convergence for the multifaceted security challenges facing the regions, such as civil war/strife, terrorism, insurgencies, banditry, border threats, urban riots and so on; (ii) be proactive in dealing with security issues by utilizing military modernisation programmes (such as modern methods of intelligence gathering and sharing among security personnel, training, logistics, etc.) and possible non-military modernisation programmes (such as dialogue). Furthermore, the different characteristics of the overall convergence or divergence and sub-club convergence or divergence of the African RECs must be considered by all policymakers before formulating, harmonising, coordinating and ensuring the implementation of their defence and growth policies.
Declaration of conflicting interests
The author(s) declared no potential conflicts of interest with respect to the research, authorship and/or publication of this article.
Additional information
Funding
Notes on contributors
Charles Shaaba Saba
Saba Charles Shaaba received his PhD in Economics from University of Johannesburg, South Africa. He is currently a research fellow at School of Economics University of Johannesburg. Current research interest: Defense and Peace Economics; Public Finance; Growth and Development Economics, International Trade and Telecommunication/ICT.
Nicholas Ngepah
Ngepah Nicholas holds PhD in Economics from University of Cape Town, South Africa. He is currently a lecturer and Associate Professor of Economics at School of Economics University of Johannesburg. Current research interest: Development Economics; Energy Economics; Health Economics; Poverty, Inequality and Growth.
Notes
1. They include: Arab Maghreb Union (AMU); Community of Sahel-Saharan States (CEN-SAD); Common Market for Eastern and Southern Africa (COMESA); East African Community (EAC); Economic Community of Central African States (ECCAS); Economic Community of West African States (ECOWAS); Intergovernmental Authority on Development (IGAD); and the Southern African Development Community (SADC).
References
- Akhmedjonov, A., & Lau, C. K. (2012). Do energy prices converge across Russian regions? Economic Modelling, 29(5), 1623–35. https://doi.org/10.1016/j.econmod.2012.05.023
- Akhmedjonov, A., Lau, M. C. K., & İzgi, B. B. (2013). New evidence of regional income divergence in post-reform Russia. Applied Economics, 45(18), 2675–2682. https://doi.org/10.1080/00036846.2012.665600
- Alptekin, A., & Levine, P. (2012). Military expenditure and economic growth: A meta-analysis. European Journal of Political Economy, 28(4), 636–650. https://doi.org/10.1016/j.ejpoleco.2012.07.002
- Apergis, N., Christou, C., & Miller, S. (2012). ‘Convergence patterns in financial development: Evidence from club convergence’. Empirical Economics, 43(No.3), 1011–1040. https://doi.org/10.1007/s00181-011-0522-8
- Apergis, N., Panopoulou, E., & Tsoumas, C. (2010). ‘Old wine in a new bottle: Growth convergence dynamics in the EU’. Atlantic Economic Journal, 38(No.2), 169–181. https://doi.org/10.1007/s11293-010-9219-1
- Arvanitidis, P., & Kollias, C. (2016). Converging defence burdens? Some further findings. Peace Economics, Peace Science and Public Policy, 22(4), 365–375. https://doi.org/10.1515/peps-2016-0027
- Arvanitidis, P., Kollias, C., & Anastasopoulos, K. (2014). ‘Is there an international convergence in defence burdens? Some initial findings’. Peace Economics, Peace Science and Public Policy, 20(4), 611–620. https://doi.org/10.1515/peps-2014-0030
- Arvanitidis, P., Kollias, C., & Messis, P. (2016). ‘Asymmetric convergence in globalization? Findings from a disaggregated analysis’. Managing Global Transitions, 14(2), 117–135. http://www.fm-kp.si/zalozba/issn/1581-6311/14-2.pdf#page=5
- Arvanitidis, P., Kollias, C., & Messis, P. (2017). ‘Converging allies?’. Peace Economics, Peace Science and Public Policy, 23(2), 1–15. https://doi.org/10.1515/peps-2016-0044
- Barro, R. J., & Sala-i-Martin, X. (1992). ‘Convergence’. Journal of Political Economy, 100(2), 223–251. https://doi.org/10.1086/261816
- Barro, R. J., Sala-i-Martin, X., Blanchard, O. J., & Hall, R. E. (1991). ‘Convergence across states and regions’. Brookings Papers on Economic Activity, 1991(1), 107–182. https://doi.org/10.2307/2534639
- Bartkowska, M., & Riedl, A. (2012). ‘Regional convergence clubs in Europe: Identification and conditioning factors’. Economic Modelling, 29(1), 22–31. DOI: 10.1016/j.econmod.2011.01.013
- Baumol, W. J. (1986). ‘Productivity growth, convergence, and welfare: What the long-run data show’. The American Economic Review, 76(5), 1072–1085. https://www.jstor.org/stable/1807175
- Baumol, W. J., & Wolff, E. N. (1988). ‘Productivity growth, convergence, and welfare: Reply’. The American Economic Review, 78(No.5), 1155–1159. https://www.jstor.org/stable/1807175
- Bernard, A. B., & Durlauf, S. N. (1995). ‘Convergence in international output’. Journal of Applied Econometrics, 10(No.2), 97–108. https://doi.org/10.1002/jae.3950100202
- Besley, T., & Burgess, R. (2003). ‘Halving global poverty’. Journal of Economic Perspectives, 17(3), 3–22. https://doi.org/10.1257/089533003769204335
- Binder, M., & Pesaran, M. H. (1999). ‘Stochastic growth models and their econometric implications’. Journal of Economic Growth, 4(2), 139–183. https://doi.org/10.1023/A:1009802421114
- Borsi, M. T., & Metiu, N. (2015). ‘The evolution of economic convergence in the European Union’. Empirical Economics, 48(2), 657–681. https://doi.org/10.1007/s00181-014-0801-2
- Bove, V., & Brauner, J. (2016). ‘The demand for military expenditure in authoritarian regimes’. Defence and Peace Economics, 27(5), 609–625. https://doi.org/10.1080/10242694.2014.925325
- Bush, G. W. 2002. ‘The national security strategy of the United States of America. Executive Office of The President. https://apps.dtic.mil/dtic/tr/fulltext/u2/a406411.pdf
- Cannon, E. S., & Duck, N. W. (2000). ‘Galton’s fallacy and economic convergence’. Oxford Economic Papers, 52(2), 415–419. https://doi.org/10.1093/oep/52.2.415
- Canova, F. (2004). ‘Testing for convergence clubs in income per capita: A predictive density approach’. International Economic Review, 45(1), 49–77. https://doi.org/10.1111/j.1468-2354.2004.00117.x
- Carlino, G. A., & Mills, L. O. (1993). ‘Are US regional incomes converging? A time series analysis’. Journal of Monetary Economics, 32(2), 335–346. https://doi.org/10.1016/0304-3932(93)90009-5
- Caselli, F., Esquivel, G., & Lefort, F. (1996). ‘Reopening the convergence debate: A new look at cross-country growth empirics’. Journal of Economic Growth, 1(3), 363–389. https://doi.org/10.1007/BF00141044
- Churchill, S. A., & Yew, S. L. (2018). ‘The effect of military expenditure on growth: An empirical synthesis’. Empirical Economics, 55(3), 1357–1387. https://doi.org/10.1007/s00181-017-1300-z
- Cuaresma Crespo, J., Ritzberger-Grünwald, D., & Silgoner, M. A. (2008). ‘Growth, convergence and EU membership’. Applied Economics, 40(5), 643–656. https://doi.org/10.1080/00036840600749524
- d’Agostino, G., Dunne, J. P., & Pieroni, L. (2017). ‘Does military spending matter for long-run growth?’. Defence and Peace Economics, 28(4), 429–436. https://doi.org/10.1080/10242694.2017.1324723
- David, O. O. (2019). ‘Powering economic growth and development in Africa: Telecommunication operations’. Applied Economics, 51(33), 3583–3607. https://doi.org/10.1080/00036846.2019.1578852
- Diop, P. (2002). ‘Convergence nominale et convergence réelle: Une application des concepts de σ-convergence et de β-convergence aux économies de la CEDEAO. UEMOA, Note d’Informations Statistiques de la BCEAO.
- Douch, M., & Solomon, B. (2016). A dynamic panel analysis using SIPRI’s extended military expenditure data: The case of middle power nations. The Economics of Peace and Security Journal, 11(2), 45. https://doi.org/10.15355/epsj.11.2.45
- Dunne, J. P., & Perlo-Freeman, S. (2003). ‘The demand for military spending in developing countries: A dynamic panel analysis’. Defence and Peace Economics, 14(6), 461–474. https://doi.org/10.1080/1024269032000085224
- Dunne, J. P., Perlo‐Freeman, S., & Smith, R. P. (2008). ‘The demand for military expenditure in developing countries: Hostility versus capability’. Defence and Peace Economics, 19(4), 293–302. https://doi.org/10.1080/10242690802166566
- Dunne, J. P., & Smith, R. P. (2010). ‘Military expenditure and granger causality: A critical review’. Defence and Peace Economics, 21(5–6), 427–441. https://doi.org/10.1080/10242694.2010.501185
- Dunne, J. P., Smith, R. P., & Willenbockel, D. (2005). Models of military expenditure and growth: A critical review. Defence and Peace Economics, 16(6), 449–461. https://doi.org/10.1080/10242690500167791
- Dunne, J. P., & Tian, N. (2013). ‘Military expenditure and economic growth: A survey’. The Economics of Peace and Security Journal, 8(1), 5. https://doi.org/10.15355/epsj.8.1.5
- Evans, P. (1998). ‘ Using panel data to evaluate growth theories’. International Economic Review, 39(2), 295–306. https://doi.org/10.2307/2527294
- Friedman, M. (1992). ‘Do old fallacies die?’. Journal of Economic Literature, 30(4), 2129–2132. https://www.jstor.org/stable/2727976
- Fritsche, U., & Kuzin, V. (2011). ‘Analysing convergence in Europe using the non-linear single factor model’. Empirical Economics, 41(2), 343–369. https://doi.org/10.1007/s00181-010-0385-4
- Galor, O. (1996). ‘Convergence? Inferences from theoretical models’. The Economic Journal, 106(437), 1056–1069. https://doi.org/10.2307/2235378
- Ghura, D., & Hadjimichael, M. T. (1996). ‘Growth in Sub-Saharan Africa’. Staff Papers - International Monetary Fund, 43(3), 605–634. https://doi.org/10.2307/3867556
- Güri̇ş, S., Güriş, B., & Tiraşoğlu, M. (2017). ‘Do military expenditures converge in NATO countries? Linear and nonlinear unit root test evidence’. Theoretical and Applied Economics, 24(2), 237–248.
- Hammouda, H. B., Karingi, S. N., Njuguna, A. E., & Jallab, M. S. (2009). ‘Why doesn’t regional integration improve income convergence in Africa?’. African Development Review, 21(2), 291–330. https://doi.org/10.1111/j.1467-8268.2009.00211.x
- Heo, U., & Ye, M. (2016). ‘Defense spending and economic growth around the globe: The direct and indirect link’. International Interactions, 42(5), 774–796. https://doi.org/10.1080/03050629.2016.1149067
- Islam, N. (1995). ‘Growth empirics: A panel data approach’. The Quarterly Journal of Economics, 110(4), 1127–1170. https://doi.org/10.2307/2946651
- Kalwij, A., & Verschoor, A. (2007). ‘Not by growth alone: The role of the distribution of income in regional diversity in poverty reduction’. European Economic Review, 51(4), 805–829. https://doi.org/10.1016/j.euroecorev.2006.06.003
- Kasman, A., Kirbas-Kasman, S., & Turgutlu, E. (2005). ‘Nominal and real convergence between the CEE countries and the EU: A fractional cointegration analysis’. Applied Economics, 37(21), 2487–2500. https://doi.org/10.1080/00036840500366312
- Kollias, C., & Paleologou, S. M. (2019). ‘Military spending, economic growth and investment: A disaggregated analysis by income group’. Empirical Economics, 56(3), 935–958. https://doi.org/10.1007/s00181-017-1379-2
- Kollias, C., Paleologou, S.-M., Tzeremes, P., & Tzeremes, N. (2017). ‘Defence expenditure and economic growth in Latin American countries: Evidence from linear and nonlinear causality tests. Latin American Economic Review, 26(1), 2. https://doi.org/10.1007/s40503-017-0039-4
- Lau, C. K. M., Demir, E., & Bilgin, M. H. (2016). ‘A nonlinear model of military expenditure convergence: Evidence from estar nonlinear unit root test’. Defence and Peace Economics, 27(3), 392–403. https://doi.org/10.1080/10242694.2015.1016296
- Malizard, J. (2016). ‘Military expenditure and economic growth in the European Union: Evidence from SIPRI’s extended dataset’. The Economics of Peace and Security Journal, 11(2), 2. https://doi.org/10.15355/epsj.11.2.38
- Mankiw, N. G., Romer, D., & Weil, D. N. (1992). ‘A contribution to the empirics of economic growth’. The Quarterly Journal of Economics, 107(2), 407–437. https://doi.org/10.2307/2118477
- McCoskey, S. K. (2002). ‘Convergence in Sub-Saharan Africa: A nonstationary panel data approach’. Applied Economics, 34(7), 819–829. https://doi.org/10.1080/00036840110061668
- Monfort, M., Cuestas, J. C., & Ordonez, J. (2013). ‘Real convergence in Europe: A cluster analysis’. Economic Modelling, 33(C), 689–694. https://doi.org/10.1016/j.econmod.2013.05.015
- Ndomo, A. (2009). Regional economic communities in Africa: A progress overview. Study Commissioned by GTZ.
- Ndulu, B., Chakraborti, L., Lijane, L., Ramachandran, V., & Wolgin, J. (2007). Challenges of African growth: Opportunities, constraints, and strategic directions. The World Bank.
- Pamp, O., & Thurner, P. W. (2017). ‘Trading arms and the demand for military expenditures: Empirical explorations using new SIPRI-data’. Defence and Peace Economics, 28(4), 457–472. https://doi.org/10.1080/10242694.2016.1277452
- Perlo-Freeman, S. (2017). ‘SIPRI’s new long data-set on military expenditure: The successes and methodological pitfalls’. Defence and Peace Economics, 28(4), 404–421. https://doi.org/10.1080/10242694.2017.1279782
- Perlo-Freeman, S., & Sköns, E. (2016). ‘Snakes and ladders: The development and multiple reconstructions of the Stockholm International Peace Research Institute’s military expenditure data’. The Economics of Peace and Security Journal, 11(2), 5. https://doi.org/10.15355/epsj.11.2.5
- Phillips, P. C., & Sul, D., 2003, The elusive empirical shadow of growth convergence. Cowles Discussion Paper, 1398, Yale University.
- Phillips, P. C., & Sul, D. (2007). ‘Transition modeling and econometric convergence tests’. Econometrica, 75(6), 1771–1855. https://doi.org/10.1111/j.1468-0262.2007.00811.x
- Phillips, P. C., & Sul, D. (2009). ‘Economic transition and growth’. Journal of Applied Econometrics, 24(7), 1153–1185. https://doi.org/10.1002/jae.1080
- Quah, D. (1993). ‘Galton’s fallacy and tests of the convergence hypothesis’. Scand J. Economics, 95(4), 427–443. https://doi.org/10.2307/3440905
- Quah, D. T. (1996). ‘Twin peaks: Growth and convergence in models of distribution dynamics’. The Economic Journal, 106(437), 1045–1055. https://doi.org/10.2307/2235377
- Quah, D. T. (1997). ‘Empirics for growth and distribution: Stratification, polarization, and convergence clubs’. Journal of Economic Growth, 2(1), 27–59. https://doi.org/10.1023/A:1009781613339
- Ramajo, J., Marquez, M. A., Hewings, G. J., & Salinas, M. M. (2008). ‘Spatial heterogeneity and interregional spillovers in the European Union: Do cohesion policies encourage convergence across regions?’. European Economic Review, 52(3), 551–567. https://doi.org/10.1016/j.euroecorev.2007.05.006
- Rosh, R. M. (1988). ‘Third world militarization: Security webs and the states they ensnare’. Journal of Conflict Resolution, , 32(4), 671–698. https://doi.org/10.1177/0022002788032004004
- Saba, C. S., & Ngepah, N. (2019a). ‘A cross-regional analysis of military expenditure, state fragility and economic growth in Africa’. Quality and Quantity, 53(6), 2885–2915. https://doi.org/10.1007/s11135-019-00905–6
- Saba, C. S., & Ngepah, N. (2019b). ‘Empirical analysis of military expenditure and industrialisation nexus: A regional approach for Africa’. International Economic Journal, 34(1), 58–84. https://doi.org/10.1080/10168737.2019.1641541
- Saba, C. S., & Ngepah, N. (2019c). ‘Military expenditure and economic growth: Evidence from a heterogeneous panel of African countries’. Economic research-Ekonomska Istraživanja, 32(1), 3586–3606. https://doi.org/10.1080/1331677X.2019.1674179
- Saba, S. C., & Ngepah, N. (2018). ‘Military expenditure, industrialisation, and economic growth in Africa: Evidence from a panel causality analysis’. African Journal of Business and Economic Research, 13(3), 29–48. https://doi.org/10.31920/1750-4562/2018/V13n3a2
- Sala-i-Martin, X. X. (1996). ‘Regional cohesion: Evidence and theories of regional growth and convergence’. European Economic Review, 40(6), 1325–1352. https://doi.org/10.1016/0014-2921(95)00029-1
- SIPRI (2017). Stockholm International Peace Research Institute (SIPRI). The SIPRI data is available at http://www.sipri.org/databases/milex
- Smith, R. P. (1980). ‘The demand for military expenditure’. The Economic Journal, 90(360), 811–820. https://doi.org/10.2307/2231744
- Smith, R. P. (1989). ‘Models of military expenditure’. Journal of Applied Econometrics, 4(4), 345–359. https://doi.org/10.1002/jae.3950040404
- Solarin, S. A. (2018). ‘Determinants of military expenditure and the role of globalisation in a cross-country analysis. Defence and Peace Economics, 29(7), 853–870. https://doi.org/10.1080/10242694.2017.1309259
- Solarin, S. A. (2019). ‘Convergence of defence burdens in Asia-pacific economies: A residual augmented least squares approach’. Peace Economics, Peace Science and Public Policy, 25(2), 1–18. https://doi.org/10.1515/peps-2018-0036
- Soler I Lecha, E. (2010). Converging, diverging and instrumentalizing European security and defence policy in the Mediterranean. Mediterranean Politics, 15(2), 231–248. https://doi.org/10.1080/13629395.2010.485050
- Solow, R. M. (1956). ‘A contribution to the theory of economic growth’. The Quarterly Journal of Economics, 70(1), 65–94. https://doi.org/10.2307/1884513
- Suvankulov, F., Lau, M. C. K., & Ogucu, F. (2012). ‘Price regulation and relative price convergence: Evidence from the retail gasoline market in Canada’. Energy Policy, 40, 325–334. https://doi.org/10.1016/j.enpol.2011.10.015
- Swan, T. W. (1956). ‘Economic growth and capital accumulation’. Economic Record, 32(2), 334–361. https://doi.org/10.1111/j.1475-4932.1956.tb00434.x
- Von Lyncker, K., & Thoennessen, R. (2017). ‘Regional club convergence in the EU: Evidence from a panel data analysis’. Empirical Economics, 52(2), 525–553. https://doi.org/10.1007/s00181-016-1096-2
- World Bank. (2015). World Development Indicators, World Bank Group. http://databank.world bank.org/data/source/world-development-indicators#
Appendix
Table A1. List of selected African countries
Table A2. Africa’s regional economic blocks
Figure A1. Trends in Average Percentage of Real GDP Per Capita (RGDPP) in each of the eight African RECs, 1990-2015. Source: Authors’ computation with data from World Development Indicators
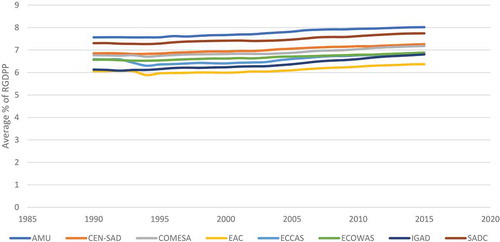
Figure A2. Trends in Average Military Expenditure as a Percentage Share of GDP in each of the eight African Regional Economic Communities, 1990-2015. Source: Authors’ computation with data from the Stockholm International Peace Research Institute