
 ?Mathematical formulae have been encoded as MathML and are displayed in this HTML version using MathJax in order to improve their display. Uncheck the box to turn MathJax off. This feature requires Javascript. Click on a formula to zoom.
Abstract
This research article seeks to specify and measure the determinants of multidimensional poverty in Colombia using the Unsatisfied Basic Needs (UBN) Index based on information from the latest available 2005 population census applying a spatial econometric approach. An exploratory analysis of the spatial distribution of the UBN and a confirmatory analysis through spatial models are conducted using municipalities as the unit of analysis. This spatial analysis confirms diffusion effects of poverty between neighbouring municipalities, the existence of clusters and hot spots in the Pacific Chocó region, the Caribbean Coast, and the southern region of the country. Within those clusters, we find high levels of unemployment, low levels of urban population, as well as a high proportion of ethnic minorities, and large size municipalities. This research contributes to public policymaking and the improvement of governance in the third largest Latin American country by population size and the region’s fourth largest economy.
PUBLIC INTEREST STATEMENT
This research article seeks to specify and measure the determinants of multidimensional poverty in Colombia using the Unsatisfied Basic Needs (UBN) Index based on information from the latest available 2005 population census applying a spatial econometrics approach. An exploratory analysis of the spatial distribution of the UBN and a confirmatory analysis through spatial models are conducted using municipalities as the unit of analysis. This spatial analysis confirms diffusion effects of poverty between neighbouring municipalities, the existence of clusters and hot spots in the Pacific Chocó region, the Caribbean Coast, and the southern region of the country. Within those clusters, we find high levels of unemployment, low levels of urban population, as well as a high proportion of ethnic minorities, and large size municipalities. This research contributes to public policymaking and the improvement of governance in the third largest Latin American country by population size and the region’s fourth largest economy.
1. Introduction
This research provides insights into spatial econometric relationships and seeks to reveal the determinants of multidimensional poverty in Colombia using the Unsatisfied Basic Needs (UBN) Index at a municipal level. The analysis is based on the latest available 2005 Population Census data carried out by the Colombian Agency for National Statistics (Departamento Administrativo Nacional De Estadística (DANE), Citation2018; Departamento Administrativo Nacional De Estadística (DANE), Citation2005). The spatial dimension of the municipal UBN Index and several socioeconomic variables are explored, such as the share of the population in rural areas, percentage of ethnic minorities, fiscal municipal data, employment indicators, and municipal territorial extension. The New Economic Geography (NEG) paradigm has garnered special interest about the spatial dimension of economic and social phenomena (Behrens & Thisse, Citation2007; Krugman, Citation1998).
This growing interest also evidences the importance of analytical dimensions such as space and the use of territory in the economy in understanding regional socioeconomic development (Arias & Fortich, Citation2010; Brueckner & Fansler, Citation1983; Krugman, Citation1997; Scott & Storper, Citation2003).
It appears that the study of economic activity about spatial phenomena and their interactions has thus far not been sufficiently developed theoretically. A large part of classical economic theory was constructed without considering spatial variables (Arias & Fortich, Citation2010; Sánchez & Zofío, Citation2009) although economic, social, and cultural phenomena are expressed in geographical concepts such as territory, region, or space.
This paper contributes to the study of multidimensional poverty in Colombia. The findings serve as a point of reference for the formulation of economic and social public policies. This research contributes to public policymaking and the improvement of governance in the third largest Latin American country by population size and the region’s fourth largest economy. The next section presents a literature review, followed by a discussion of the methodology used in the paper. The subsequent section presents the findings of the exploratory analysis of the spatial distribution of poverty in Colombia and its confirmatory analysis. Finally, the last section presents the conclusions that can be drawn from the research on the spatial analysis of multidimensional poverty in Colombia at the municipal level.
2. Previous research on NEG and multidimensional poverty
Poverty has traditionally been associated with a state of deficiency and deprivation, which is also understood as the inability to achieve a minimum level of life quality and is frequently expressed in monetary terms. The analytical and conceptual limitations that the monetary approach entails ignore multidimensional, dynamic, subjective, geographic, and aspects of vulnerability that are implied in poverty (Cicowiez et al., Citation2012; Rawls, Citation1999; Sen, Citation1999).
Moreover, Cicowiez et al. (Citation2012) emphasize that the multidimensionality of poverty implies considering factors external to the market such as individual and political freedom, discrimination, insecurity, and a lack of access to health and education services. The UBN Index is an indicator that seeks to reflect some of those situations by emphasizing variables going beyond monetary factors as is the case of the overcrowding of households, poor housing conditions, inadequate access to drinking water, a lack or deprivation of sanitation services, insufficient access to education for children of primary school age, and a lack of income opportunities.
The UBN Index as a multidimensional poverty indicator possesses advantages in terms of its geographical breakdown since it gathers variables that measure diverse dimensions of poverty in different regions. It is also an indicator that measures quality of life and the structural aspects of poverty using variables different to monetary ones. The UBN Index indicators are closely related to a region’s economic performance and correspond to the distribution of the socioeconomic indicators that evidence centre–periphery relationships with heterogeneous areas and with differences in development opportunities. Among its disadvantages are its low frequency of data collection, based on the census that is usually carried out in Colombia every 10 years (Angulo et al., Citation2016; Villarraga et al., Citation2014). It is thus of little utility in identifying recent poverty situations, and neither does it allow measuring poverty gaps nor their distribution. It underestimates rural poverty and its effects such as low schooling and malnutrition (Feres & Mancero, Citation2001).
Despite the disadvantages of this indicator its virtues surpass other indicators in geographical aspects, information availability at a municipal level, and elaboration of poverty maps for the design of regional policies. One consideration on poverty warns against the so-called “poverty traps” or persistence of extreme poverty situations within a region where these hardships reinforce and interact with each other generating vicious circles, which counteract the effort to overcome this condition (Núñez & Carvajal, Citation2007). In Colombia, the occurrence of such traps can be synthesized in deficiencies such as child labour, illiteracy, malnutrition and disease, inadequate use of the land, violence, criminality, geographic isolation, informality, environmental problems, unskilled labour, and forced displacement (Bernal-Torres et al., Citation2020; Cuesta & Nuñez, Citation2006; Ramírez et al., Citation2014; Súlez, Citation2014). The NEG and spatial econometric analysis seek to recognize space as the medium in which relationships between individuals and socioeconomic phenomena develop (Anselin, Citation1988, Citation1998; Avendaño, Citation2008; Blommestein, Citation1983; Cliff & Ord, Citation1981; Fujita & Krugman, Citation2004; Krugman, Citation1991; Moran, Citation1948; Student, Citation1914).
According to spatial economic models, the size of the cities is determined by the relationship between urban income and rural income, urban transportation costs and rural land rent (Bateman & Martínez, Citation2011). Regarding demographic aspects, urban growth in cities in developing countries is characterized by an intense migration from neighbouring areas, mainly rural (De Mattos, Citation2010). Theories of agglomeration economies and the approaches to centripetal and centrifugal forces in the territory become useful tools in the identification of socioeconomic phenomena with spatial connotations. Centripetal forces are those that generate agglomerations such as forward and backward linkages in the industry driving greater density in markets and contributing to the spread of technology. In contrast, centrifugal forces, which operate in the opposite direction feature high transportation costs, factor immobility, congestion, and other diseconomies (Fujita & Krugman, Citation2004).
Especially in the case of Colombia, it is possible to observe an important process of formation of urban and metropolitan centres driven by the growth of medium-sized cities, which are located around the big cities (Bateman & Martínez, Citation2011). At the regional level, centripetal forces are detected by the configuration of metropolitan areas and economic sub-regions that naturally group around municipalities due to their complementarities in economic and social aspects (Bateman & Martínez, Citation2011).
Polycentrism, a process that generates employment and population decentralization, drives the population to agglomerate around diverse centres of economic activity. Geographical location impacts on inhabitants’ access to social services, and to employment because the distance to urban centres of economic concentration matters in terms of inequality in opportunities (Vivas, Citation2013). The location decisions of businesses consider the evolution and growth of cities as they must weigh the conditions of remaining in downtown areas or moving elsewhere. The decentralization process follows relatively ordered dynamics in which diverse centres are generated around locations where the economic activity and population settlements coalesce (Avendaño, Citation2008). Moreover, Estrada and Moreno (Citation2013) have explored the spatial dimension of multidimensional poverty in Colombia at a municipal level through poverty maps, exploratory analysis of spatial data, tendency analysis, and local and global spatial autocorrelation tests confirming previous findings in relation to the presence of the positive spatial autocorrelation of poverty.
Galvis and Meisel (Citation2012) studied regional convergence confirming a high degree of persistence in regional inequalities. Based on this, the authors argue that decentralization has apparently been unable to reduce income disparities and that regions in the Pacific and Caribbean Coasts are home to “poverty traps” that require the national government stimulus to achieve growth and development. Le Gallo and Chasco (Citation2008) used a seemingly unrelated spatial regression—known in econometrics as Spatial SUR—to estimate Zipf’s law in Spain (Sampedro, Citation2009). Cohen and Morrison-Paul (Citation2009) evaluated the impacts of industrial externalities on economic growth by incorporating measurements of the level of activity with a cost function model. They found significant savings due to the proximity to industrial food centres and to areas of high purchasing power.
Kosfeld and Lauridsen (Citation2009) applied spatial dynamic modelling to study the regional convergence processes in unified Germany resorting to the use of analytical concepts such as spatial unit roots, spatial co-integration, and spatial error adjustments. In a recent study on the case of the Brazilian state of Bahia, Santos et al. (Citation2017: 240) “found evidence of a pattern of spatialization as well as the existence of clusters of regional poverty […] using variables such as income, education, housing and health.” For the case of rural China, Wang et al. (Citation2018: 1444) concluded that “there exist significant poverty differences in terms of geographical location and policy support, and the governments still need to carry out targeted poverty alleviation measures according to local conditions.”
As an important precedent to the research presented in this paper, Pérez (Citation2005) performed a spatial analysis of poverty in Colombia by calculating global and local Moran’s I statistics using the 1985 and 1993 UBN Index and Quality of Life Index (QLI). Significant evidence was found on geographic location as a determinant of poverty in the country due to spatial dependence, as well as poverty clusters and poverty diffusion processes at a provincial and municipal level suggesting that such results can be explained in terms of provision of natural resource and externalities in the studied regions. Contributions such as those of Lösch (Citation1938), Christaller (Citation1935), and Zipf (Citation1949) explain how, based on the search for economies of scale, individual agents create a hierarchy of cities with areas of hexagonal and nested markets. Equally, the existence of many market town depends on an even greater administrative centre.
In Colombia, this circumstance can be observed with the formation of big urban centres located at considerable distances, but that are at the same time the centre of large regions such as Bogotá-Andean Region, Barranquilla-Caribbean Coast, Bucaramanga-Santanderes, Cali-Pacific, and Medellín-Coffee Belt (the departments of Antioquia, Caldas, Quindío and Risaralda). These spatial phenomena are denominated “development poles” that in the Colombian case came into being because of the integration difficulties due to the rugged terrain (Bateman & Martínez, Citation2011).
3. Model specifications
The empirical approach focuses on the spatial distribution of some socioeconomic indicators at municipal level based on the latest 2005 census information. Regression techniques are applied to study the special features caused by the spatial dimension in the distribution of the phenomenon of poverty in Colombia. The analysis of spatial data is divided into two phases: exploratory analysis based on the study of the spatial distribution of a phenomenon, and confirmatory analysis, centred on the treatment of the spatial effects using a regression model (Moreno & Vayá, Citation2000). This paper will develop both phases. It thus considers spatial data of the following variables involved: UBN Index, social indicators of unemployment, population densities, economic densities, and economic activity of the population in Colombian cities and municipalities in 2005 to identify tendencies and agglomerations of the socioeconomic phenomena linked to the Colombian geography, as well as relationships between variables to explore significant statistical associations on a spatial plane. Within the treatment of spatial data, spatial econometric techniques are used that identify the existence of spatial autocorrelation that use statistical tests like Moran’s I, which incorporate a spatial lag dependent variable or a spatial error structure to correct spatial autocorrelation effects.
During the confirmatory phase, a classical regression model incorporating spatial effects is developed after identifying the type of spatial autocorrelation and the appropriate way of specifying it. Spatial autocorrelation refers to the functional relationship between the value that a variable takes at a specific point or region and the value it takes in a neighbouring or proximal region. The main difference between temporal and spatial autocorrelation lies in directionality. Temporal autocorrelation is only one-way (from past to present) while the spatial dimension can refer to any direction in space. Thus, what occurs in one region can be explained not only by the nearest region, but also by other regions. Within spatial regression models, two types of spatial dependence are identified among observations that need to be considered. Firstly, in the geographically weighted models the dependent variable is spatially correlated in an autoregressive manner. Yet, in the spatial error type, a model’s error is autocorrelated. Hence, statistics such as Moran’s I and Geary’s C are used to detect spatial dependence and identify agglomerations along a clearly defined space, which measure the correlation of each explanatory variable Xi with the rest of the regions with which they are linked.
This paper starts off considering the two basic models of spatial econometrics. The first one is a simple contagion model identifying diffusion effects between the studied phenomena: if the vicinity between municipalities with high levels of UBN Index constitutes an explanatory factor of poverty indices in its relationship with other variables. The second one is a spatial autoregressive dependence model.
Simple contagion implies that high UBN indices spread to contiguous municipalities, independently of the characteristics of the neighbouring municipalities. The spatial autoregressive model (SAR) seems to be the model that best describes the phenomenon:
Where Y is the dependent variable, X1 the matrix of explanatory variables, ρ the coefficient of spatial lag that measures the intensity of the interdependencies of the neighbouring UBN indices on the index of each municipality, and W the matrix of spatial weights that reflect the mutual influences between municipalities, and that is equal to:
Where W is a squared non-stochastic matrix whose elements represent the interdependency between the pair of municipalities i and j, N equal to the number of municipalities. The definition of the weight
has a value of 1 if the municipalities i and j share a frontier, and 0 if they do not share a frontier.
In the second case, the interdependency of the variables that explain the levels of the UBN Index are discussed. The model that reflects this effect is the spatial autoregressive error (SARE) model, whose specification is:
Where the term ε incorporates a structure of autoregressive spatial dependence under a first-order Markov scheme, and λ is the parameter of the disturbance term, which is interpreted as the effect or random shocks that the spatially correlated exogenous variables of the model transmit to the whole system.
A generalized version of the two specifications mentioned above is the spatial autoregressive model with spatial autoregressive errors (SARAR), developed by Anselin and Florax (Citation1995). This model allows identifying spillovers and spatial autocorrelation of the errors (correlation between unobservable variables), simultaneously.
The SARAR model is described thus:
To build the model, we take as basis the explanatory variables of poverty that have been applied in identifying advantages or disadvantages of opportunities (Ferreira & Meléndez, Citation2012), as well as determinants of poverty in Colombia (Núñez et al., Citation2005). These variables are gathered in Table . Thus, the level of the UBN Index is being explained as a function of variables of social, economic, and demographic circumstances that have an important effect on the poverty situation of the population. These predetermined circumstances are not controlled by the individual, such as is the case of the place of birth and belonging to an ethnic group. The variable share of urban population allows identifying to what degree the urbanization process reaches greater coverage of basic services. Moreover, the NEG predicts the effects on wages and productivity that larger population concentrations have on big cities, and consequently on poverty. The share of ethnic minorities allows estimating the approximate impact of segregation towards these communities, which are concentrated in areas of generalized poverty. The variable unemployment reflects until which point the lack of opportunities and human capital contribute to increasing the levels of poverty. The share of current incomes over the total incomes of the studied municipalities allows measuring the effects of the distribution of the resources transferred by the national government. The variable territorial extension measures the size of each municipality.
Table 1. Variables of the model
Identifying the model that best estimates the effects of the variables on the UBN Index, and detecting spatial autocorrelation implies calculating the “local Moran’s I” statistic that allows a diagnosis of spatial autocorrelation in the data. For the present case, the statistics based on the Lagrange multiplier are calculated for the lag (LM-LAG) and for the error (LM-ERR). The model will be chosen depending on the statistic that presents greater statistical significance. The calculation of these statistics diagnoses possible specification errors of an econometric model due to the presence of spatial dependence (Anselin, Citation1988). The linear model is estimated through ordinary least squares (OLS), spatial lag models (SAR), spatial error models (SARE), and the spatial autoregressive model with spatial autoregressive errors (SARAR), together with the pertinent statistics to analyse and compare the one that best fit to the data.
4. Results
4.1. Exploratory analysis of spatial distribution of some municipal social indicators
The exploratory analysis of the spatial data is developed in this section to describe the spatial distribution of the variables studied. The analysis of this data seeks to identify groups of municipalities that share values of the variables described in Table to detect trends, which allow identifying causal relationships, patterns throughout the territory between variables that have similar spatial distributions.
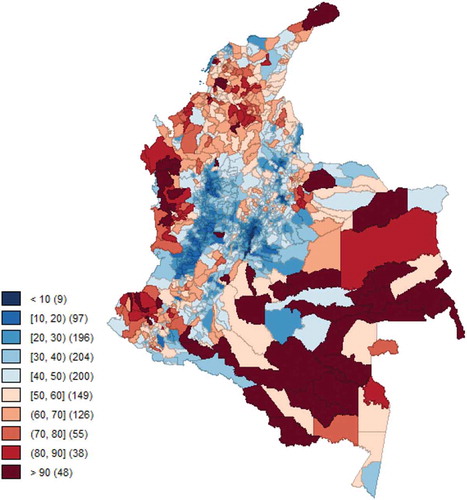
When observing Map , the concentration of high UBN Indices stands out in the Amazon Region, Orinoquía Region, Nariño, Chocó, and a large portion of the country’s Caribbean region. The Andean Region, mainly composed of Cundinamarca, Boyacá, and Santander, as well as the Coffee Belt, present the lowest indices. These noteworthy differences in the development of the regions of the country follow a clear centre-periphery pattern, in which regions coexist with higher development surrounded by backward regions and immersed in poverty. The influence of poor municipalities on their neighbours has been analysed by Pérez (Citation2005) arguing that municipalities of Antioquia adjoining Chocó, Córdoba, and south of Bolívar (economically disadvantaged regions) tend to be poorer, with lower levels of UBN Indices than those presented within the relatively highly developed department of Antioquia itself. Similarly, municipalities that surround or are nearby the thriving capital city of Bogotá present lower UBN Indices and higher quality of life indices (Mesa De Planificación Regional MPR, Centro De Las Naciones Unidas Para El Desarrollo Regional Uncrd). As shown in Map , the distribution of the housing deficit seems to follow a similar pattern and is highly correlated to the UBN Index although differences in intensity are present, particularly in Chocó, whose housing deficit surpasses 90% of the households in the department.
Map 1. UBN at a municipal level in Colombia. Year 2005
Map 2. Housing deficit at a municipal level in Colombia. Year 2005
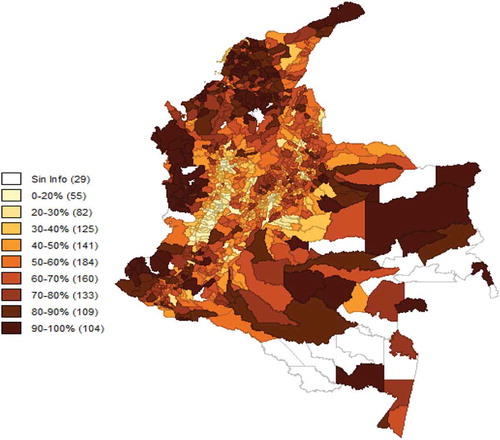
Solving the housing deficit would contribute to improving the quality of life by enhancing the conditions of human capital. Its effects on growth are evidenced in improvements in labour productivity, an increase in household income and aggregate demand, as well as the linkages between the construction sector and other sectors of the economy (Torres, Citation2009). Between 1993 and 2005, the estimated housing deficit in Colombia decreased by 17.4 percentage points implying that 25 years would be needed to solve the existing housing deficit in 2005 (Centro De Estudios De La Construcción y El Desarrollo Urbano y Regional Cenac, Citation2005).
The average territorial size of the municipalities located in the mountainous regions of the high Andes is smaller than that of other areas. Most the Colombian population inhabits mountainous regions and owns relatively small plots of land. Nevertheless, due to the abundance of resources for agricultural exploitation, these rather small plots of land began to be increasingly productive generating economies of scale, attracting labourers and contributing to the growth of urban centres (Bushnell, Citation1993; Safford, Citation1976). Transportation costs and access difficulties would explain the emergence of this large number of small-sized urban centres (Fujita & Krugman, Citation2004).
Map presents the agglomeration of the population measured by the number of inhabitants per km2. It is possible to observe that large population agglomerations exist in the mountainous regions of the high Andes and some areas of the Caribbean coast. The rain forest regions of the Amazon, Orinoquía, and the Pacific are home to a lower concentration of population. In 2005, Colombia’s population density was 44.7 inhabitants per km2, with marked contrasts between the country’s different regions.
Map 3. Population concentration at a municipal level in Colombia. Year 2005
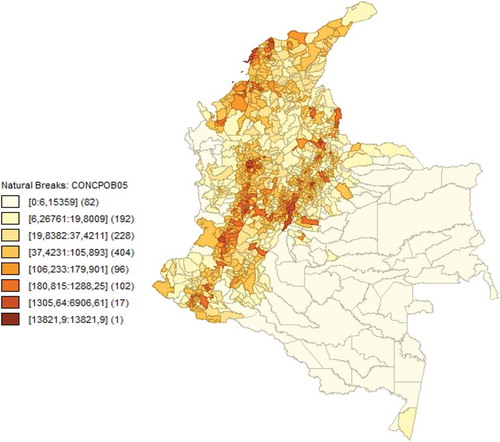
According to Bateman and Martínez (Citation2011), the “Urban primacy index”, which measures the relationship of the largest city’s population size with respect to the following three cities in size, has increased in the last 50 years. However, this index has recently exhibited stable growth rates as well as evidencing greater growth for Bogotá and for third-level cities versus second-level cities. The growth of intermediate cities has been parallel to the country’s metropolis development or conurbation process, which has generated a network of small cities around the larger urban centres due to agglomeration economies that outgrow towards neighbouring territories due to increasing congestion costs in the centre (Vélez, Citation2008). Moreover, Galvis (Citation2001) observed that the population distribution and economic activity in Colombia differs to that of other countries, where it is suggested that individuals located less than 100 km away from the maritime frontier enjoy higher indices of human development, population density, and economic activity. In Colombia, on the contrary, the coastal region is relatively poorer and has a lower population density as compared to the country’s central region.
4.2. Spatial multivariate exploratory analysis
Based on municipal UBN Index data and using spatial statistical tools, tests were conducted suggesting the existence of a spatial structure of multidimensional poverty in Colombia.
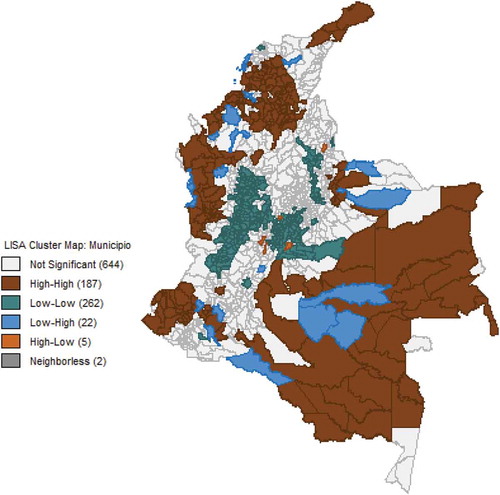
The local Moran’s I statistic was calculated to confirm probable spatial autocorrelation and identify spatial clusters around which phenomena of high and low UBN Indices are concentrated. The result (Map ) permits identifying concentrations of areas of high UBN Indices (category High-High) in the southeast of the country, in Choco, Nariño region, and regions of Atlántico, Bolívar, and La Guajira. Moreover, three big clusters of low UBN Indices are identified in the Coffee Belt, in Cundinamarca-Boyacá, and Santander.
Map 4. UBN Index Cluster at the municipal level in Colombia. Year 2005
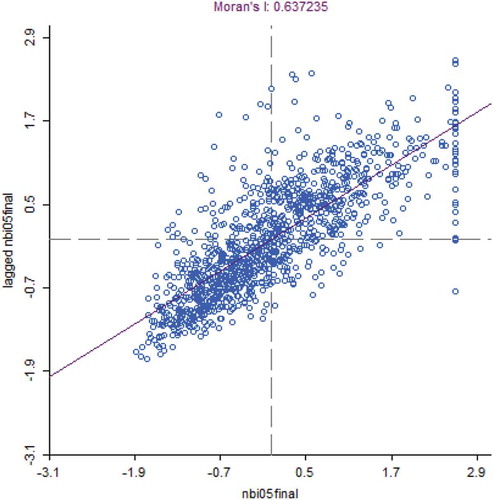
The Global Moran’s I statistic obtained is 0.64 (Graph ), which indicates that the data present high positive spatial autocorrelation. In other words, around the areas with high UBN Indices it is likely to find areas with high UBN Indices, and areas with low UBN Indices around low UBN Indices. It is possible to identify three different concentration areas of low UBN Indices: Coffee Belt region, Cundiboyacense region, and Santander region. These findings are coherent with those found by Pérez (Citation2005), who concludes that the level of poverty of a municipality depends not only on its own location, but also that of its neighbours. Furthermore, Galvis and Meisel (Citation2012) pointed out that there exists a persistent level of poverty in some municipalities, which means that the levels of poverty have not decreased between the inter-census periods.
Graph 1. Moran’s diagram of dispersion. First-order spatial lag of 2005 UBN
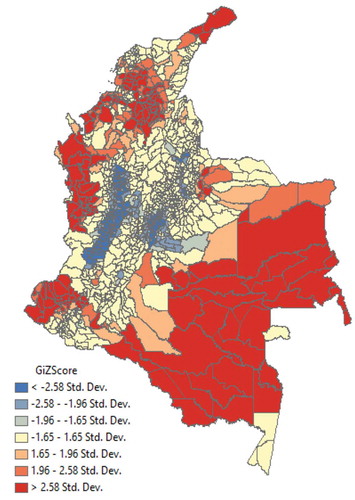
Getis-Ord G statistics identify a series of weighted regions allowing the establishment of hot and cold spots at different significance scales (Map ). Its distribution is similar to that of the Local Moran’s I statistic, and it reinforces the latter findings regarding the presence of strong spatial structure of poverty.
Map 5. Hot spots (red) of UBN Indices at a municipal level in Colombia. Years 2005
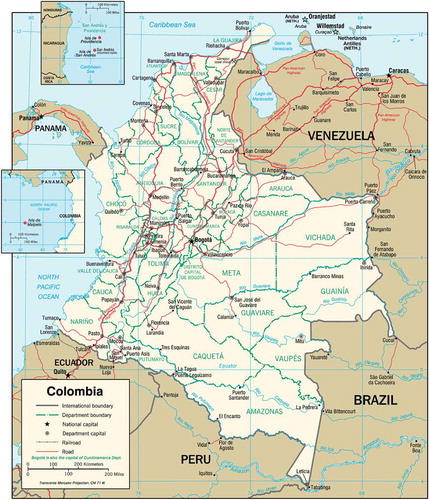
Map 6. Map Colombia (Political)
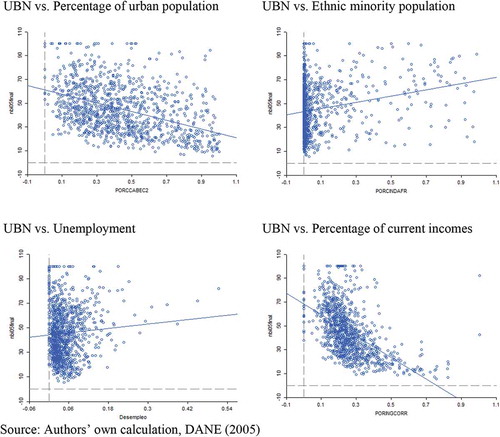
Graph 1. illustrates the relationships between UBN Indices, and the socioeconomic variables listed in Table .
By establishing the relationship between the UBN Index and the above variables, it was found that the share of the urban population is related to lower levels of UBN Indices, while the share of the population belonging to ethnic minorities and the level of unemployment, contribute to an increase in the UBN Index. With respect to the indicator of the percentage of current incomes divided by the total incomes of the municipalities, it is possible to observe that there is a negative relationship, and that insofar as the municipalities depend to a greater extent on the transfer resources, higher indexes of UBN are reported.
Graph 2 Diagrams of dispersion of UBN Indices and socioeconomic variables
4.3. Confirmatory analysis. Spatial econometric models
The estimation of the above applied statistical models evidences the existence of spatial autocorrelation in the data creating the need of implementing a spatial econometric model: either a spatial lag, spatial error, or spatial autoregressive with spatial autoregressive errors model. Both Moran’s I and Getis-Ord G statistics (see Annex and Annex ) reject the null hypothesis of absence of spatial autocorrelation, provided that the lag model’s Lagrange multiplier is greater than that of the spatial error model. Once these models were run, the statistical tests on their residuals evidenced the persistence of a non-random pattern necessitating the use the SARAR model (Kelejian & Prucha, Citation1998, Citation1999, Citation2007, Citation2010). These models aim to identify the importance of contagion effects in the high and low values of UBN Indices; and measures the influence of the socioeconomic variables that are associated with this phenomenon.
These models illustrate the importance of the diffusion effects of the UBN Indices at a municipal level. Moreover, they allow claiming that poverty is not randomly distributed in the territory, it deals with a phenomenon with strong geographical implications. The lambda and rho coefficients were significant in three out of four models confirming the existence of spatial effects on poverty .
Table presents the breakdown of the direct and indirect spatial effects of the lag model, and spatial autoregressive with spatial autoregressive errors model. Around one-third of the effects on the UBN Indices are direct, while the larger part corresponds to indirect diffusion effects on the rest of the municipalities.
Table 2. Spatial and classical econometric models
Table 3. Breakdown of the effects
The interpretation of the diffusion of multidimensional poverty to neighbouring municipalities is explained by taking the concept of poverty traps as reference (Cuesta & Nuñez, Citation2006). In fact, the UBN Indices gather some of these variables, such as low household financial resources, lack of schooling, undignified housing conditions and health precariousness. Other important findings highlight that high UBN Indices are related to high percentages of rural population evidenced by the significant and negative coefficient of the variable urban population. In developing countries, rural areas suffer precariousness in basic services, low incomes, low quality of primary education and communication difficulties, which force inhabitants to move to urban areas in search for better opportunities (World Bank, Citation2009).
In the case of Colombia, rural-urban migration is not rooted in the cities’ attractiveness of the cities, but rather in population displacement caused by the violence inherent to the Colombian armed conflict. The share of the population belonging to ethnic minorities with respect to the total population in the municipalities is related to higher values of UBN Indices. Indeed, Colombia suffers not only from marked inequality in income and land distribution, but also from problems of segregation and marginality in the Pacific and Caribbean regions that manifest themselves in generalized poverty. The departments of Chocó and La Guajira are outstanding examples of how poverty particularly affects indigenous and Afro-Colombian populations.
The model indicates that unemployment increases the levels of municipal UBN Indices and that this in turn contributes to the lack of basic goods and services in Colombia. Núñez et al. (Citation2005) highlight similar findings. Moreover, Ferreira and Meléndez (Citation2012) performed an exercise in which they studied economically disadvantaged populations that have the following characteristics: 100% came from homes with parents without schooling, 100% were born in municipalities of less than 50 thousand inhabitants, 60.3% was born in the Atlantic region, 39.7% in the Pacific region, and 60.5% in the rural area. Of the 25% of the economically advantaged population, 93.4% does not belong to an ethnic minority.
The share of current incomes with respect to the total incomes per municipality shows an inverse relationship with UBN Indices, indicating that the degree of dependence of the income of municipalities with respect to transfers from the national government have a negative impact on the UBN Indices. A greater share of current income can be thought of as a form of territorial autonomy because the remainder of the income is mainly derived from national government transfers attaching a specific destination to the spending that might not necessarily be targeted to combat poverty. A clear relationship exists between the level of current incomes and the economic and social state of the municipality insofar as the territorial entities with higher levels of tax receipts are also the ones with greater economic activity. The Colombian strategy to reduce regional inequalities relies on a distributive system of transfers promoting equity among the different regions.
Nevertheless, Barón and Meisel (Citation2003) argue that this transfer system has been unsuccessful in reducing inequality among the regions because in Colombia spending decisions have favoured operating expenses over investment expenses. Wright and Moyano (Citation2015) evidence that despite the improved distribution of royalties in Colombia, these have not translated into a reduction in poverty in the Colombian Caribbean due to the destination that they have had, practically flowing only towards the infrastructure sector.
Finally, it was found that the largest municipalities in terms of extension suffer the greatest deficiencies reflected in the country’s southern municipalities and in some areas of the Chocó region (dominated by rain forest) and the Caribbean Coast, which are larger in extension than the central region. Several realities explain this finding: low basic services, communications (García Alonso et al., Citation2020), and financial services infrastructure (Thoene & Turriago-Hoyos, Citation2017), which grow more expansive in relation to the distance from the population nuclei, as well as less land productivity.
5. Conclusions
This research article sought to specify and measure the determinants of multidimensional poverty in Colombia using the Unsatisfied Basic Needs (UBN) Index based on information from the latest available 2005 population census applying a spatial econometrics approach. An exploratory analysis of the spatial distribution of the UBN and a confirmatory analysis through spatial models were conducted using municipalities as the unit of analysis.
The principal findings of this research that need to be emphasised are as follows:
A first result allows for an understanding of the distribution of the population’s economic activity, and of poverty, suggesting in a central-periphery distribution as proposed by NEG. Poverty autocorrelation is confirmed on neighbouring municipalities and areas of concentration of high UBN Indexes in Chocó, the Caribbean coast, and the south of the country. The statistical tests identify that high levels of UBN Indexes spread to adjoining municipalities, independently of their characteristics (Bushnell, Citation1993; Pérez, Citation2005).
The spatial autoregressive with spatial autoregressive errors model shows that the UBN Indexes of the municipalities are explained by indicators intrinsic to each municipality, while the largest portion of the UBN Indexes comes from indicators of neighbouring municipalities suggesting the existence of geographic poverty traps that reinforce each other (Pérez, Citation2005).
The country’s so-called development poles—Bogotá, Barranquilla, Medellín, Cali, and Bucaramanga—exhibit positive effects on the quality of life of neighbouring municipalities due to the spill over effects that they generate.
The region’s characteristics and their socioeconomic conditions have an important influence on the municipal level of poverty. Unemployment constitutes the variable that most affects the levels of poverty, followed by the share of urban population in the municipality.
Belonging to an ethnic group has negative effects on quality of life, which can be explained both by segregation problems and by institutional weakness in these regions (Ferreira & Meléndez, Citation2012; Núñez et al., Citation2005). The inefficient allocation of transfer resources and low tax collection capacity contribute to the persistence of regional imbalances.
The model’s results suggest that the current structure of SGP and of the tax collections of the territorial entities reinforce the inequalities (Barón & Meisel, Citation2003; Wright & Moyano, Citation2015). Only municipalities with positive economic conditions generate incomes that can be used in social investment.
Despite the scope and possibilities, spatial analysis and the development of spatial models suffer from limitations such as the availability of information at a geographical level—due to their low frequency of calculation—that hinders the temporal monitoring of the variables and the analysis of a greater geographical disaggregation. This is a particularly relevant and applicable observation for the case of Colombia. Nevertheless, there is great potential in the development of this type of analysis and to identify potentially testable hypotheses regarding unsatisfied basic needs in Colombia, which could subsequently be related directly to the findings of the existing empirical literature, just as it occurs in other countries such as Germany or the United States to study new subject matters like criminality and industrial clusters (Arbia et al., Citation2007; Broekel et al., Citation2015; Chung & Hewings, Citation2015; Fisher & Harrington, Citation1996).
Author statement
Álvaro Turriago-Hoyos, William Andrés Martínez Mateus and Ulf Thoene have worked on advancing interdisciplinary research on socio-economic development against the background of the Colombian peace process since 2015.
Additional information
Funding
References
- Angulo, R., Díaz, Y., & Pardo, R. (2016). The Colombian multidimensional poverty index – Measuring poverty in a public poverty context. Social Indicators Research, 127(1), 1–19. https://doi.org/10.1007/s11205-015-0964-z
- Anselin, L. (1988). Lagrange multiplier test diagnostic for spatial dependence and spatial heterogeneity. Geographical Analysis, 20(1), 1–17. https://doi.org/10.1111/j.1538-4632.1988.tb00159.x
- Anselin, L., & R. Florax (1995). Introduction. In L. Anselin and R. Florax (Eds.), New Directions in Spatial Econometrics (pp. 3–18). Berlin: Springer-Verlag.
- Anselin, L. (1998). Spatial econometrics – Methods and models. Kluwer Academia.
- Arbia, G., Espa, G., & Quah, D. (2007). A class of spatial econometric methods in the empirical analysis of clusters of firms in the space. Empirical Economics, 34(1), 81–103. https://doi.org/10.1007/s00181-007-0154-1
- Arias, J., & Fortich, F. (2010). El panorama teórico de la economía regional y los modelos de análisis territorial. Finanzas y Política Económica, 2(2), 9–26. https://www.redalyc.org/pdf/3235/323527254002.pdf
- Avendaño, A. (2008). Identificación de subcentros de empleo y estimación de funciones de densidad para Bogotá D.C. Universidad Autónoma de Barcelona.
- Barón, J., & Meisel, A. (2003). La descentralización y las disparidades económicas regionales en Colombia en la década de 1990. Documento de Trabajo sobre Economía Regional 36. Banco de la República.
- Bateman, A., & Martínez, J. (2011). Economías de aglomeración – Una explicación a la distribución espacial de Bogotá. Secretaría de Desarrollo Económico.
- Behrens, K., & Thisse, J. (2007). Regional economics: A new economic geography perspective. Regional Science and Urban Economics, 37(4), 457–465. https://doi.org/10.1016/j.regsciurbeco.2006.10.001
- Bernal-Torres, C., Peralta-Gómez, M., & Thoene, U. (2020). Street vendors in Bogotá, Colombia, and their meanings of informal work. Cogent Psychology, 7(1), 1726095. https://doi.org/10.1080/23311908.2020.1726095
- Blommestein, H. (1983). Specification and estimation of spatial econometric models. Regional Science and Urban Economics, 13(2), 251–270. https://doi.org/10.1016/0166-0462(83)90016-9
- Broekel, T., Brenner, T., & Buerger, M. (2015). An investigation of the relation between cooperation intensity and the innovative success of German regions. Spatial Economic Analysis, 10(1), 52–78. https://doi.org/10.1080/17421772.2014.992359
- Brueckner, J., & Fansler, D. (1983). The economics of urban sprawl – Theory and evidence on the spatial sizes of cities. Review of Economics and Statistics, 65(3), 479–482. https://doi.org/10.2307/1924193
- Bushnell, D. (1993). The making of modern Colombia – A nation in spite of itself. University of California Press. https://www.redalyc.org/pdf/413/41316760002.pdf
- Centro De Estudios De La Construcción y El Desarrollo Urbano y Regional Cenac. (2005). Evolución del Déficit Habitacional en Colombia – 1993-2005. CENAC.
- Christaller, W. (1935). Die zentralen Orte in Süddeutschland. Fischer Verlag.
- Chung, S., & Hewings, G. (2015). Competitive and complementary relationship between regional economies – A study of the Great Lake states. Spatial Economic Analysis, 10(2), 205–229. https://doi.org/10.1080/17421772.2015.1027252
- Cicowiez, M., Gasparini, L., & Sosa, W. (2012). Pobreza y desigualdad en América Latina – Conceptos, herramientas y aplicaciones. In CEDLAS. Universidad Nacional de La Plata.
- Cliff, A., & Ord, J. (1981). Spatial processes, models, and applications. Pion.
- Cohen, J., & Morrison-Paul, C. (2009). Spatial and supply/demand agglomeration economies – State- and industry-linkages in the U.S. food system. In G. Arbia & G. Baltabi (Eds.), Spatial economics (pp. 263–281). Physica-Verlag.
- Cuesta, L., & Nuñez, J. (2006). Las trampas de pobreza en Colombia: ¿qué hacer? Diseño de un programa contra la pobreza extrema. Documento CEDE: 2006-19. Universidad de los Andes.
- De Mattos, C. (2010). Una nueva geografía latinoamericana en el tránsito de la planificación a la gobernanza, del desarrollo al crecimiento. EURE, 36(108), 167–179. https://scielo.conicyt.cl/pdf/eure/v36n108/art10.pdf
- Departamento Administrativo Nacional De Estadística (DANE). (2005). Censo General 2005. DANE. Retrieved March 10, 2017, from http://systema59.dane.gov.co/cgibin/RpWebEngine.exe/PortalAction?&MODE=MAIN&BASE=CG2005AMPLIADO&MAIN=WebServerMain.inl
- Departamento Administrativo Nacional De Estadística (DANE). (2018, November 10). Boletín NBI Censo 2005. DANE. https://www.dane.gov.co/files/investigaciones/boletines/censo/Bol_nbi_censo_2005.pdf
- Departamento Nacional De Planeación (DNP) (2010). Ejecuciones presupuestales reportadas por los municipios. Bogotá, Colombia: DNP. Retrieved March 10, 2017, from https://www.dnp.gov.co/programas/desarrollo-territorial/Paginas/ejecuciones-presupuestales.aspx.
- Estrada, L., & Moreno, S. (2013). Análisis espacial de la pobreza multidimensional en Colombia a partir del censo de población de 2005. Revista ib, 3(1), 205–228. https://ideas.repec.org/p/col/000482/012677.html
- Feres, J., & Mancero, X. (2001). Enfoques para la medición de la pobreza – Breve revisión de la literatura. Estudios Estadísticos y Prospectivos: 4. CEPAL.
- Ferreira, F., & Meléndez, M. (2012). Desigualdad de resultados y oportunidades en Colombia – 1997-2000. Documento CEDE: 2012-40. Universidad de los Andes.
- Fisher, J., & Harrington, J. (1996). Product variety and firm agglomeration. RAND Journal of Economics, 27(2), 281–309. https://doi.org/10.2307/2555927
- Fujita, M., & Krugman, P. (2004). La nueva geografía económica – Pasado, presente y futuro. Investigaciones Regionales, 4, 177–206. https://www.redalyc.org/pdf/289/28900409.pdf
- Galvis, L. (2001). Topografía económica de Colombia. In Documentos de Trabajo sobre Economía Regional. Bogotá, Colombia: Banco de la República.
- Galvis, L., & Meisel, A. (2012). Convergencia y trampas espaciales de pobreza en Colombia – Evidencia reciente. In Documentos de Trabajo sobre Economía Regional. Cartagena, Colombia: Banco de la República.
- García Alonso, R., Caldas, J., Dávila, D., & Thoene, U. (2020). Políticas públicas de inclusión digital en Colombia – Una evaluación del plan Vive Digital I (2010-2014). Revista Espacios, 41(7), 1–13. http://www.revistaespacios.com/a20v41n07/20410713.html
- Instituto Geográfico Agustín Codazzi IGAC. (2010). Servicios web geográficos IGAC. Bogotá, Colombia: Instituto Geográfico Agustín Codazzi. Retrieved March 10, 2017, from http://www.igac.gov.co/wps/portal/igac/raiz/iniciohome/MapasdeColombia/Descargas
- Kelejian, H. H., & Prucha, I. R. (1998). A generalized spatial two-stage least squares procedure for estimating a spatial autoregressive model with autoregressive disturbances. Journal of Real Estate Finance Economics, 17(1), 99–121. https://doi.org/10.1023/A:1007707430416
- Kelejian, H. H., & Prucha, I. R. (1999). A generalized moments estimator for the autoregressive parameter in a spatial model. International Economic Review, 40(2), 509–533. https://doi.org/10.1111/1468-2354.00027
- Kelejian, H. H., & Prucha, I. R. (2007). HAC estimation in a spatial framework. Journal of Econometrics, 140(1), 131–154. https://doi.org/10.1016/j.jeconom.2006.09.005
- Kelejian, H. H., & Prucha, I. R. (2010). Specification and estimation of spatial autoregressive models with autoregressive disturbances. Journal of Econometrics, 157(1), 53–67. https://doi.org/10.1016/j.jeconom.2009.10.025
- Kosfeld, R., & Lauridsen, J. (2009). Dynamic spatial modelling of regional convergence processes. In G. Arbia & G. Baltabi (Eds.), Spatial economics (pp. 245–261). Physica-Verlag.
- Krugman, P. (1991). Increasing returns and economic geography. Journal of Political Economy, 99(3), 483–499. https://doi.org/10.1086/261763
- Krugman, P. (1997). The self-organizing economy. Wiley-Blackwell.
- Krugman, P. (1998). What’s new about the new economic geography? Oxford Review of Economic Policy, 14(2), 7–17. https://doi.org/10.1093/oxrep/14.2.7
- Le Gallo, J., & Chasco, C. (2008). Spatial analysis of urban growth in Spain, 1900-2001. Empirical Economics, 34(1), 59–80. https://doi.org/10.1007/s00181-007-0150-5
- Lösch, A. (1938). The nature of economic regions. Southern Economic Journal, 5(1), 71–78. Bogotá, Colombia: Ministerio de Educación Nacional de Colombia. https://doi.org/10.2307/3693804
- Moran, P. (1948). The interpretation of statistical maps. Journal of the Royal Statistical Society, 10(2), 243–251. https://doi.org/10.1111/j.2517-6161.1948.tb00012.x
- Moreno, R., & Vayá, I. (2000). Técnicas econométricas para el tratamiento de datos espaciales – La econometría espacial. Edicions de la Universitat de Barcelona.
- Núñez, J., & Carvajal, A. (2007). ¿Cómo romper las trampas de la pobreza en Buenaventura? Propuestas desde las comunidades y las instituciones. Cuadernos PNUD. United Nations.
- Núñez, J., Ramírez, J., & Cuesta, L. (2005). Determinantes de la pobreza en Colombia, 1996-2004. Documento CEDE: 2005-60. Universidad de los Andes.
- Pérez, G. (2005). Dimensión espacial de la pobreza en Colombia. Documentos de Trabajo sobre Economía Regional. Banco de la República.
- Ramírez, J. M., Díaz, Y., & Bedoya, J. G. (2014). Convergencia social en Colombia: El rol de la geografía económica y de la descentralización. Fedesarrollo.
- Rawls, J. (1999). A theory of justice. Belknap Press.
- Safford, F. (1976). The ideal of the practical – Colombia’s struggle to form a technical elite. University of Texas Press.
- Sampedro, J. (2009, December). La ley de Zipf. El País, 13, 2009. https://elpais.com/diario/2009/12/13/domingo/1260678633_850215.html
- Sánchez, J., & Zofío, J. (2009). Espacio, distancia y localización – Hacía la Nueva Economía Geográfica. Revista ICE, 848, 9–27. https://dialnet.unirioja.es/servlet/articulo?codigo=3009936
- Santos, E., Carvalho, I., & Barreto, R. (2017). Multidimensional poverty in the state of Bahia – A spatial analysis from the censuses of 2000 and 2010. Revista De Administração Pública, 51(2), 240–263. https://doi.org/10.1590/0034-7612152341
- Scott, A., & Storper, M. (2003). Regions, globalization, development. Regional Studies, 37(6–7), 579–593. https://doi.org/10.1080/0034340032000108697a
- Sen, A. (1999). Development as freedom. Oxford University Press.
- Student. (1914). The elimination of spurious correlation due to position in time or space. Biometrika, 10(1), 179–180. https://doi.org/10.2307/2331746
- Súlez, S. (2014). Colombia regional y geográfica: Un análisis de las diferencias regionales en pobreza y desigualdad con técnicas econométricas espaciales. Universidad del Valle.
- Thoene, U., & Turriago-Hoyos, Á. (2017). Financial inclusion in Colombia – A scoping literature review. Intangible Capital, 13(3), 582–614. https://doi.org/10.3926/ic.946
- Torres, J. (2009). Desarrollo social – La pobreza urbana y las condiciones de vivienda. CENAC.
- University Of Texas At Austin – Perry Castañeda Library Map Collection (2008). Map Colombia (Political). Austin, USA: University of Texas at Austin. https://legacy.lib.utexas.edu/maps/americas/colombia_pol-2008.pdf
- Vélez, J. (2008). Los procesos de aglomeración en Colombia a la luz de la nueva geografía económica. Ensayos sobre Política Económica, 27(58), 106–139. https://doi.org/10.32468/Espe.5803
- Villarraga, H. G., Sabater, A., & Módenes, J. A. (2014). Modelling the spatial nature of household residential mobility within municipalities in Colombia. Applied Spatial Analysis and Policy, 7(3), 203–223. https://doi.org/10.1007/s12061-014-9101-7
- Vivas, H. (2013). Persistencia de la segregación residencial y composición del capital humano por barrios en la ciudad de Cali. Ensayos sobre Política Económica, 31(70), 121–155. https://doi.org/10.1016/S0120-4483(13)70031-9
- Wang, Y., Chen, Y., Chi, Y., Zhao, W., Hu, Z., & Duan, F. (2018). Village-level multidimensional poverty measurement in China – Where and how. Journal of Geographical Sciences, 28(10), 1444–1466. https://doi.org/10.1007/s11442-018-1555-0
- World Bank. (2009). Informe sobre desarrollo humano. Superando barreras – Movilidad y desarrollo humano.
- Wright, P., & Moyano, L. (2015). Regalías y pobreza en el Caribe Colombiano. Observatorio del Caribe Colombiano.
- Zipf, G. (1949). Human behaviour and the principle of least effort – An introduction to human ecology. Addison-Wesley Press.
Appendix 1
ANNEX 1. Moran’s I Index. ANNEX 2. Getis-Ord G Index.
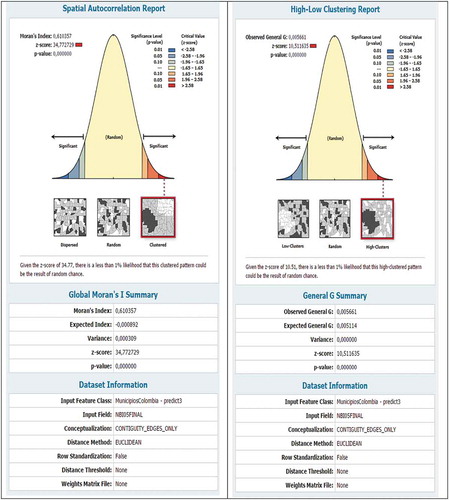
Source: Authors’ own estimations.