
 ?Mathematical formulae have been encoded as MathML and are displayed in this HTML version using MathJax in order to improve their display. Uncheck the box to turn MathJax off. This feature requires Javascript. Click on a formula to zoom.
Abstract
Sector investing aims to guide investors in identifying undervalued securities. Knowing which sectors flourish at different phases of the business cycle, investment returns may be boosted by increasing holdings in securities from strengthening sectors and reducing holdings in weakening ones. As the business cycle phase changes, security rotation can continuously improve portfolio returns. Sector investing is, however, heavily dependent upon accurate phase identification and therefore highly vulnerable to phase misidentification. Investing in securities which do not thrive at the phase identified could lead to inferior portfolio returns or even losses. There is ample precedent in the literature regarding the usefulness of Fourier analysis in identifying business cycle frequencies. This article contributes by installing this approach for the first time to augment existing sector investing methodology. We confirm that the sector rotation approach does generate statistically significant outperformance (relative to local market index performance) in South Africa. This work adds to the current dearth of theoretical and empirical research regarding sector rotation in emerging economies, so it can also be beneficial for researchers interested in similar milieus.
PUBLIC INTEREST STATEMENT
The market cycle for most countries spans over several (between five and 15) years. Different market sectors flourish at different times of these cycles (financial in the early bull phase and energy at the cycle’s peak for example). Stovall (Citation1995) introduced a sector rotation investment approach in which security holdings are increased during their prosperous phases and reduced when other sectors are favoured. The method has proved to be popular in developed markets but has been sparsely researched in developing economies. Accurate identification of the noisy market cycle has also hampered progress in the field. We link a robust cycle frequency identification framework (Fourier analysis) with Stovall’s methodology to identify timing of sector superior performance and a mean-variance portfolio optimisation approach to generate portfolios which capitalise on the strengths of all these methods. Our statistical results show superior portfolio performance during all cycle phases.
Competing interests
The authors declare no competing interests.
1. Introduction
Casarin and Trecroci (Citation2006:2) asserted two main reasons why asset prices experience a boom in the market. The first is a permanent increase in total factor productivity, which can result in higher earnings levels and thus to higher security market valuations. The second is non-fundamental in nature: shocks in housing or equity markets (due to over-optimism about future returns and productivity) resulting in significant changes in short to medium term. These underlying reasons not only contribute to security price volatility but also reduce investors’ ability to successfully identify under- and over-valued securities. This then impedes optimal (in the sense of return maximisation) portfolio allocation. More volatile security prices can be the direct result of greater uncertainty about earning prospects, making it difficult to identify superior-performing securities (Casarin & Trecroci, Citation2006). Understanding the origin of volatility is, therefore, an important factor to consider in investment and asset allocation decisions (Bekaert & Harvey, Citation1997).
Asset valuation undertaken by Dzikevičius and Vetrov (Citation2012) indicates that security prices and the state of the economy are positively correlated. However, Andersen et al. (Citation2007) argued that the equity market reacts differently to good and bad news, depending on the stage of the business cycle and found that “good news” during expansion phases influences securities negatively but has an opposite effect on securities during contraction phases. Dzikevičius and Vetrov (Citation2012) found that an increase in total security returns was the result of an expanding economy. These expectations contribute to increased volatility, the outcome of which, due to the global financial crises, has led to significant changes in market conditions. This has made the business cycle an important investment tool for portfolio assembly. Indeed, using the business cycle to analyse global factors and identify superior risk-adjusted securities, forms the basis of the top-down investment approach. This is a more logical investment strategy than the bottom-up approach is and has also proved to be an efficient way of formulating an investment strategy (Crescenzi & Rodríguez-Pose, Citation2009; Reilly & Brown, Citation2012). In this work, we focus on the top-down investment approach which supports the belief that both the economy and industry have a significant impact on the total returns of securities, whereas the bottom-up approach is more of a stock-picking approach, designed to identify undervalued securities relative to their market price and might provide the investor with superior returns, regardless of the industry and market outlook (Reilly & Brown, Citation2012).
The top-down approach uses broad macroeconomic indicators such as Gross Domestic Product (GDP) exchange rates, inflation, and interest rates (Reilly & Brown, Citation2012). A change in these macroeconomic indicators translates into disparities in the “fundamentals” that affect asset prices (Dzikevičius & Vetrov, Citation2012). These macroeconomic indicators have a direct result on how asset allocation is made, based on the economic prospects of a country (Reilly & Brown, Citation2012). The first step of the top-down approach is therefore an investigation into macroeconomic indicators. The second step requires an industry analysis: sectors believed to gain from economic prospects must be identified. During this step, sufficient seasonally adjusted quarterly GDP data are used to construct at least one full economic cycle: this serves as a foundation for the identification of the different phases. Economic cycle phases can change abruptly if the economy experiences an unanticipated shock (such as occurred with the 2020 COVID-19 pandemic). During certain phases of the cycle, certain sectors outperform the remainder of the market (), and the identification of these sectors at the correct phase of the cycle can serve as guidance to identify early buy signals which may, in turn, lead to superior returns (Emsbo-Mattingly et al., Citation2014).
Having identified the sectors believed to outperform the market and the periods in which they do so, individual securities from that section may be isolated and used to assemble an investment portfolio based on historical performances. The company valuation stage identifies undervalued companies which are expected to benefit most in that specific sector (Marx et al., Citation2010). Various performance measures may be used to establish performance superiority (Benson et al., Citation2008).
Among the potential problems that might manifest in the top-down investment approach is the incorrect identification of the business cycle and/or incorrectly distinguishing between the six different phases of the business cycle (early, middle and late bull and early, middle and late bear). Errors at this stage will lead to misallocating sectors and result in the inclusion of inferior securities. Such errors could lead to considerable losses, so such identification is a critical step in this analysis. We use Fourier analysis—which amongst others, isolates the underlying cycles (and thus cycle frequencies and amplitudes) present in noisy data to help with this problem.
A principal contribution stems from Fourier analysis which is here applied to both the market index and South African GDP data to determine the underlying frequency of the market/business cycle for the first time to isolate principal frequencies and identify turning points. The isolation of these turning points facilitates sector rotation implementation and these, in turn, provides considerably improved clarity regarding the assessment and identification of the six market phases suggested by Stovall (Citation1995).
The remainder of this article proceeds as follows: Section 2 presents the literature governing the history of sector investment theory and some of the procedures used for identifying market cycles. Section 3 establishes the data used and provides a background of the methodologies employed (e.g. cycle phase identification, individual security asset weight allocation (within the sector during its identified “optimal performance” phase of the market cycle) and performance assessment). The empirical results and discussion follow in Section 4 and Section 5 concludes.
2. Literature review
Thorpe (Citation2003:8) argued that no economy can grow forever and that eventually economic growth will diminish, followed by slowdown and contraction but we note that current thinking holds that it is possible that knowledge (for example, and other forms of human capital) may indeed lead to continuous economic growth (Cvetanović et al., Citation2019; Soyer et al., Citation2019). Dzikevičius and Vetrov (Citation2012) demonstrated that business cycles arise from cyclical changes in different macroeconomic forces in the aggregate economy. These macroeconomic forces are also directly accountable for the changes in the fundamentals that influence the asset’s prices. This prompts investors to constantly reallocate portfolio securities, based upon their changing risk profiles. Investors are thus obliged to trade, which causes security market prices and indices to fluctuate (Switzer & Picard, Citation2015).
Business cycles are the result of fluctuations of economic activity occurring in the economy. A full cycle comprises an expansion, contraction, recession, and recovery phases, with each phase seamlessly merging into the next (Hall et al., Citation2003). The sequence of changes is recurrent: the cycle phases repeat—with considerable noise—with a regular, measurable frequency. In an emerging economy like South Africa, business cycles can also last from 1 year to 12 years (Burns & Mitchell, Citation1946; SARB (South African Reserve Bank), Citation2010), but recent estimates have estimated about 7 years (Thomson & van Vuuren, Citation2016).
Venter (Citation2005) discusses the methodology used by the South African Reserve Bank (SARB) to identify business cycle turning points. This methodology included the use of three composite business cycle indicators and two diffusion indexes. Chevillon (Citation2009) drew on the research of Aron and Muellbauer (Citation2002) and established that multi-step estimation improved forecast accuracy. Bosch and Ruch (Citation2013) provided an alternative methodology to dating business cycle turning points in South Africa by using a Markov switching model and the Bry and Boschan (Citation1971) method to date the turning points and found that the model estimates generally coincided with the business cycle turning points determined by the SARB. The model was applied to GDP data, but also to 114 of the 186 stationary variables the SARB uses to date the business cycle (Bosch & Ruch, Citation2012). Using Principle Component Analysis (PCA) on these variables a more accurate measure of the business cycle turning points than using GDP data alone was obtained. Du Plessis et al. (Citation2014) developed a dynamic stochastic general equilibrium (DSGE) model for the South African economy. The model used Bayesian techniques to incorporate prior information about the economy into the parameter estimates. Its forecasting capability extends up to seven quarters and was tested against a panel of professional forecasters and a random walk.
Apart from the length of the cycle, there are various methods by which a phase can be determined, including when the next phase will arise. Most economists consider two consecutive quarters of negative real GDP growth as a flag for a recession (Claessens et al., Citation2009). However, Borio (Citation2012) argued that recessions should be defined as a substantial decline in the overall economy and economic activities. These declines last persist for several months and can be derived from real GDP, wholesale-retail sales, employment, real income and industrial production. Even though an economy may indicate signs of weakening in the months prior to the onset of a recession, the process of determining whether a country is, in fact, in a recession takes time. During the start of the recession phase, unemployment is usually low (and vice versa at the start of the expansion phase). Depressions depend on the recession’s severity and duration (Thorpe, Citation2003:8). Like recessions, no formal definitions for depressions exist, but they are generally considered to occur when a decline in GDP exceeds 10%, or where a recession lasts longer than 2 years (Claessens et al., Citation2009; NBER, Citation2012).
When recessions near their end, the outlook of the economy becomes more optimistic and cyclical industries being outperforming other industries because of available excess liquidity brought about by looser monetary policy (Jacobsen, Citation2010; Marx et al., Citation2010; Thorpe, Citation2003). Cyclical industries produce durable goods, so these are sensitive to macroeconomic conditions. The production of cyclical goods can be deferred, during recessions, to later stages of the cycle (Marx et al., Citation2010). Lower interest rates encourage investors to transfer wealth from low-yielding bonds into higher-yielding securities, increasing security prices. At the early stages of an economic cycle emerging from a recession, when the economy is only beginning to improve, security prices increase quickly (Bolten & Weigand, Citation1998).
Capital goods producers perform better later in the economic cycle. During the middle bull stage (), demand for capital increases, leading to a gradual increase in interest rates as inflation comes under pressure. The expectation of prosperous future earnings is driven by economic strengthening. The negative impact of interest rate increases during this stage is dominated by the positive impact of higher earnings expectations, leading to further increases in security prices, though not as rapidly as in the early bull stage. Post-recession, capital goods companies often experience a slack in demand, implying that the purchasing and expansion of these companies is slow going.
As the cycle progresses into the expansion phase—late bull—demand for consumer goods from producers also increases (Thorpe, Citation2003). During this stage, interest rate increases accelerate because of increased demand for capital outweighing the loanable funds supply. Sovereign central banks generally tighten monetary policy as concerns about inflationary pressures deteriorate, which in turn places upward pressure on interest rates. Security price returns now decelerate due to diminishing marginal productivity, and slow the GDP growth (Thorpe, Citation2003). Security prices reach their peak before the economy reaches its peak; therefore, security prices can be used as leading indicators for predicting economic downturns (lagging and leading indicators are explained later). The deceleration of a country’s GDP growth rate will not cause interest rates to decrease instantaneously; rather they increase due to inflationary pressures, increased costs of financing unforeseen inventory accumulations, and delays in payments of accounts receivable. The combination of these factors prompt investors to reallocate wealth from securities to bonds (Bolten & Weigand, Citation1998; Vashakmadze, Citation2012).
During the fourth stage—early bear—economic growth expectations continue to deteriorate and negatively impact future earnings prospects. Interest rates decline due to the decrease in credit demand. Security prices decrease and interest rates fall considerably. However, the decreasing interest rate and improvement in earnings expectations cause security prices to rebound once again to more favourable levels (Bolten & Weigand, Citation1998).
Unlike cyclical industries, defensive ones are not as sensitive to changes in the business cycle and often outperform cyclical industries during recessions (Marx et al., Citation2010). Other industries, such as utilities, also perform well, regardless of the business cycle phase. Utility industries are considerable borrowers of money, and benefit from recessions because they can borrow at lower than usual interest rates. When the economy is in an expansion phase, utilities benefit from the increase in demand for energy and services (Thorpe, Citation2003).
Recently, Sturm (Citation2019) investigated the way market sectors contribute to the optimal risky portfolio over business cycles and found that although investors price return and risk information reasonably efficiently, pricing sector-level correlation information efficiently is considerably more complex. Fan and Yan Lin (Citation2020) explored active versus passive investing in the US equity market (where the former investment style involves sector rotation) but did not find considerable evidence that actively managed sector mutual funds outperform their passive counterparties. Adam and Merkel (Citation2019) developed a simple model to replicate stock cycles and business cycles and found the former generated inefficient price signals for new investments. The real economy was impacted resulting in augmented over and under capital accumulation as a result.
It is important to understand that security prices lead the economy (Dzikevičius & Vetrov, Citation2012; Reilly & Brown, Citation2012). Furthermore, because security markets are forward looking, and the average market prices are reflected in these economic fundamentals, then what is evident is that market cycles lead the business cycle (Bolten & Weigand, Citation1998). This is because economic fundamentals, such as corporate profits, interest rates and dividends, are reflected in security prices (Jacobsen, Citation2010). Security markets also respond differently to leading indicators (Jones, Citation2009; Reilly & Brown, Citation2012), thus providing another reason why security prices lead the economy. If both the economy and security prices are cyclical, it follows that the business cycle may be forecasted to some extent (Marx et al., Citation2010; Bodie et al., Citation2012). However, to assure profits and avoid losses through predicting the business cycle, turning points must be identified accurately before they arise. Investors should be attentive to the correct time to adjust securities, given the prevailing economic outlook (Marx et al., Citation2010).
Some cyclical indicators that may assist investors to better predict, measure and interpret short-term economic activity fluctuations or determine the phase of the business cycle (Jones, Citation2009; Bodie et al., Citation2012) are provided in . Iyetomi et al. (Citation2020) found that some coincident and lagging indicators exhibited leading indicator characteristics, showing that improvements to existing indicators are required.
Table 1. Indices of economic indicators
The investment method employed to benefit from investing securities during certain phases of the business cycle is known as sector rotation (Thorpe, Citation2003:8), an investment style in which securities are transferred from one industry/sector to another as the business cycle advances (Nyamache et al., Citation2013). Sectors of the economy and security market behave differently from one another, so security prices and industries comprising these securities will also react similarly to one another (Spiro, Citation1981). Sector rotation thus allows investors to position portfolios such that they can take advantage of the market’s next move. Certain sectors perform better or worse during different phases of the business cycle: factors that affect a sector’s leadership can be based on both macro developments, for example, currency market trends, interest rate or inflation expectations, and psychological factors (greed and fear).
The choice of a sector rotation strategy is often considered as a high-risk strategy because, for investors to be profitable, correct market timing is critical, but difficult to accomplish consistently (Reilly & Brown, Citation2012). The correct phase timing of the cycle reflects an investor’s ability to recognise the opportune time to switch out from specific securities and into others. In other words, the investor’s aim is to buy low and sell high (Francis, Citation1993; Marx et al., Citation2010), thereby providing the investor with the opportunity of earning excess returns. The way excess returns are measured is generally achieved through comparing returns relative to those of a buy-and-hold strategy with similar risks as opposed to those in the timing strategy (Marx et al., Citation2010). The sectors believed to earn excess returns during certain phases are described in .
Table 2. The economic cycle and relative stock performance groups
provides a summarised explanation of the securities and the sectors that are believed to perform well, given the economic stages, as well as a description of the economy in each stage. is divided into three major industry groups known as the (1) cyclical industry, (2) defensive industry, and the (3) growth industry. The performance of the cyclical industry is dependent on the wealth of the economy (Thorpe, Citation2003). Cyclical industries tend to perform better during expansion phases, whereas defensive industriesFootnote1 have the tendency to perform better during recessions. Growth industries, on the other hand, are moderately independent of the performance of the economy and are often in a stage of rapid growth (Thorpe, Citation2003).
Cyclical industries produce capital goods, i.e. those used by other companies to produce their own products and include the automotive and construction industries. Because purchases of goods can be delayed during a recession, sales are sensitive to macroeconomic conditions. Conversely, pharmaceuticals and public utilities are examples of defensive industries; these are immune to the business cycle (Marx et al., Citation2010). Growth industries are those experiencing rapid expansion, independent of the strength of the prevailing economy: examples include the biotechnology industry (Thorpe, Citation2003).
Three stages of expansion (of equal length) were identified from the first month following a cycle trough date to subsequent cycle peak date and two equal length stages of recession from the first month following a cycle peak date to the subsequent cycle trough date. Like Stovall (Citation1995), expansions were divided into three equal stages (early/middle/late) and recessions into two stages (early/late). presents a general characterisation of a business cycle and the strategy in which benefits are derived from efficient allocation of investment resources during different phases of the business cycle is called sector rotation.
The credit crisis of 2008/9 represents a curious but explicable anomaly in this scheme. It is now generally agreed that it was a dearth of liquidity—not credit—which was a precursor to (and precipitator of) the “credit” crisis (see, for example, Naes et al., Citation2011). The woeful deterioration of underwriting standards for real estate—residential and commercial—compounded and exacerbated the situation in a vicious feedback loop. In the period after the crisis of 2008/9, financials and real estate stock behaviour have returned to their traditional popularity in the relevant phase of the business cycle (Arshad, Citation2014), as set out by Stovall (Citation1995).
O’Neal (Citation2000) argues that sector momentum can serve as an indication of future sector performance. Menzly and Ozbas (Citation2004) indicated how a sector’s performance determines its position in the production and consumption supply chain. Avramov and Wermers (Citation2006) found that a link exists between the allocation of a mutual fund’s performance within a specific industry and business cycle proxies. Hou (Citation2007) argues that there is a significant lead or lag relation with how the different sectors react to the arrival of new economic information. For instance, consumer goods industries do not react as quickly as basic material or commodity industries do to the arrival of new economic news (Stangl et al., Citation2009). Another way in which sector rotation might outperform the market is via monetary conditions (Conover et al., Citation2008). Stangl et al. (Citation2009), found that sector market timing, based on summer and winter patterns in US sectors, outperforms a buy and hold portfolio.
Hong et al. (Citation2007) found that 14 out of 34 US industries can predict the market, and thus disproved the efficient market hypothesis (EMH). Hong et al. (Citation2007) stated that “the returns of industry portfolios that are informative about macroeconomic fundamentals will lead the aggregate market”. Tse (Citation2015), however, re-examined Hong et al. (Citation2007) through extending the period of examination from 1946–2002 to 2013 and extended the data to cover 48 industries. Tse (Citation2015) found that, depending on the model specifications and the significance level (5% or 10%), only one to seven industries portrayed significant predictive ability for the security market, thus proving that his results are consistent with those provided by the EMH.
displays the various stages of the business cycle, where the conventional wisdom suggests the sectors that perform best (Stangl et al., Citation2009; Stovall, Citation1995). Our work follows the classification of sector investing devised by Stovall (Citation1995).
Table 3. List of expected best performing industries across business cycle stages
Stovall (Citation1995) divides the economy into 10 sectors and assigns most optimal performance of these sectors to one of five different stages in the business cycle. For instance, the guide suggests that the consumer cyclical and financial sectors will provide the investor with the best late recession performance, while the technology and transportation sectors have the best performance in the early expansion stage (Morgan Stanley, Citation2014). The outperformance of sectors continues to shift through the different sectors across the remaining business cycle stages.
While profound structural market changes have been introduced by economic and technological changes in the 25 years since Stovall’s (Citation1995) work, recent evidence continues to support his basic principles. For example, Jacobsen et al. (Citation2009) found that investors anticipate business cycle stages “perfectly” and then rotate sectors in accordance with conventional practice. Korniotis and Kumar (Citation2013) found evidence of stock market return predictability that was consistent with mispricing explanations provided by Stovall (Citation1995) and Chava et al. (Citation2019) found—using sector rotation—found that although investors did not fully incorporate business cycle variation in cash flow growth the influence of the business cycle on the cross-sectional return dispersion of industry portfolios remained important.
Stangl et al. (Citation2009) argue that a sector rotation strategy has, at best, generated a 2.3% annual outperformance of the market (excluding any transaction costs). Morgan Stanley (Citation2014) found that, in 2012, the financials and consumer cyclical sectors outperformed growth sectors, such as information technology and industrial securities, which suffered the most losses during the faltering recovery. Sector performance is also known to shift rapidly, and market securities can overturn even the most sophisticated investing strategy.
Brocato and Steed (Citation1998) found that cyclical reallocation seems to be more important in maintaining Markowitz efficiency during recessions than in periods of expansions. Expansion reallocation produced a 3.5% risk adjusted increase in portfolio returns (relative to a buy-and-hold position), and a 79.1% increase during recessions (Brocato & Steed, Citation1998). Allocations of portfolios need not be done only on a standard, risk-adjusted basis, seeing that there are numerous other performance measures that can be used to construct an optimal portfolio. Some measures might even prove to be more useful in addressing the shortcomings of the standard risk-adjusted performance measures.
3. Data and methodology
Like Thomson and van Vuuren (Citation2016), this study uses GDP as a proxy of economic activity to identify potential cycles. Although determining the business cycle using GDP is not flawless (Boehm & Summers, Citation1999; Ivković, Citation2016), it does provide a reasonable measure of the economic activity and business cycle. A series of turning points are required to be defined to separate the phases of the business cycle, a method which is widely used and follows Burns and Mitchell (Citation1946).
The GDP data used are the seasonally adjusted, nominal GDP in South African rand, measured quarterly from December 1996 to January 2017. The South African market cycle is proxied by the All Share Index (ALSI): monthly data were used for the same period. The data for the business cycle and market cycle series were obtained from the South African Reserve Bank (SARB) and INET Bureau of Financial Analysis (BFA) databases, respectively.
Fourier series have the benefit of being discrete which simplifies computation—requiring only that the signal be on a finite domain (a condition satisfied for finite financial data).
The central idea of spectral analysis is to re-express the original time-series x(t) as a new sequence X(f), which evaluates the significance of each frequency component, f, in the dynamics of the original series (Masset, Citation2008). This is achieved by using the discrete version of the Fourier transform, which decomposes a periodic signal into its constituent frequencies. Time series data that comprise periodic components can be written as a sum of simple waves (that is, oscillations of a single frequency) represented by sine and cosine functions. A Fourier series is an expansion of a periodic function in terms of an infinite sum of sines and cosines by making use of the orthogonality relationships of the sine and cosine functions (Askey & Haimo, Citation1996). The generalised Fourier series, obtained using the functions f1(x) = cos x and f2(x) = sin x (which form a complete orthogonal system over [-π, π]) gives the Fourier series of a function f(x):
where
and
For a function f(x) periodic on an interval [0,2 L] instead of [-π, π] a simple change of variables may be used to transform the interval of integration from [-π, π] to [0,2 L] by letting
Solving for and substituting into (1) gives (Krantz, Citation1999):
where
and
Other filters exist—such as the Kalman filter—which may be used to extract underlying patterns (including periodic ones) from signal data by reducing or eliminating noise. To calibrate the Kalman filter, however, requires many data and most GDP data are only reported and recorded quarterly. Considerably more data are required for the filter to “learn” the underlying pattern (i.e. distinguish the coherent pattern from the noisy signal) as well as test out of sample data than are needed for use in, e.g. the Fourier transform technique. For this reason, the Kalman filter was not used in this work.
Using Fourier transformation analysis, Botha (Citation2008) and Thomson and van Vuuren (Citation2016) concluded that the duration of the South African business cycle is 7.1 years. Since the data span 20 years, about three business cycles are thus included.
Securities data were obtained from INET BFA (daily data from December 1996 to January 2017). Securities were downloaded for top 100 Johannesburg Securities Exchange (JSE) listed companies, based on their market capitalisation as obtained from Sharenet in January 2017. These top 100 shares are extremely liquid and constitute a highly diversified sector set including mining, banks, and retail.
Fourier analysis was applied to the data to determine the underlying frequency of the market or business cycles, and then ascertained the turning points of these cycles. Identifying these turning points helps clarify the duration of each investment period. An investment portfolio was then assembled comprising securities of the sector predicted to theoretically outperform others during a specific phase, using cycle theory. The sectors in which to invest—and when—are specified by Stovall (Citation1995) and illustrated in . The components of cycle theory indicate a combination of both economic and market cycles in which the market cycle leads the economic cycle.
After the application of cycle theory and sector selection, Markowitz’s (Citation1952) portfolio theory was used to determine optimal portfolio components (with respective weights in the relevant sector’s securities). Using this mean-variance framework, the maximum risk-adjusted return portfolio was identified (i.e. the maximum Sharpe ratio position) in return/risk space: this provides the optimal risk-adjusted return portfolio for the relevant phase of the business cycle. Investing in these optimised portfolios, during each sector’s optimal phase, should generate a maximised risk-adjusted return over that period. When the business cycle’s phase favours a different sector, profits (or losses) are realised and the process repeats, as summarised in the flowchart of the empirical analysis shown in .
Figure 2. Empirical analysis flowchart
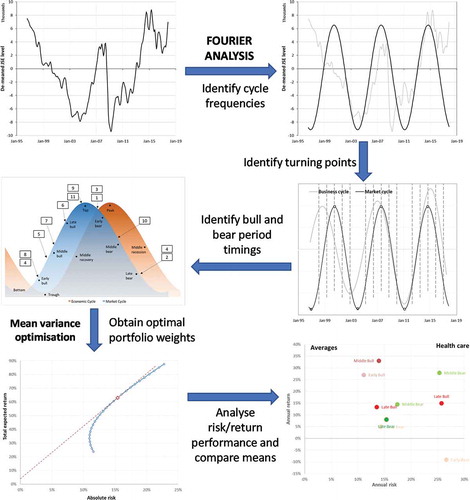
First, the raw GDP and ALSI data are collected and then used as input to ascertain whether cycles are present and, if so, to isolate the dominant cycle. Having obtained this frequency, turning points are identified and then relevant market sector phase dates. This information is then used in Stovall’s (Citation1995) cycle theory analysis to select specific securities in specific phases. In turn, these securities are used to construct a Markowitz mean-variance efficient frontier and an optimal portfolio (in the maximum risk-adjusted return sense) for each of the given phases is constructed. The results are compared to validate whether specific sectors (as proposed by Stovall, Citation1995) did indeed perform better than the overall market (ALSI). Risk/return results are later used to perform comparison of means tests to establish statistically robust differences and thus further affirm or refute sector investment theory.
4. Empirical results
The discrete Fourier transform assumes that the input signal data (in this case, the nominal GDP and ALSI data) are statistically stationary, i.e. they have a constant mean through time. If the data were taken as is (due to the convex growth curve), considerably more weight would be given to fluctuations that more recent, as the scale has increased substantially in later years (2000s onwards), relative to initial years (pre-2000s). This would not represent an accurate description of the time series, and Fourier analysis would not identify cycles accurately.
To establish whether data were non-stationary, the Augmented Dickey–Fuller test was used. Thomson and van Vuuren (Citation2016) applied the ADF test to the nominal GDP data for a similar period as that of this study and concluded that data were non-stationary and needed to be stationarised. The stationarised data are shown in (also the best-fit Fourier series (with a 7.1-year frequency)).
Figure 3. De-trended ALSI returns using first differences
These returns do not scale with time and have a non-trending mean, indicating that these are suitable for use in the Fourier analysis framework. The time series is decomposed into a series of sine and cosine waves occurring at different frequencies with different intensities,Footnote2 which after summation can duplicate the behaviour of the original signal. The amplitude of each frequency component is plotted against its period in . The frequency is defined as .
Figure 4. Periodogram of transformed monthly GDP return data
Figure 5. Periodogram of transformed quarterly ALSI return data
Two dominant frequencies are present: 0.0117 cycles/month (one full cycle every 7.1 years) and 0.0352 cycles/quarter (one full cycle every 7.1 years). These results are consistent with Botha (Citation2008), Thomson and van Vuuren (Citation2016), and Botha (Citation2008), who employed South African GDP data and used a smooth transition autoregressive technique, found a 7.0-year cycle: the results reported by Thomson and van Vuuren (Citation2016) further verifies the result obtained in this study—that the dominant cycle present in South African GDP data and ALSI data using the Fourier transform is 7.1 years.
After applying Fourier analysis to the GDP and ALSI (market data) to identify the full cycles, the original signal was removed, leaving only the cycles. These cycles were then superimposed to identify turning point dates in both the business and market cycles as shown in .
Figure 6. Identification of business cycle and market cycle turning point dates
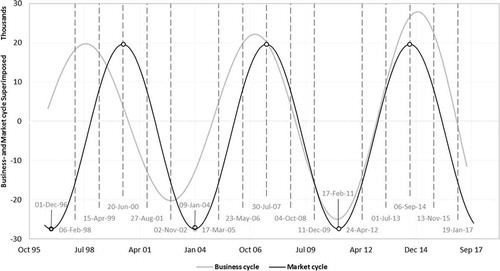
Selecting an optimal portfolio comprising stocks from the specific sector for the given period is the next hurdle. Securities were selected based on their market capitalisation as provided by Sharenet (Citation2017). The higher the market cap, the more likely a specific security is to be included in the portfolio. Identification of security weights was accomplished by applying Markowitz’s (Citation1952) efficient frontier to each of the sectors for all the different phases as identified by the Fourier analysis. The maximum Sharpe portfolio (i.e. the optimal portfolio) was then compared across sectors with one another to determine which sector produced the most returns during a specific phase—as seen in .
The results show some confirmation with theory (). In the first early bull phase (Dec-96 to Feb-98), Stovall (Citation1995) found that financial and transportation sectors outperformed other sectors. We found the most promising returns in, the technology sector, followed by the consumer services sector, and then the financial sector. During the second early bull phase (Jan-04 to Mar-05), the financial sector outperformed all others. In the third early bull phase (Feb-11 to Apr-12), telecommunications, basic materials, and consumer services outperformed the financial sector.
Table 4. Top two performing industries compared with theory
After the first cycle (Dec-96 to Jan-2004), the telecommunication and health-care sectors experienced a significant increase in market participation. During the first bull phase, MTN Group Ltd was the only listed telecommunications company. Telkom SA Ltd only listed during the middle of the first late bear phase. Similarly, the health-care sector at the start of the first cycle (Dec-96 to Jan-2004) comprised only Aspen Pharmacare Holdings Ltd and Netcare Ltd. The limited amount of securities available to invest in during these phases, and in these specific sectors, influenced the return data significantly, as diversification was limited. A summary of optimal portfolio returns is shown in .
Table 5. Optimal portfolio returns for different sectors and phases
The return data for the health sector during the first middle bull phase (06-Feb98 to 14 April 1999) might seem irregular when comparing them to other return data. This was because there were only two listed health-care companies during the first middle bull phase, namely: Aspen Pharmacare Holding Ltd (APN) and Netcare Ltd (NTC). During this period, APN share prices traded at R0.32 per share on 9 February 1998 and concluded with a share value of R7.75 per share on 14 April 1999 ().
Figure 7. Daily share price—APN Ltd
The risk/return performance for the health-care portfolio is shown in .
Figure 8. Health-care risk/return performance—excluding Middle Bull 1
Comparing means tests the significance of two unknown means and sample standard deviations. If H1 is true and , this implies that cycle theory is wrong. Although some of the probabilities that H1 is true are >40%, all of them are <50%, which suggests that the H1 hypothesis can be rejected, and that we are more confident than unsure that cycle theory is true.
The results, shown in , align with Stovall (Citation1995). For instance, Stovall (Citation1995) suggested that the financial sector will perform better in the early bull phase (the greyed-out cells for each phase represent the relevant sector used to compare with the others). In , the probability that basic materials performed better than financials did during this phase was calculated at 2.3%. The same conclusions can be reached for the remaining sectors: the probability of each performing better than financials during that specific phase was at the highest 44.4% (Consumer Services).
Table 6. Comparing means using t-test (,
)
In other words, the chances of other sectors outperforming financials in the early bull phase were all below 50%. This is true for all the stock sectors identified by Stovall (Citation1995) to excel in their relevant market phases, as seen in . These results affirm the conclusions reached by Stovall (Citation1995).
Figure 9. Probability of sectors outperforming, according to Stovall (Citation1995) theory.
5. Conclusions and suggestions for further study
Investors have different objectives for investing: some intend to finance greater consumption, while others select longer-term investments to ensure larger retirement incomes. Whatever the objective, investors desire strategies which generate optimal risk-adjusted performance (be this the best return, the lowest risk, or combinations thereof). These strategies are varied and numerous. Once investors have determined the sectors in which to invest, specific securities must be identified that will offer the best risk-adjusted returns. To determine the correct weighting assigned to each security, investors use optimisation strategies to maximise returns and minimise risk (for example).
In this work, a principal contribution stems from Fourier analysis which here, having been applied for the first time to both the market index and South African GDP data to determine the underlying frequency of the market/business cycle, is used to isolate principal frequencies and identify turning points specifically for sector rotation implementation. The accurate determination of these values provides considerably improved clarity regarding the assessment and identification of the six market phases suggested by Stovall (Citation1995).
Assembling investment portfolios that comprise specific sector securities—classified using cycle theory as being superior (i.e. they outperform others during specific phases) followed. Markowitz’s portfolio theory was then employed to determine the optimal (maximum Sharpe ratio) weights in these securities. Using historical data, the performance of each portfolio was simulated, and the results compared to ascertain whether the specific sectors proposed by Stovall (Citation1995) did indeed perform better than the overall market. Mean performances were compared to establish statistically robust differences, and thus further affirm or refute sector investment theory. Results showed that cycle theory remains a profitable practice and employing its conclusions produces superior portfolios to the market. Statistical comparison of means validated the claim that specific sectors (as suggested by cycle theory) perform better than others at different phases of the business cycle.
This work’s principal findings are
Fourier analysis provides robust and accurate estimates of business cycle frequencies (leading to reliable identification of relevant business cycle phases), and
sector rotation investment strategies work well in developing economies like South Africa’s—despite relatively illiquid investment securities compared with developed economies—producing superior returns (statistically significantly different from the broad market index) at each phase of the cycle.
This work adds to the current dearth of theoretical and empirical research regarding sector rotation in emerging economies, so it can also be beneficial for researchers interested in similar milieus.
Practical implications could include—as in this work—implementing a combination of Fourier analysis to determine cycle phases (or a similar approach provided it robustly and reliably reproduces the business cycle, including abrupt idiosyncratic phase changes and unanticipated cycle frequency shifts) and the mean-variance framework to optimise asset allocation within sector-specific portfolios. This combination has been shown to result in enhanced portfolio performance across all business cycle phases.
Other practical implication could include identifying alternative security selection strategies to further identify potential undervalued securities, instead of the current security selection based on market capitalisation strategy, such as a bottom-up analysis.
Possible limitations involve portfolio holding rebalancing and the exclusion of transaction costs. After the relevant business cycle phase is identified, the strategy suggestion is to purchase and retain that sector until indicators signal a change of industries as the business cycle phase alters. During the intra-phase period no rebalancing was considered and transaction costs were ignored (these are negligible under buy-and-hold strategies). Future work could consider intra-phase rebalancing and the inclusion of associated transaction fees.
Future work could involve finding the average price according to the earnings model and the average price according to the dividend model to validate whether securities selected are indeed trading at a discount. Various financial ratios could also be used to ascertain the overall status of the company/security, such as return on equity (ROE), price-earnings ratio (P/E), dividend yield percentage, pay-out ratio, and the financial leverage ratio. Market timing strategy—in the form of technical analysis—could also be applied to further improve the overall performance of securities included in the portfolio.
Additional information
Funding
Notes on contributors
Johnny Jansen van Rensburg
Gary van Vuuren is an extraordinary professor in the Centre for Business Mathematics and Informatics at North-West University (Potchefstroom Campus). An ex-nuclear physicist, he also supervises postgraduate research at the University of Cape Town (School of Economics) and the University of Pretoria (Department of Mathematics and Applied Mathematics).

Gary van Vuuren
Johnny Jansen van Rensburg is a lecturer at North-West University (Vanderbijlpark Campus) focussing on investment management. He completed his Masters degree In 2018 in risk management during which time he was employed by NWK Limited as a senior risk officer.
Notes
1. Not to be confused with the defence industry.
2. Intensity, power and amplitude are used interchangeably.
References
- Adam, K., & Merkel, S. (2019). Stock price cycles and business cycles. European Central Bank, Working Paper Series, #2316.
- Andersen, T. G., Bollerslev, T., Diebold, F., & Vega, C. (2007). Real-time price discovery in global stock, bond, and foreign exchange markets. Journal of Financial Economics, 73(2), 251–24. doi: 10.1016/j.jinteco.2007.02.004
- Aron, J., & Muellbauer, J. 2002. Evidence from a GDP forecasting model for South Africa IMF Staff Papers, 49, IMF annual research conference, 185–213. Washington, DC.
- Arshad, S. (2014). The vicissitudes of stock markets and business cycles. Macroeconomics and Finance in Emerging Market Economies, 9(1), 56–74. https://doi.org/10.1080/17520843.2014.989247
- Askey, R., & Haimo, D. T. (1996). Similarities between Fourier and power series. The American Mathematical Monthly, 103(4), 297–304. https://doi.org/10.1080/00029890.1996.12004740
- Avramov, D., & Wermers, R. (2006). Investing in mutual funds when returns are predictable. Journal of Financial Economics, 81(2), 339–377. https://doi.org/10.1016/j.jfineco.2005.05.010
- Bekaert, G., & Harvey, C. R. (1997). Emerging equity market volatility. Journal of Financial Economics, 43(1), 29–77. https://doi.org/10.1016/S0304-405X(96)00889-6
- Benson, K., Gray, P., Kalotay, E., & Qiu, J. (2008). Portfolio construction and the performance measure when returns are non-normal. Australian Journal of Management, 32(3), 445–461. https://doi.org/10.1177/031289620803200304
- Bodie, Z., Kane, A., & Marcus, A. (2012). Essentials of investments (9th ed.). McGraw-Hill.
- Boehm, E. A., & Summers, P. M. (1999). Analysing and forecasting business cycles with the aid of economic indicators. International Journal of Management Reviews, 1(3), 245–277. https://doi.org/10.1111/1468-2370.00015
- Bolten, S. E., & Weigand, R. A. (1998). The generation of stock market cycles. Financial Review, 33(1), 77–84. https://doi.org/10.1111/j.1540-6288.1998.tb01608.x
- Borio, C. (2012). The financial cycle and macroeconomics: What have we learnt? BIS working papers, #395. https://www.bis.org/publ/work395.pdf
- Bosch, A., & Ruch, F. (2012). An Alternative Business Cycle Dating Procedure for South Africa. Working Paper #5210, South African Reserve Bank.
- Bosch, A., & Ruch, F. (2013). An alternative business cycle dating procedure for South Africa. South African Journal of Economics, 81(3), 491–516. https://doi.org/10.1111/j.1813-6982.2012.01339.x
- Botha, I. (2008). Modelling the business cycle of South Africa, linear vs. non-linear methods [Doctoral dissertation]. University of Johannesburg.
- Brocato, J., & Steed, S. (1998). Optimal asset allocation over the business cycle. Financial Review, 33(3), 129–148. https://doi.org/10.1111/j.1540-6288.1998.tb01387.x
- Bry, G., & Boschan, C. (1971). Cyclical analysis of time series: Procedures and computer programs. NBER.
- Burns, A. F., & Mitchell, W. C. (1946). Measuring business cycles. Science and Society, 11(2), 192–195. https://doi.org/10.1177/000271624725200161
- Casarin, R., & Trecroci, C. (2006). Business cycle and stock market volatility, a particle filter approach, Working Papers ubs0603, University of Brescia, Department of Economics.
- Chava, S., Hsu, A., & Zeng, L. (2019). Does history repeat itself? Business cycle and industry returns. Journal of Monetary Economics. https://doi.org/10.1016/j.jmoneco.2019.10.005
- Chevillon, G. (2009). Multi-step forecasting in emerging economies: An investigation of the South African GDP. International Journal of Forecasting, 25(3), 602–628. https://doi.org/10.1016/j.ijforecast.2008.12.004
- Claessens, S., Kose, M. A., & Terrones, M. E. (2009). What happens during recessions, crunches and busts? Economic Policy, 24(60), 653–700. https://doi.org/10.1111/j.1468-0327.2009.00231.x
- Conover, C. M., Jensen, G. R., Johnson, R. R., & Mercer, J. M. (2008). Sector rotation and monetary conditions. The Journal of Investing, 17(1), 34–46. https://doi.org/10.3905/joi.2008.701955
- Crescenzi, R., & Rodríguez-Pose, A. (2009). Systems of innovation and regional growth in the EU: Endogenous vs. external innovative activities and socio-economic conditions. In U. Fratesi & L. Senn (Eds.), Growth and innovation of competitive regions. Advances in spatial science (pp. 167-191). Springer.
- Cvetanović, S., Mitrović, U., & Jurakić, M. (2019). Institutions as the driver of economic growth in classic, neoclassic and endogenous theory. Economic Themes, 57(1), 111–125. https://doi.org/10.2478/ethemes-2019-0007
- Du Plessis, S., Smit, B., & Steinbach, R. (2014). A medium-sized open economy DSGE model of South Africa. South African Reserve Bank Working Papers, #6319.
- Dzikevičius, A., & Vetrov, J. (2012). Stock market analysis through business cycle approach. Business, Theory and Practice/Verslas, Teorija Ir Praktika, 13(1), 36–42. https://doi.org/10.3846/btp.2012.04
- Emsbo-Mattingly, L., Hofschire, D., Litvak, A., & Lund-Wilde, J. (2014). The business cycle approach to equity sector investing. Fidelity Investments Leadership Series. https.//www.fidelity.com/webcontent/ap101883-markets_sectors-content/19.04.0/business_cycle/Business_Cycle_Sector_Approach.pdf
- Fan, Y., & Yan Lin, C. (2020). Active vs. passive, the case of sector equity funds. Financial Services Review, 28(2), 159–177. DOI: 10.2139/ssrn.3422496
- Francis, J. C. (1993). Management of investments (3rd ed.). McGraw-Hill.
- Hall, R., Feldstein, M., Frankel, J., Gordon, R., Mankiw, N. G., & Zarnowitz, V. (2003). The NBER’s business-cycle dating procedure. Business cycle dating committee. National Bureau of Economic Research.
- Hertzberg, M. P., & Beckman, B. A. (1989). Business cycle indicators, revised composite indexes. Business Conditions Digest, 29(1), 97–102. https://doi.org/10.1108/S0573-8555(2010)0000289008
- Hong, H., Torous, W., & Valkanov, R. (2007). Do industries lead stock markets? Journal of Financial Economics, 83(2), 367–396. https://doi.org/10.1016/j.jfineco.2005.09.010
- Hou, K. (2007). Industry information diffusion and the lead-lag effect in stock returns. The Review of Financial Studies, 20(4), 1113–1138. https://doi.org/10.1093/revfin/hhm003
- Ivković, A. F. (2016). Limitations of the GDP as a measure of progress and well-being. Econviews-review of contemporary business. Entrepreneurship and Economic Issues, 29(1), 257–272. https://hrcak.srce.hr/ojs/index.php/ekonomski-vjesnik/article/view/4217
- Iyetomi, H., Aoyama, H., Fujiwara, Y., Souma, W., Vodenska, I., & Yoshikawa, H. (2020). Relationship be-tween macroeconomic indicators and economic cycles in the US. Scientific Reports, 10 (3), 1–20. DOI: 10.1038/s41598-020-65002-3
- Jacobsen, B. (2010). Market cycles and business cycles. Social Science Research Network, 1553011. http://dx.doi.org/10.2139/ssrn.1553011
- Jacobsen, B., Stangl, J. S., & Nuttawat, V. (2009). Sector rotation across the business cycle. https://ssrn.com/abstract=1467457
- Jones, C. P. 2009. Investments. principles and concepts, 11th. John Wiley & Sons. ISBN: 978-1-118-65275-6
- Korniotis, G. M., & Kumar, A. (2013). State-level business cycles and local return predictability. Journal of Finance, 68(3), 1037–1096. https://doi.org/10.1111/jofi.12017
- Krantz, S. G. (1999). The Fourier Transform. In Handbook of complex variables (pp. 202–212). Birkhuser.
- Markowitz, H. (1952). Portfolio selection. The Journal of Finance, 7(1), 77–91. https://www.math.ust.hk/~maykwok/courses/ma362/07F/markowitz_JF.pdf
- Marx, J., Mpofu, R., de Beer, J., Nortjé, A., & van de Venter, T. (2010). Investment management (3rd ed.). Van Schaik.
- Masset, P. (2008). Analysis of financial time-series using Fourier and wavelet methods. Faculty of Economics and Social Science, (October), 1–36. http://dx.doi.org/10.2139/ssrn.1289420
- Menzly, L., & Ozbas, O. (2004). Cross-industry momentum (presented at 2005 AFA Meetings in Philadelphia, PA). Working paper, University of Southern California.
- Morgan Stanley. (2014). Sector Rotation, Tailor your portfolio for markets on the move. http.//www.morganstanleyfa.com/public/projectfiles/c560c9e9-6f4c-45b5-ba97-ea02c375347d.pdf
- Naes, R., Skjeltorp, J., & Odegaard, B. (2011). Stock market liquidity and the business cycle. The Journal of Finance, 66(1), 139–176. https://doi.org/10.1111/j.1540-6261.2010.01628.x
- NBER. (2012). US business cycle expansions and contraction. http.//www.nber.org/cycles/US_Business_Cycle_Expansions_and_Contractions_20120423.pdf
- Nyamache, T., Nyambura, R., & Mishra, P. Y. (2013). Impact of business cycles on industry sectors, A structural economic change in Kenya. International Journal of Research Management, 3(5), 116–127. https://rspublication.com/ijrm/2013/sep13/9.pdf
- O’Neal, E. S. (2000). Industry momentum and sector mutual funds. Financial Analysts Journal, 56(4), 37–49. https://doi.org/10.2469/faj.v56.n4.2372
- Reilly, F. K., & Brown, K. C. (2012). Analysis of investment and managements of portfolios (10 ed.). Cengage Learning.
- SARB (South African Reserve Bank). (2010). Financial stability review, September, 1–38.
- Sharenet. (2017). Top 100 companies by market capital. http.//www.sharenet.co.za/
- Soyer, K., Ozgit, H., & Rjoub, H. (2019). Applying an evolutionary growth theory for sustainable economic development. Sustainability, 12(3), 1–20. doi:10.3390/su12010418
- Spiro, H. M. (1981). Economic sector investing. Business Economics, 16(2), 1–5. https://www.jstor.org/stable/23482470
- Stangl, J., Jacobsen, B., & Visaltanachoti, N. (2009). Sector rotation over business-cycles. Massey University.
- Stovall, S. (1995). The S&P Guide to sector investing. McGraw-Hill.
- Sturm, R. (2019). Sector behavior, market efficiency, and the optimal risky portfolio. The Journal of Investing, 28(5), 38–53. https://doi.org/10.3905/joi.2019.28.5.038
- Switzer, L. N., & Picard, A. (2015). Stock market liquidity and economic cycles: A non-linear approach. Economic Modelling, 57(C), 106–119. https://doi.org/10.1016/j.econmod.2016.04.006
- The Conference Board. (2016). The conference board leading economic index for the United States and related composite economic indexes for July 2016. https.//www.conference-board.org/pdf_free/press/US%20LEI%20-%20Tech%20Notes%20Aug%2018%202016.pdf
- Thomson, D., & van Vuuren, G. (2016). Forecasting the South African business cycle using Fourier analysis. International Business and Economics Research Journal, 15(4), 175–192. https://doi.org/10.19030/iber.v15i4.9755
- Thorpe, W. A. (2003). Mean variance optimization. Multi-asset portfolio. http.//www.aaii.com/computerizedinvesting/article/mean-variance-optimization-multi-asset-portfolio.pdf
- Tse, Y. (2015). Do industries lead stock markets? A re-examination. Journal of Empirical Finance, 34(1), 195–203. https://doi.org/10.1016/j.jempfin.2015.10.003
- Vashakmadze, T. (2012). The investment strategy based on sector rotation, literature review. Global Academic Society Journal, Social Science Insight, 5(14), 4–11. https://ssrn.com/abstract=2035564
- Venter, J. C. (2005, September). Reference turning points in the South African business cycle: Recent developments. South African Reserve Bank Quarterly Bulletin, 61–70. https://www.researchgate.net/publication/265122115_Reference_turning_points_in_the_South_African_business_cycle_Recent_developments