
 ?Mathematical formulae have been encoded as MathML and are displayed in this HTML version using MathJax in order to improve their display. Uncheck the box to turn MathJax off. This feature requires Javascript. Click on a formula to zoom.
Abstract
Adoption of Tef production technology has paramount importance to increase Tef productivity, foster food security, and secure the well-being of smallholder farmers. Hence, this study aims to identify the determinants of adoption of Tef technology packages in Yilmana Densa district, and subsequently assess the factors influencing the intensity of adoption of the technology. In this study, 224 sample households were selected using systematic random sampling techniques. The data were obtained mainly from sampled Tef grower households via structured interviews, and it was supported by key informant interviews. Descriptive statistics such as Chi-square, t-test, and one-way ANOVA were employed. First-hurdle of double hurdle model result revealed that adoption decision of Tef technology packages was determined via the frequency of extension contact, agricultural training, farmers’ perception, and farmers’ cooperative membership, positively. The second-hurdle result also shown that the adoption intensity of Tef technology packages was influenced by the frequency of extension contact, agricultural training, demonstration participation, and seed multiplication membership, positively, whereas the distance to input market and land fragmentation influenced negatively. Therefore, efforts to be expected from the Ministry of Agriculture, extension agents, and other stockholders to enhance the adoption level of farmers.
PUBLIC INTEREST STATEMENT
Tef is gluten free and high in iron and fiber, which in recent years has caused its demand to surge on the international market. However, until it is considered as an orphan crop: no receiving international attention regarding research on breeding and agronomic practice. So far, 42 improved Tef varieties with recommended packages have been released via EIAR. However, the technology has not been widely adopted by farmers. As a result, the average production of Tef is less than the expected production. Hence, this study investigates the determinants of decision and intensity of adoption of Tef production technology packages in Northwest Ethiopia. Hence, to enhance farmers adoption level, Bureau of Agriculture should be expanded farmer-based seed enterprises; extension agents should carry out training and field observation; Ministry of Agriculture should avail easy, efficient, and least time and low labour consumer row planter machines for farmers with lesser price.
1. Introduction
Tef (Eragrostis Tef) is an ancient grain, central to the Ethiopian diet and culture. It is also gluten- free and high in iron and fiber, which in recent years has caused its demand to surge on the international market (Martin et al., Citation2014). However, until Tef is considering as an orphan crop: no receiving international attention regarding research on breeding, agronomic practice, and other technology application to smallholder farmers. As such, reliance solely on traditional cultivation methods has contributed to low production and productivity Kebebew et al. (Citation2013).
The Ethiopian government wants to double the production and area cultivation of Tef to aid in the alleviation of food insecurity among the population (Demeke & Di Marcantonio, Citation2013). On this hand, to increase the production and productivity of Tef, various attempts were made using both conventional and modern breeding techniques. So far, 42 improved Tef varieties have been released through the Ethiopian Institute of Agricultural Research (EIAR) (the first improved varieties Magna in 1970 and the recent breeding Jitu in 2019). Besides, many recommended Tef technology packages (i.e., row planting, crop rotation, reducing seed rate, fertilizer application, plowing, and weeding frequency) were developed from national and regional research centers (ATA & EIAR, Citation2019).
The generation and launching of improved Tef technologies is not an end by itself. The goal of increasing production and productivity of Tef could realize if and only if Tef growers are adopting and applying extensively the technologies that developed by researchers. Otherwise, the plan to double the production and acreage of Tef will be a nightmare. From practical experience, recommended Tef technology packages have not been widely adopted by Tef grower farmers rather than following the traditional way of the production system. As a result, the average production of Tef is less than the expected production of 2.3-ton ha−1 (Dawit et al., Citation2010). According to ATA (Citation2014) and CSA (Citation2019) reports, the average production of Tef is 1.5-ton ha−1 and 1.75-ton ha−1, respectively. This shows that the production increment of Tef is going in arithmetic rate. However, population growth rate, number of consumers, and quantity of consumption are rising in exponential rate. Consequently, Tef price has skyrocketed since 2008, as a result creating hardship for resource-poor consumers and forcing them to transition to other cereal crops (i.e., rice and finger millet; Agricultural Transformation Agency (ATA), Citation2017).
In Amhara region, farmers heavily depend on Tef production as their main source of food and income. In this region, 1.2 million hectares of land was covered by Tef crop and 21.61 million quintals yield were produced in 2018/19 Meher season. From the total Tef production of the country, this region contributes 39.03% and 40% in acreage and production, respectively (CSA, Citation2019). Yilmana Densa district is one of the potential areas in Tef production in the region. Tef produced in this district is brand in other parts of the country, which call it Yilmana Tef. However, as other parts of the country, farmers in the study area persisting in traditional way of production over year using broadcast way of planting, fertilizer below the recommendation rate, high seed rate, and poor land preparation. Farmers’ may exacerbate for this traditional way of production system due to different factors that affecting the adoption decision and intensity of Tef technology packages. Therefore, this adoption study proposed to analyze factors that affecting the adoption decision and intensity of Tef production technology packages.
Numerous studies have been conducting on the adoption and intensity of improved agricultural technology in different parts of the country, and most considerably on maize, bread wheat, chickpeas, rice, and barley. However, a study on adoption of full package studies on Tef technology is meager. Even, the existing Tef technology adoption studies focused on a single package (i.e., fertilizer application or improved variety or row planting method, separately) than the full packages of the technology. Furthermore, previous studies included only two or three Tef packages and gave equal weights for each package. Hence, with the pursuit of filling the gaps the current study on “adoption of Tef production technology packages in Yilmana Densa district, Northwest of Ethiopia” was proposed.
2. Literature review
2.1. Definition and concepts of key terms
Technology: Various authors define technology in different ways. A more meaningful definition of technology is “a design for instrumental action that reduces the uncertainty in the cause–effect relationships involved in achieving a desired outcome” (Rogers, Citation1983, p. 12). Loevinsohn et al. (Citation2013, p. 3), defines technology as “the means and methods of producing goods and services, including methods of organization as well as physical technique”. According to this author, new technology is new to a particular place or group of farmers, or represents a new use of technology that is already in use within a particular place or amongst a group of farmers. A technology usually has hardware and software components. The hardware tool has a material aspect (the equipment, products, etc.), and a software aspect, consisting of knowledge, skills, procedures, and/or principles that are an information base for the tool (Rogers, Citation2003).
The most agreeable concept of tef production technology is used interchangeably with full package application (i.e., sowing improved tef varieties; in row, with recommended fertilizer and seed rate, crop rotation, optimum tillage-3 times, and manual weed management-2 times plot−1; Ademe & Asmiro, Citation2018).
Definition of adoption: For centuries, scholars have attempted to define, explain, and theorize adoption. Despite their efforts, it seems there is little agreement on the definition of this concept among researchers. According to Rogers (Citation1983, p. xviii), adoption defined as “a decision to use and implement a new idea”. Moreover, Loevinsohn et al. (Citation2013, p. 3) define “adoption as the integration of a new technology into existing practice and is usually proceeded by a period of trying and some degree of adaptation”.
Adoption measurement: In designing an adoption study, think about how to define precisely what technologies are being considered. Decisions must also be taken regarding how to measure adoption. In defining the criteria for adoption, it is also important to remember that although recommendations may be presented to farmers as a package of several practices, some components of the package may be adopted first, others may be adopted later, and some may never find wide spread acceptance. Therefore, ask specifically about each component of the package, bearing in mind that individual components may be adopted at different times or under different conditions. Another issue in measuring adoption is the fact that farmers often have several fields that may be subject to different management practices. In this case it needs to decide whether to assess adoption on all fields or only the largest field, or on fields that have characteristics relevant to the new technology (CIMMYT, Citation1993).
Accordingly, adoption measurements are bounded on the types of adoption studies, agro-ecological, time and study area. Same scholars put their adoption measurements to categorized respondents as adopter and non-adopter. For instance, Almaz (Citation2008) stated that adopters are farmers who are using at least one of the important practices from the recommended chickpea technology packages (improved variety) for the last two consecutive cropping seasons. Daniel et al. (Citation2017) also considered farmers as adopter when farmers were sow improved white haricot bean during the survey year. Moreover, Endeshaw (Citation2019) stated that adopters are farmers who produce Maize BH540 variety during the survey year. Mikias (Citation2020) stated that adopter are farmers who growing improved wheat variety during the survey year.
2.2. Theoretical framework
Innovation Diffusion Theory: Roger’s Innovation Diffusion Theory (IDT) explained that the innovation and adoption happened after going through several stages including understanding, persuasion, decision, and confirmation that led to the development S-shaped adoption curve of innovators, early adopters, early majority, late majority, and laggards. Roger S-shaped diffusion curve implies that numbers of people that are exposed to the innovation are few in the beginning (see ). As these people in the social system start accepting the innovation, they bring it in contact with more and more people. Therefore, the rate of spread keeps on increasing. Eventually, the innovation is accepted by most of the members of social system and the rate of spread declines (return to diminishing). As there are no more members left for accepting the innovation, the spread stops completely (Rogers, Citation2003).
Figure 1. S-shaped diffusion curve. Source: Adapted from (Rogers, Citation2003)

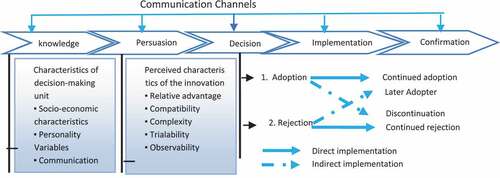
Roger proposed that the theory of diffusion of innovation was establishing the foundation for conducting research on innovation acceptance and adoption. Roger synthesized research from over 580 diffusion research studies and came out with the diffusion of innovation theory for the adoption of innovation among individuals and organization. As shown in , the theory explicates the process by which an “innovation is communicated through certain channels over the time among the member of a social system” (Rogers, Citation1983, p. 23).
Figure 2. Diffusion innovation theories. Source: (Roger 2003)
Theory of Reasoned Action: This theory reveals that individuals are rational decision makers who constantly calculate and evaluate the relevant behavior beliefs in the process of forming their attitude toward the behavior. TRA has its roots in social psychology setting. The theory proposes three general constructs, namely “behavioral intention, attitude, and subjective norm”. Based on the TRA, an individual’s behavior intentions determine his or her actual behavior. According to TRA, behavioral intention of a person depends on attitude and subjective norms (see ). Mathematically, it can be interpreted that behavioral intention is the summation of attitude and subjective norms. Moreover, intention of a person likely to convert to action if there is the intention to behave in a specific manner is strong enough (Ajzen & Fishbein, Citation1975).
Figure 3. Theory of reasoned action. Source: Ajzen and Fishbein (Citation1975)

2.3. Empirical literature review and hypothesis development
The explanatory variables of this study listed and selected based on review of related literature, technology adoption theories, and from the experience of the farming system of the study area. The Theory of Diffusion Innovation, which is proposed by Rogers (Citation2003), revealed that adoption decision, rejection decision, and confirmation of technologies determined by characteristics of decision-making unit (i.e., socio-economic characteristics, personality variables, and communication variables) and perceived characteristics of the innovation (relative advantage, compatibility, complexity, trialability, and observability). The list of variables to be included in the model (double hurdle) was finalized after detecting econometrics problems.
Sex: It is measured as a dummy variable (1 if male, 0 is female). Sex difference between household head is a key factor of decision and intensity of technology adoption. In most part of rural Ethiopia, females are disfavored groups of the society who could not easily access technology information. Almaz and Begashaw (Citation2019) found that male-headed household was better than female-headed in adoption of tef row planting technology. Therefore, it is hypothesized that male-head households are better than female headed in adoption and intensity of tef technology packages.
Age: It is a continuous explanatory variable, which is measured in number of years from birth. The ability to hear fast and decide on certain key issues and act as favorable to certain information dependents on age of the farmers. Older farmers may have experience and resource that could allow them more possibilities for trying a new technology. On the other hand, younger farmers are more likely to adopt new technology and apply technology packages because they have more schooling than the older. According to Bayissa (Citation2014) and Richard et al. (Citation2020), age was influenced positively the intensity of adoption of improved tef and rice technologies, respectively. Contrary, Mikias (Citation2020) proposed that age of the household head negatively influences the adoption decision and intensity of improved wheat technologies. Therefore, age is hypothesized that influence positively or negatively the adoption intensity of tef production technology.
Education level: Better educated and informed farmers have always been at the forefront of agricultural technology adoption. Education is not only an important determinant of farmers’ adoption decision but also intensity of technology adoption (correctly use the technology). Mesfin (Citation2017) found that education level is significantly influence the adoption and intensity of improved chickpea technology. Therefore, education is hypothesizing that positive influence on adoption decision and adoption intensity of tef technology packages. Level of education measured in terms of number of higher completed grade level.
Tef farming experience: Experience on a specific crop has paramount importance to enhancing farmers’ skill and knowledge on that specific crop production system. According to Bayissa (Citation2014), tef farming experience positively influences farmers’ adoption decision of improved tef technology. Hence, it is expected to influence the probability of tef technology adoption. This was a continuous variable measured in year of experience.
Labor availability: The agronomic practices of tef such as land preparation, weeding and threshing are done by human power. Adequate labor may enhance farmers’ adoption intensity of tef technology packages (Bosena & Susie, Citation2020). Therefore, it is hypothesized that labour availability influenced positively the intensity of improved tef technology packages. It is continuous variable measured in terms of man-day equivalent.
Livestock number: It is a proxy measure of wealth. Farmers who have better livestock numbers would enable farmers to adopt tef production technology by increasing better risk bearing behavior and purchasing power (Bosena & Susie, Citation2020). Hence, it expected that positively influence the adoption decision of improved tef technologies. It is a continuous explanatory variable measured in terms of Tropical Livestock Unit (TLU).
Farm size: It is an indicator of wealth and social status in the community. This indicates that farmers who have relatively large size may initiate to adopt improved technologies. According to Mikias (Citation2020), farm size found to be positively influenced adoption of improved wheat technology. Hence, it hypothesized to have positively influence on the adoption decision of tef technology and measured in hectare.
Number of oxen: It is continuous variable measured in number of oxen owned by the household. Oxen are the main source of traction and drafting power for the farmers. According to Aman and Tewodros (Citation2016), numbers of oxen positively and significantly influence the adoption intensity of improved barley production. Moreover, Gedefaw and Sisay (Citation2019) revealed that, availability of oxen positively and significantly influences adoption of improved wheat seed. Due to the facts that as farmers have a greater number of oxen; they can easily cultivate the wheat land intensively/extensively and implement farm management practice, which increases the production of wheat there by increasing the intensity of adoption. Hence, it is hypothesized that positively influence the adoption intensity of tef production technology.
Frequency of agricultural extension contact: Newly improved technologies in the agriculture sector introduced and distributed through agricultural extension agents for farmers. Hence, frequency of extension contact between farmers and extension agents may create awareness and build the necessary knowledge to adopt the tef technology packages and enhance the intensity of farmers on the adoption practice of the technologies. According to Endeshaw (Citation2019), frequency of agricultural extension contact was positively influence adoption decision and intensity of BH540 maize varieties. Therefore, it is hypothesized positively influence the adoption decision and intensity of tef production technology. It is a continuous variable measured in number of contacted days per year.
Participation on farm training: It may enable farmers to get technical information, knowledge, shape their insight, and hasten the adoption decisions of farmers on the improved technologies. According to Bayissa (Citation2014), farm training positively and significantly influence the adoption decision and intensity of improved tef technologies. Hence, it is expected that participation on tef production training positively influence adoption decision and intensity of tef production technology. It is dummy variable taking the value 1 if household head participated in tef production training and 0 otherwise.
Participation on demonstration: Farmers can improve agricultural knowledge through demonstration to enhance production and productivity. Tef production technology packages need method and result demonstration to ensure the extension system and to increase farmers confidence level on the technology. According to Bosena and Susie (Citation2020), demonstration was positively influencing the adoption decision and intensity of improved tef varieties adoption. Besides, Extended Technology Acceptance model suggested that result demonstration directly influence perceived usefulness. It is positively influencing the intension to use the technology (Venkatesh & Davis, Citation2000). Therefore, it is expected to be positively influence the adoption decision and intensity of improved tef technology. It is a dummy variable taken 1 if household head participated in tef demonstration and 0 otherwise.
Radio ownership: Radio communication is recognized as the most accessible and potentially means of disseminating information related to agricultural technologies. Radio owner farmers may have high probability of using improved technologies. Hence, it is hypothesized radio ownership influenced positively the adoption decision of tef production technology. It is a dummy variable taking value1 if farmers have radio and 0 otherwise.
Plot fragmentation: It is continuous variable measured in number of plots covered by tef. Farmers have fragmented land may unable to manage and implement tef technology components intensively. According to Tesfaye et al. (Citation2014), plot fragmentation was negatively associated with adoption decision and intensity of improved wheat varieties. Therefore, it is expected to be negatively associated with the intensity of adoption of tef production technology.
Distance to input market: First come first serve principle is applying in the input market. Adoption of improved tef technologies may decline as the distance from the input market increase. Bosena and Susie (Citation2020) found that distance to input market was negatively influenced adoption intensity improved tef technology. Hence, it is expected that negatively influence intensity of adoption of improved tef technology. It a continuous variable measured in Km.
Seed multiplication membership: Membership on seed multiplication group is key determinants of adoption of agricultural technology. According to Begashaw (Citation2018), seed multiplication membership had been positively affecting intensity of adoption of tef row planting technology. Hence, it is expected membership on seed multiplication have positive association with intensity of adoption of tef production technology. It is a dummy variable taken 1 if household are a member of tef seed multiplication and 0 otherwise.
Farmers’ cooperative membership: A farmer who is membership of multi-purpose farmers’ cooperative in rural kebeles and different cooperatives are more likely to be aware of new practices as they are easily exposed to information. Cooperative membership may enable farmers to get credit access and enhancing saving behaviors. According to Julius and Jimoh (Citation2020), membership on farmers’ cooperative had positive association on adoption of improved cocoa technologies. Therefore, it is expected that farmers’ cooperative membership influence positively the adoption of decision of tef production technology. It is a dummy variable taken 1 if household are member of farmers’ cooperative and 0 otherwise.
Annual income: It is the proxy measure of wealth. The higher the income level of farmers could not be financially constrained and prohibited from the timely use of tef technology packages. According to Mikias (Citation2020), annual income had positively influence on adoption of improved wheat technology. Hence, it is expected that annual income positively influences intensity of adoption of improved tef technology. It is a continuous variable measured in Ethiopian Birr.
Farmers’ perception: positive perception of farmers on improved technologies will more likely adopt and widely use the technology. According to Bosena and Susie (Citation2020), farmers positive perception was significantly and positively affected the adoption decision of the households. Moreover, according to Almaz and Begashaw (Citation2019), favorable attitude towards tef row planting packages was positively and significantly influenced the adoption of the package. Hence, farmers’ favorable perception towards improved tef technology packages is positively influence the adoption decision of the technology. It is a continuous variable measured in perception score.
Off/non-farm participation: Farmers may engage outside their farm (off-farm) and outside agriculture (non-farm) activities to earn additional income. This is believed to raise financial position to purchasing agricultural inputs. On the other hand, a farmer who participated in off/non-farm activities may give less attention for on farm activates (Gedefaw & Sisay, Citation2019). Hence, it is hypothesized that off/on-farm participation has positive or negative effect on the decision of improved tef technology adoption. It is a dummy variable take 1 if farmers participate and 0 otherwise.
Credit use: Many researchers have confirmed the importance of credit in adoption of agricultural technologies. This may due to that improved agricultural technologies require money to implement packages based on the recommendation. According to Adunea and Fekadu (Citation2019), credit use positively and significantly influenced adoption decision and intensity of row planting of wheat production. Besides, Julius and Jimoh (Citation2020) show that credit use was positively influenced adoption decision and intensity of improved cocoa technologies. Hence, it is hypothesized that credit use has positive influence on the adoption of tef production technology. It is a dummy variable take 1 if farmers get credit from formal credit institution and 0 otherwise.
3. Materials and methods
3.1. Description of the study area
Yilmana Densa is one of the 106 districts of the Amhara National Regional State and found in West Gojjam zone. Adet is the major town in Yilmana Densa district and it is 445 km far from Addis Ababa and 42 km from the capital city of Amhara region, Bahir Dar. Yilmana Densa district is bordered on the South by Kuarit, on the Southwest by Sekela, on the West south Mecha, on the North Bahir Dar Zuria, on the East by the Abay River, which separates it from Debub Gonder zone, and on the Southeast by East Gojjam zone (YDARDO, Citation2019). It is geographically located described in .
Figure 4. Location map of the study area.Source: Ethio Geo-spatial data
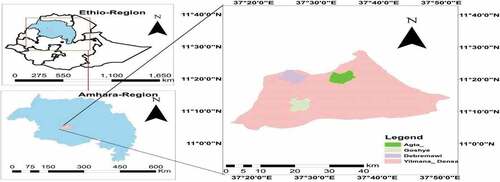
The main farming system in the study area is a mixed farming system including crop production and livestock. Majority of farmers practice a traditional way of crop production such as plowing in oxen, harvesting in sickles, threshing in livestock and human power, sowing in broadcast, and poor land management. According to YDARDO (Citation2019), Tef, wheat, maize, potato, barley, field pea, and finger millet are the major crops grown in the district.
3.2. Sampling and data collection
A multi-stage random sampling technique was employed to select sample household heads for this study. In the first stage, from the total of 19 potential (out of 35 rural KebelesFootnote1) Tef producer Kebeles, three Kebeles were selected using a simple random sampling technique. In the second stage, sample respondents were selected using a systematic random sampling technique from the selected Kebeles. The sample size from each Kebele was taken through population proportion. Availability of sample frames at the Kebele agricultural office and homogeneous socio-economic characteristics of the population were the main reasons for using this type of random sampling technique (Allan, Citation2007). Tef grower farmers in the selected Kebeles were used as the universe of the study and households were the sampling unit of the study. In this study, the sample size was determined using Yemane (Citation1967) formula due to its simplicity.
Where n is the sample size of this study, N is total Tef grower farmers (4380) in the selected Kebele during the survey year (2019/2020) and e the precision level or sampling error, which will be 0.07 in this study because the degree of variability in the population is homogeneous socio-economic characteristics. Based on EquationEquation (1)(1)
(1) , 195 samples were selected. Finally, the researcher adds 15% to the sample size to compensate that the researcher is unable to contact (Israel, Citation2013). Therefore, 224 sample size was selected using population proportion from each selected Kebele.
This inquiry was used a cross-sectional data structure to address the objectives of the study. Quantitative research approach was applied to investigate the determinants of adoption decision and intensity of Tef production technology. Primary data such as demographic, socio-economic, institutional, and plot-level data were collected from 224 Tef grower farmers using structured questionnaires via Kobo ToolboxFootnote2 software using tablet and smartphone. Key informant interview from Kebele administrative body, model farmers, development agents, and district agricultural officers were employed to capture supplementary information and to validate information, which gained from the household survey. Secondary data such as theories and models, empirical evidence, concepts and definitions of key terms, and econometrics concepts, were collected from the journal article, previous studies, agricultural manuals, proceedings, websites, books, and NGOs report via deep review.
3.3. Data analysis
Descriptive statistics such as mean, standard deviation, percentage, and frequency distribution table were used to describe the socio-economics, institutional, and demographic characteristics of the respondents. Furthermore, inferential statistics were used to compare mean (i.e., t-test, and one-way ANOVA) and show interdependency (i.e., Chi-square test) between adoption categories. Pearson correlation was also employed to show the correlation (strength and direction) between continuous variables and adoption intensity of Tef technology packages. On the other hand, the Mann-Whitney U test was used to test do categorical variables differ in terms of their adoption intensity of Tef technology packages or not.
To know the intensity of adoption of Tef production technology, first listed the main components of the technology packages based on Tef production manual, which prepared by ANRSBoA collaborate with ATA and EIAR in 2019. For package study, give equal weights for each package is not acceptable by many researchers because some components are easy to implement, while others are difficult to implement. Besides, all components have not equal contributions for specific crop production and productivity. Many scholars such as Mulugeta (Citation2009), Wuletaw and Daniel (Citation2015), Ogunya et al. (Citation2017), and Julius and Jimoh (Citation2020) gave weight to each package to obtain the intensity of adoption of a given technology. Therefore, this study gave different weights for each package of Tef production technology (see, Appendix ). Based on the weight, Tef grower farmer’s adoption intensity was calculated. Accordingly, the adoption index of the technology was calculated as follow:
Where; ATi is the level or number of packages (plowing frequency, seed type, crop rotation, fertilizer rate, seed rate, sowing method, and weeding frequency) of the ith farmer applied. RTi is the recommended level or number of packages farmers ought to apply (see, Appendix ), ISi is the proportion of score (weight) for each package (see, Appendix ) AIi is adoption index of ith farmer.
3.3.1. Econometrics model
3.3.1.1. Model specification
The specification of econometrics model depends on the nature of a data, and purpose and objective of the study (Wooldridge, Citation2020). There are three alternative models to achieve the objectives of this study (adoption decision and intensity of tef technology packages) such as Tobit, double hurdle, and Heckman two-stage. To identify the model that best identifies the determinants of adoption decision or intensity of adoption of tef production technology, a series of model specification test were carried out in the following sequences. First, the independent double hurdle model was tested against the Tobit specification. Second, the double hurdle model was tested against Heckman model.
3.3.1.2. Double hurdle vs Tobit
For dichotomous dependent (outcome) variable, Probit, Tobit, and logit models are common. Probit and logit models are important to analyze only the decision part. Tobit model is employing to analyze the determinants of decision and intensity of adoption of new technology simultaneously. However, this model is very restrictive. For instance, this model has been revealed to be inadequate to the determinants in bread wheat technology: the adoption decision and the intensity of adoption. Any variable, which determines the probability of adopter also must determine the intensity of adoption, which is not always true (Luchia & Hadush, Citation2018). Even though the explanatory variables, which determine the decision of adoption and intensity of adoption may be in the same direction, but the magnitudes and statistical significance level for these two processes could be quite different. For instance, distance to farmers training center may not be influence adoption intensity of bread wheat technology.
The double hurdle model proposed by Cragg (Citation1971) is more flexible than the Tobit model because it accounts for possible that factors determine the decision to use the technology and intensity of adoption may be different in variable, magnitude, and significance level. That is why recent empirical studies have shown the inadequacy of the Tobit model in cross-sectional data structure and stressing the relevance of alternative approaches (i.e., double hurdle and Heckman two-stage). Double hurdle model assumes farmers faced with two hurdles in any agricultural decision-making processes.
To select appropriate model between double hurdle and Tobit, first estimate the truncated regression model, the Tobit model, and the probit model separately. The Tobit log-likelihood is the sum of the log-likelihoods for the truncated regression and probit models (Wooldridge, Citation2020). The likelihood ratio statistic was computed as follow..
Where..
LR = Likelihood ratio
lnLP = maximized log likelihood for the probit model
lnLT = maximized log likelihood for the Tobit model
lnLTR = maximized log likelihood for the truncated regression model
The null hypothesis (H0) is that the standard Tobit model is appropriate specification. If the calculated likelihood ratio statistic exceeds the critical Chi square (LR >χk2) value, the Tobit will be rejected in favor of the double hurdle model (Wooldridge, Citation2020). The model specification result shows that the calculated value 333.20 is greater than the tabulated or critical value of chi-square at (0.05, 13) = 22.36. Therefore, there is enough evidence to reject null hypothesis (see, Appendix ). This is an indication of the existence of two separate decision-making stages in which individuals make independent decision regarding to adoption decision and intensity of adoption.
3.3.1.3. Double hurdle vs Heckman two-stage model
The final quarter of twentieth century saw important advances in econometric models for analyzing limited dependent variables. The 2000 Economics Nobel Prize award winner James Heckman was developed tools for handling sample selection. Sample selection bias occurs when the availability of data influenced by a selection process related to the value of the dependent variable (Stock & Watson, Citation2019).
To select appropriate model between double hurdle and Heckman two-stage use the Chi-square statistic to test selection bias (). Under H0, there is no selection bias. If there is no evidence of sample selection, there is no reason to use Heckman-two stage. In this case double hurdle model is appropriate (Wooldridge, Citation2020). Results of the double hurdle versus Heckman two-stage selection (inverse mills ratio or lambda Prob>chi2 = 0.3782) is insignificant at 10%. This shows that there is no selection bias. Hence, there is no enough evidence to reject H0 (see, Appendix ). Therefore, in this study the determinants of adoption decision and intensity of tef technology adoption was estimated by independent double hurdle model. The rejection of Heckman selection model disproves the claims that the zero level of adoption in the data is the result of adoption decision alone.
Eventually, it can be concluded that both Heckman and standard Tobit specification are inadequate to model the adoption decision and intensity of adoption of tef production technology. The test reveals that the decision to adopting and the amount of use of tef technology packages follow two independent decision paths. Therefore, the double-hurdle model is the appropriate model to identify factors that affecting both stages. Many scholars used double hurdle model to estimate adoption decision and intensity of crop technology such as Bayissa (Citation2014), Tesfaye et al. (Citation2014), Tadele (Citation2016), Daniel et al. (Citation2017), Gedefaw and Sisay (Citation2019), and Bosena and Susie (Citation2020).
Double-hurdle model estimation procedure involves running a probit model regression to identify factors affecting the decision to adopt using all sample population in the first stage and truncated regression model on the adopter households to analyze the intensity of adoption in the second stage. In the double hurdle model, there is no restriction regarding the element of explanatory variables in each decision. This implies that it is possible to separately analyze the determinants of adoption decision and the intensity of improved Tef technology adoption. The first stage in the double- hurdle model is the decision to adopt (γ¡) improved Tef technologies expressed as follow:
Where: is the latent (unobserved) variable and γ¡ is the observed variable that takes the value of 1 if a household grows improved Tef variety (
) and 0 otherwise (if
). χ¡ a vector of household variables such as socio-economic, demographic, and institutional variables influencing the adoption of the technology and α a vector of parameters. ε¡ is the combination of unobserved variables of the first hurdle. The second stage of the double-hurdle model was expressed as follow:
Where: is the latent variable describing the intensity of adoption of Tef production technology and t¡ observed variable. Z¡ is a vector of variables influencing how much the households use the technology and β is a vector parameter. ν¡ is the combination of unobserved variables of the second hurdle. This study assumed that the two error terms in EquationEquations (4)
(4)
(4) and (Equation5
(5)
(5) ) are independent and normally distributed.
The log-likelihood function of Cragg’s (independent double hurdle) model is the sum of the log- likelihood function from probit and a truncated regression. Letting Φ denote a standard normal Cumulative Distribution Function (CDF) and ϕ denotes a standard normal density function.
3.3.1.4. Diagnostic test for econometrics problems
If there is an econometrics problem in a variable, it reduces the precision of other regressors. Therefore, this step is done before analyzing the data; it is referred to as a priori (before the fact) reasoning (James & Mark, Citation2019). Hence, in this study before doing anything in the econometrics model, econometrics problems (i.e., heteroscedasticity, multicollinearity, omitted variable bias, and normality) were detected and remedy mechanism was taken.
3.3.1.5. Multicollinearity
An important CLR assumption is that the independent variables are not perfectly multicollinearity. One explanatory variable should not be a linear function of another (Wooldridge, Citation2020). In this study, multicollinearity was tested using Variance Inflation Factor (VIF) for continuous variables and Contingency Coefficient (CC) for categorical variables. The value of VIF computed using EquationEquation (7)(7)
(7) .
Where, R2 stands for square multiple correlation coefficients between
and another explanatory variable. In practice, there is no variable, which not correlated with other explanatory variables. The issue is, it is serious problem or not. If the VIF values exceed 10, the problem is serious. When the VIF value greater than ten, standard error may be inflated (Green, Citation2018). Contingency Coefficient was computed using the following formula:
Where, stands for chi-square and
stands for sample size. If CC value exceeds 0.75, the correlation is serious problem (Green, Citation2018). In this study, VIF and CC were computed, separately for first and second hurdle because there is a variable difference between the two steps. Both CC and VIF were computed using STATA 15.1.
In the first hurdle (probit) and second hurdle (truncated), multicollinearity for continuous variables were detected separately using VIF after regression. The maximum and mean VIF value for first hurdle (probit) was 1.47 and 1.20, respectively (see Appendix ). On the other hand, 40.66 and 9.97 were the maximum and average VIF value of the second hurdle (see, Appendix ). Age and age square are related (VIF value was 40.66) since one is the square of the other. They are ok since age has a quadratic relationship with the dependent variable (Wooldridge, Citation2020). In both case the VIF value was below the threshold value (>10 or 1/VIF < 0.10). Therefore, there was no serious multicollinearity problem between continuous variables in double hurdle model.
On the other hand, collinearity problem for categorical variables was identified by using correlation matrix for probit (first hurdle) and truncated regression (second hurdle), separately. The maximum pair wise correlation value of categorical variables in the first hurdle were 0.397 (see Appendix ). On the other hand, 0.311 was the maximum correlation value of the second hurdle (see Appendix ). Therefore, there was no serious collinearity problem (<0.75) between categorical variables in the double hurdle model.
3.3.1.4. Heteroscedasticity
One of the major assumptions of Classical Linear Regression (CLR) is the variance of the error term is constant (homoscedasticity). If the variance is not constant, there is heteroscedasticity. If the regression error is heteroskedastic, those standard errors are not a reliable basis for hypothesis tests and confidence intervals (James & Mark, Citation2019). In this study, the heteroscedasticity problem was tested only for second hurdle using Bruch pagan test. For the first hurdle, variance is a function of the mean. It is never constant; there is no assumption of homoscedasticity, so no need for test. When the dependent variable is a binary, the model must contain heteroscedasticity, unless all the slope parameters are zero (Wooldridge, Citation2020).
This study was used Breush-pagan test to detect heteroscedasticity for truncated regression. The null hypothesis is that residuals are homogeneous. However, the Breush-pagan test result (Prob > chi2 = 0.0000) shows there was evidence to reject null hypothesis at 99% confidence level (see Appendix ). Therefore, there was heteroscedasticity in double hurdle model. The problem with this is that may have the wrong estimates of the standard errors for the coefficients and their t-values. As a result, this study was used robust standard error to fix heteroscedasticity.
3.3.1.5. Omitted variable test
Insert an irrelevant variable and excluding the relevant variables to regression equation leads to misspecification of the model. The most widely used general specification test is Ramsey’s Regression Specification Error Test [RESET (Green, Citation2018)]. The null hypothesis is that the model does not have omitted variables bias. According to Ramsey RESET test result (Prob > F = 0.1017) there is no enough evidence to reject the null hypothesis (see Appendix Therefore, there is no omitted variable bias in double hurdle model.
3.3.1.6. Marginal effect after probit regression
In most econometrics analysis, once parameters estimate from the probit, logit, and Tobit regression are obtained, a natural next step is to consider the marginal effects. Regression analysis usually aims at estimating the marginal effect of an explanatory variable on the dependent variable, controlling for the influence of other explanatory variables. In the linear regression analysis (i.e., truncated regression), the estimated parameters can be interpreted as marginal effects. In non-linear regression models or the binary regression models (i.e., probit), parameter estimates cannot be interpreted as marginal effects. The marginal effect of an explanatory variable is obtained by calculated the derivation of the outcome probability with respect to an explanatory variable (Green, Citation2018).
4. Result and discussion
4.1. Independent variables by adoption of Tef production technology
As shown in , there is no significance mean difference between adopters and non-adopters in Tef farming experience and annual income. However, there is a significance mean difference between adopters and non-adopters in age, education level, and labor at 5% level of significance. Furthermore, there is a mean difference between adopters and non-adopters in number of Tef plot, total land size, number of oxen, frequency to extension contact, livestock number, perception, and distance to input market at 1% level significance. This implies that adopters are old, more educated, have solid Tef farming experience, have more labor, have fragmented plot, have positive perception, and have frequent extension contact than non-adopters.
Table 1. Independent t-test for continuous explanatory variables
As shown in , Tef farming experience, numbers of Tef plot, total land size, perception, and labour have negative small correlationFootnote3 with intensity of adoption. On the other hand, number of oxen, number of livestock, annual income, age, and education level had positive small correlation with intensity of adoption. Surprisingly, there is positive strong correlation between frequency of extension contact and intensity of adoption.
As shown in , the Chi-square test revealed that there is statistically significant relationship (dependency) between adoption decision and sex of household head at 1% level of significance. The result also shows that the proportion of male-headed households that were adopter is 83.77%, whereas only 48.48% of female-headed were adopter. Likewise, participation on demonstration, credit use, membership on farmers’ cooperative, radio ownership, membership on seed multiplication, and farm related training have significant relationship between adoption decision. However, there is no statistically significance relationship between adoption decision and off-farm involvement.
Table 2. Chi-square test for categorical explanatory variables
According to the Mann-Whitney U test result, there is statistically significance difference between demonstration participant and non-participant households in intensity of adoption of Tef technology packages at 1% level of significance (see, ). The same is true for seed multiplication membership (member and non-member), credit use (User and non-user), and off/non-farm participation (participant and non-participant). However, there is no statistically significant difference between male and female-headed households in intensity of adoption of Tef technology packages at 1% level of significance. The same is true for cooperative membership (member and non-member), farm training (participant and non-participant), and radio ownership (yes and no).
4.2. Determinants of adoption of Tef technology
The first hurdle indicates how a given variables determine the likelihood of adoption of Tef technology packages. The second hurdle indicates how variables affecting the intensity of adoption of Tef production technology. As shown in , the Wald chi-square value 90.64 is statistically significance at 1% level of significance indicates that the explanatory variables in the model jointly explain both the probability of adoption and intensity of adoption of Tef production technology.
Table 3. Estimates of double hurdle model for adoption of Tef production technology
Frequency of extension contact was positively and significantly influenced the adoption decision of Tef production technology at 1% level of significance. The marginal effect shows that one more extension contact of farmers with agricultural extension experts increases the probability of Tef technology adoption by 5.9%, ceteris paribus. This implies that frequently extension contact creates knowledge and updated information about Tef production technology. The result is harmony with the study by Debelo (Citation2015) frequency extension contact between farmers and extension agents was positively and significantly influence on adoption decision Quncho Tef in Wayu Tuqa district, respectively.
The probability of Tef technology adoption was influenced positively and significantly by farmers’ perception towards different attributes of improved Tef varieties at 10% level of significance. The marginal effect shows that farmers’ who have more positive attitudes toward improved Tef variety attributes increases the probability of adoption of Tef technology by 6.6%, held other variables constant. This implies that farmers’ favorable perceptions towards different attributes of improved Tef variety would keen to use improved Tef technology. This result is harmony with the finding of Bayissa (Citation2014) and Almaz and Begashaw (Citation2019).
Membership in farmers’ cooperative positively and significantly influenced the adoption decision of Tef technology at 1% level significance. The marginal effect revealed that being a member of farmers’ cooperative increases the probability of adoption of Tef technology by 37.7%, held other variables constant. This implies that being member in farmers’ cooperative might assist farmers to facilitate access to agricultural input and market information. This result agrees with the study by Garba (Citation2016) and Zekarias (Citation2019).
Participation on-farm training in relation to Tef production was significantly and positively influenced the adoption decision of improved Tef technology at 5% significance level. All other variables held constant, participate on farm training increases the probability of Tef technology adoption by 11.2%. This indicates that farm training might enabling farmers to acquire sufficient knowledge and skill regarding to the improved Tef technology, which make the respondents more likely to adopt the technology. The result is harmony with the study by Bayissa (Citation2014).
Contrary to the expected, the coefficient of livestock number was negatively influenced adoption decision of Tef production technology. This might be farmers who have more livestock number may engaged in fattening and husbandry, due to this, they may have few times for crop production. Hence, livestock number may be affected adoption of Tef production technology negatively. Fortunately, it has not significance influence on adoption decision. The result is consistent with Ashenafi and Oliyad (Citation2020).
4.3. Determinants of intensity of adoption of Tef technology packages
As shown in the second hurdle (truncated regression), six predictor variables from 13 explanatory variables were significantly determined the intensity of adoption of recommended Tef technology packages (see ). Frequency of extension contact, training, participation on demonstration, and seed multiplication membership were positively and significantly influenced intensity of adoption, whereas number of plots covered by Tef and distance to input market were adversely influenced intensity of adoption of Tef technology packages.
Frequency of extension contact was found to be positively and significantly influenced intensity of adoption of Tef technology packages at 1% level of significance. The marginal effect results shows that intensity of adoption of Tef technology packages increases by 3.3 % as for each additional extension contact between farmers’ and extension agents, held other variables constant. The plausible reason is that farmers frequent extension contact make farmers have more confidence and being more aware on how can they apply about the technology. This result is consistence with other adoption studies by Bosena and Susie (Citation2020), and Julius and Jimoh (Citation2020).
Training is one of a means by which farmers get information and knowledge about Tef production technology. The second-hurdle result revealed that attend in farm training positively and significantly influenced intensity of adoption at 10% level of significance. The marginal effect results shows that when compared to non-participation, being participant in farm training increase the intensity of adoption by 2.4%, held other variables constant. The result implies that providing training for farmers related to all packages of Tef production technology might enabling them more confidence and have enough important information about the technology. This result is consistent with previous studies by Andualem (Citation2012), Mesfin (Citation2017), and Ashenafi and Oliyad (Citation2020).
Participation on demonstration positively and significantly influenced intensity of adoption of Tef technology packages at 10% significance level. The result indicates that households who have participated on demonstration were applied more Tef production technology components than non- participant. The result implies that demonstration could enhance farmers confidence through result demonstration (seeing is believe) and advance their knowledge through method demonstration (learning by doing). As compared to farmers who are non-participants, participants on demonstration increases adoption intensity of Tef technology packages by 2.6%, while all other variables held constant. The result is comparable to previous adoption studies by Begashaw (Citation2018), and Gideon et al. (Citation2018).
Distance to input market negatively and significantly influenced intensity of adoption of Tef technology packages at 1% level of significance. When other variables held constant, 1 Km distance increase of input market from farmers residence, adoption intensity of improved Tef technology packages decrease by 3.8%. This implies that the nearest farmers can get market information and agricultural inputs (fertilizer, certified improved seed, insecticide, and herbicide on time from primary cooperative) than distant farmers. The result is consistent with previous studies by Endeshaw (Citation2019) found that distant farmers from input provider centers were affect negatively the adoption decision and intensity of improved maize BH540.
Participation on seed multiplication significantly and positively influenced the adoption intensity of improved Tef technology packages at 5% level of significance. As depicted in , being member of seed multiplication group increases the farmers’ intensity of adoption of Tef technology packages by 3.6% all other variables held constant. This implies organizing farmers to be a member of Tef seed multiplying group would help them to get seed loan, fertilizer, and access to extension information. Moreover, the result suggests that strengthening and expanding Tef seed multiplication have indispensable importance to enhance sustainable seed supply system and intensity of adoption in the study area. This result consistent with previous studies, Biniam et al. (Citation2019) found that membership in seed multiplication influence positively and significantly, the adoption intensity of Jalenea potato in Southern Ethiopia.
Eventually, plot fragmentation negatively and significantly influenced intensity of adoption of Tef technology packages at 1 % level of significance. An increase the number of fragmented Tef land by one plot the intensity of adoption of Tef technology packages decreased by 3.8%, while other variables held constant. This implies that farmers may unable to manage and apply recommended practice widely, when they have fragmented plot. This result supported by (Tesfaye et al., Citation2014; Workineh et al., Citation2020). They found that plot fragmentation had been negatively influencing adoption intensity of improved wheat technology.
5. Conclusions and recommendations
5.1. Conclusions
According to the inferential statistics result of this study, there is a significance difference between adopter and non-adopter farmers in relation to age, education level, labour, livestock number, land size, distance to input market, oxen number, tef plot number, and frequency of extension contact. There is also a significance association between adoption category with relation to sex of household head, demonstration participation, credit use, farmers’ cooperative membership, attend in training, seed multiplication membership, off/non-farm participation, and radio ownership.
Based on the results of double hurdle model, the findings confirm that frequency of extension contact, agricultural training, farmers perception towards the improved tef technology, and farmers’ cooperative membership have increased the probability of adoption of tef production technology. The findings also confirm that frequency of extension contact, agricultural training, demonstration, and seed multiplication membership have increased the intensity of adoption of tef production technology. The findings also confirm that input market distance, and plot fragmentation are major bottlenecks to adopt the technology extensively.
5.2. Recommendations
The findings revealed that seed multiplication membership positively and significantly influenced the intensity of adoption of tef production technology. Therefore, Amhara Seed Enterprise and Bureau of Agriculture should be expanded farmer-based seed enterprises in rural areas in such away it meets extensive applications of improved tef production technology.
Farmer’s training and frequency of extension contact were positively and significantly influenced the decision and intensity of adoption of tef production technology. Hence, Kebele agricultural extension agents should organize regular training for farmers in relation to improved tef production technologies; moreover, extension agents should carry out field observation, and build good rapport with farmers.
Tef row planting method are consume high labour and time . Due to this reason, farmers prefer broadcast planting method even if they accepted high yield and convenient for field management attributes of the technology. Therefore, Ministry of Agriculture should avail easy, efficient, and least time and low labour consumer row planter machines for farmers with lesser price. Post-harvest practice of tef production technology can be future research priorities.
Disclosure statement
No potential conflict of interest was reported by the author(s).
Additional information
Funding
Notes on contributors

Atrsaw Anteneh Mihretie
Atrsaw Anteneh Mihretie is a lecturer and researcher at the department of Rural Development and Agricultural extension, Mekdela Amba University, Ethiopia, where he teaches course introduction to agricultural extension, introduction to rural development, and rural development policies and strategies at the undergraduate level. His research interest includes adoption, perception, and impact evaluation studies.
Girmachew Siraw is a lecturer and researcher at the department of Rural Development and Agricultural Extension, Bahir Dar University, Ethiopia. His main research activities are adoption, food security and impact studies.
Azanaw Abebe is a lecturer and researcher at the department of Rural Development and Agricultural Extension, Bahir Dar University, Ethiopia. His main research activities are adoption, rural cooperative, community development and impact evaluation studies.
Notes
1. Kebele is the smallest administrative unit of Ethiopia.
2. KoBo Toolbox is a free open-source tool for mobile data collection, available to all. It allows collecting data in the field using mobile devices such as mobile phones or tablets, as well as with computers.
3. r = 0.10 to 0.29 or—0.10 to—0.29 Small,
r= 0.30 to 0.49 or −0.30 to −0.49 Medium,
r=0.50 to 1.00 or −0.50 to −1.00 large (Julie, Citation2005).
4. Farmers sow in If Vertisols and Nitosols, weight for each package could be 0.05.
5. If farmers have Vertisols and Nitosols, weight for each package could be 0.0625.
6. Farmers have Vertisols and Nitosols, weight for each package could be 0.0625.
References
- Ademe, M., & Asmiro, A. (2018). Pre-scaling up of improved Tef technologies in moisture deficit a reas of Wag-Lasta, Eastern Amhara, Ethiopia. Research puplication communication and knowldge management directorate. ARARI, Bahir Dar.
- Adunea, D., & Fekadu, B. (2019). Adoption determinants of row planting for wheat production in Munesa District of Oromia Region, Ethiopia. Journal of Agricultural Extension and Rural Development, 11(2), 25–25. https://doi.org/10.5897/JAERD2018.0993
- Agricultural Transformation Agency (ATA). (2017). Agricultural Transformation Agenda Annual Report 2015–2016. Addis Abeba.
- Ajzen, I., & Fishbein, M. (1975). Belief, attitude, intention and behavior: An introduction to theory and research. Addison-Wesley.
- Allan, G. B. (2007). Elementary statistics step by step approach (7th ed.). McGraw-Hil.
- Almaz, G. (2008). Adoption of chickpea technology package in ada’a and akaki woredas, Eastern Shewa, Ethiopia [ M.Sc.Thesis]. Haramaya University.
- Almaz, G., & Begashaw, M. (2019). The role of gender on adoption of row planting of tef [Eragrostis Tef (Zucc.) Trotter] in Central Ethiopia. Ethiopian journal of science and technology, 12(1), 19–43. https://doi.org/10.4314/jest.v12i1.2
- Aman, T., & Tewodros, T. (2016). Determinants of improved barley adoption intensity in Malga District of Sidama Zone, Ethiopia. International journal of agricultural economics, 1(3), 78–83. https://doi.org/10.11648/j.ijae.20160103.15
- Andualem, T. (2012). Factors determining farmers adoption of chickpea technology package in Dembia District of North Gondar Zone. University of Gonder.
- Ashenafi, G., & Oliyad, S. (2020). Factors affecting adoption and its intensity of malt barley technology package in Malga woreda Southern Ethiopia. Journal of agricultural economics and rural development, 6(1), 697–704. https://www.premierpublishers.org/ajaerd/201120197774.pdf
- ATA & EIAR. (2019). Amhara National Regional State Bureau of Agriculture 2011/12 E.C Tef (Eragrostis tef (Zucc.) Trotter) Production Manual.
- ATA. (2014). The new agricultural input sale system. Addis Ababa.
- Bayissa, G. (2014). A double-hurdle approach to modeling of improved Tef technologies adoption and intensity use in Case of Diga District of East Wollega Zone. Global Journal of Environmental Research, 8(3), 41–49. https://www.idosi.org/gjer/gjer8(3)14/2.pdf
- Begashaw, M. (2018). Determinants of adoption of Teff (Eragrostis tef) row planting technology in Moretna Jiru Woreda. North Shoa Zone of Amhara Regional State.
- Biniam, T., Rahmeto, N., & Amanuel, S. (2019). Determinants of adoption of improved Jalenea potato variety: The case of Chencha Woreda, Southern Ethiopia. Journal of Development and Agricultural Economics, 11(7), 170–185. https://doi.org/10.5897/JDAE2018.1041
- Bosena, T., & Susie, T. (2020). Determinants of adoption of improved Teff varieties by smallholder farmers: The case of Kobo District, North Wollo Zone, Amhara Region, Ethiopia. International Journal of Agricultural Economics, 5(4), 114–122. https://doi.org/10.11648/j.ijae.20200504.14
- CIMMYT. (1993). The Adoption of Agricultural Technology: A Guide For Survey Design.
- Cragg, J. (1971). Some statistical models for limited dependent variables with application to the demand for durable goods. The Econometric Society, 39(5), 829–844 .
- CSA. (2019). The Federal Democratic Republic of Ethiopia Central Statistical Agency Agricultural Sample Survey 2018/19 (2011 E.C.), Addis Ababa Ethiopia.
- Daniel, M., Belaineh, L., Jema, H., & Lemma, Z. (2017). Determinants of the adoption of improved white haricot beans in east Shewa zone, South-Eastern Ethiopia. Journal of development and agricultural economics, 9(12), 355–372. https://doi.org/10.5897/JDAE2017.0860
- Dawit, A., Rashid, S., & Tripp, R. (2010). Seed system potential in Ethiopia: Constraints and opportunities for enhancing the seed sector. International Food Policy Research Institutes.
- Debelo, D. (2015). Analysis of factors influencing adoption of quncho Tef: The case of Wayu Tuqa District. International Journal of African and Asian, 12, 20–28. https://iiste.org/Journals/index.php/JAAS/article/download/24777/25380
- Demeke, M., & Di Marcantonio, F. (2013). Analysis of incentives and disincentives for wheat in Ethiopia. Technical notes series, MAFAP, FAO. https://www.fao.org/in-action/mafap/resources/detail/en/c/394278/
- Endeshaw, G. (2019). Determinants of adoption of improved maize bh540 variety among smallholder farmer: The case of Dera woreda, south Gonder zone. University of Gonder.
- Garba, U. (2016). Factors influencing adoption of recommended Irish potato production practices in Kudan and Giwa Local government Areas of Kaduna State. Zaria, Nigeria. Ahmadu Bello University.
- Gedefaw, A., & Sisay, D. (2019). Factors influencing adoption of improved seed among wheat producing smallholder farmers’ In West Gojjam Zone of Amahara Region, Ethiopia. Journal of Agriculture and Crops, 5(4), 48–56. https://econpapers.repec.org/RePEc:arp:jacarp
- Gideon, D. A., Joshua, A. B., Dennis, S. E., & Franklin, N. M. (2018). Adoption of improved maize variety among farm households in the northern region of Ghana. Cogent Economics & Finance, 5(14), 1–14. https://doi.org/10.1080/23322039.2017.1416896
- Green, W. H. (2018). Econometric Analysis. Prentice Hall.
- Hailu, T., Ayele, M., & Assefa, K. (1995). Improved varieties of tef (Eragrostis tef) in Ethiopia: Releases of 1970–1995. Debre Zeit (Ethiopia) Debre Zeit Agricultural Research Center.
- Israel, G. D. (2013). Sampling the evidence of extension program impact. IFAS Extension.
- James, H. S., & Mark, W. W. (2019). Introduction to econometrics (Vol. 4). Pearson Education, Inc.
- Julie, P. (2005). SPSS Survival Manual: A step by step guide to data analysis using SPSS for Windows. Version 12. Crows Nest.
- Julius, O. I., & Jimoh, A. A. (2020). Determinants of adoption of improved cocoa technologies in Ekiti State, Nigeria. International Journal of Agricultural Economics, 5(2), 36–42. http://www.sciencepublishinggroup.com/journal/paperinfo?journalid=232&doi=10.11648/j.ijae.20200502.11
- Kebebew, A., Solomon, C., & Zerihun, T. (2013). Achievements and Prospects of Tef Improvement. Ethiopian Institute of Agricultural Research, Addis Ababa, Ethiopia.
- Loevinsohn, M., Sumberg, J., Diagne, A., & Whitfield, S., (2013). Under what circumstance and condisions does adoption of technology result in increased agricultural productivity. Institute of development studies.
- Luchia, T., & Hadush, H. (2018). Determinants of intensity of bread wheat packages adoption in Tigray, Northern Ethiopia. Turkish Journal of Agriculture-Food Science and Technology, 6(9), 1101–1107. https://doi.org/10.24925/turjaf.v6i9.1101-1107.1757
- Martin, Z., Mekonnen, M., & Thomas, B. (2014). Teff (Eragrostis tef) as a raw material for malting, brewing, and manufacturing of gluten-free foods and beverages: Review. Journal of Food Science and Technology 51(11), 2881–2895. https://doi.org/10.1007/s13197-012-0745-5
- Mesfin, F. (2017). Adoption of improved chickpea technologies in north Gonder zone. Uiversity of Gonder, Ethiopia.
- Mikias, D. (2020). Analysis on determinants of adoption of improved wheat technology in Liben Jewi District, Oromia Region, Ethiopia. International Journal of Applied Agricultural Sciences, 6(3), 36–43. http://www.sciencepublishinggroup.com/journal/paperinfo?journalid=343&doi=10.11648/j.ijaas.20200603.12
- Mulugeta, A. (2009). Determinants of intensity of adoption of old coffee stumping technology in Dale Wereda. Haramaya University.
- Ogunya, L. O., Simeon, A. B., & Ayodeji, S. O. (2017). Factors influencing levels and intensity of adoption of new rice for Africa (Nerica) among rice farmers in Ogun State, Nigeria. International Journal of Agricultural Economics, 2(3), 84–89. https://doi.org/10.11648/j.ijae.20170203.15
- Richard, K., Gupta, A., Helena, O., & Abawiera, C. (2020). Adoption and impact of modern rice varieties on poverty in Eastern India. Science Direct, 27(1), 56–66. https://doi.org/10.1016/j.rsci.2019.12.006
- Rogers, E. M. (1983). Diffusion of Innovations (3rd ed.). Collier Micchigan publisher.
- Rogers, E. M. (2003). Diffusion of innovation (5th ed.). Free Press.
- Stock, J. H., & Watson, M. W. (2019). Introduction to econometrics. Times NR MT Pro by Cenveo.
- Tadele, T. (2016). Adoption and intensity of row-seeding (case of Wolaita zone). Open Access Liberary Journal, 3(e2443), 1–12. https://doi.org/10.4236/oalib.1102443
- Tesfaye, S., Ayele, T., & Adam, B. (2014). Adoption of improved wheat varieties in Robe and Digelu Tijo districts of Arsi zone in Oromia Region, Ethiopia: A double- hurdle approach. African Journal of Agricultural Research, 9(51), 3692–3703. https://doi.org/10.5897/AJAR2014.9047
- Venkatesh, V., & Davis, F. (2000). A theoretical extension of the technology acceptance model: Four longitudinal field studies. Management Science, 46(2), 186–204. https://doi.org/10.1287/mnsc.46.2.186.11926
- Wooldridge, J. M. (2020). Introductory econometrics (7th ed.). Pearson.
- Workineh, A., Tayech, L., & Ehite, H. (2020). Agricultural technology adoption and its impact on smallholder farmer’s welfare in Ethiopia. African Journal of Agricultural Research, 15(3), 431–445. https://doi.org/10.5897/AJAR2019.14302
- Wuletaw, M., & Daniel, T. (2015). Determinants affecting adoption of malt-barley technology: Evidence from North Gonder Ethiopia. Journal of Food Security, 3(3), 75–81. https://doi.org/10.12691/jfs-3-3-2
- YDARDO. (2019). Yilmana Densa District Agricultural information manual.
- Yemane, T. (1967). Statistics: An introductory analysis (2nd ed.). Harper and Row.
- Zekarias, B. (2019). Empirical review of food crop technologies adoption in Ethiopia: Meta- analysis. Global Journal of Nutrition and Food Science, 1(5), 1–11. https://doi.org/10.33552/GJNFS.2019.01.000525
Appendix
Table A1. Weights and methods of rating to calculate intensity of adoption
Table A2. Omitted variable test using Ramsey reset for 2nd hurdle
Table A3. Multicollinearity test using vif for 1st hurdle (probit) variables
Table A4. Breusch-Pagan/Cook-Weisberg test for heteroscedasticity for 2nd hurdle
Table A5. Multicollinearity test using VIF for 2nd hurdle (Truncated) variables
Table A6. Collinearity test for 1st hurdle (Probit) categorical variables
Table A7. Collinearity test for 2nd hurdle (Truncated) categorical variables
Table A8. Tobit model vs. Double-Hurdle model
Table A9. Independent double hurdle vs Heckman two-stage model
Table A10. Recommended fertilizer rate for some Ethiopia districts
Table A11. Recommended management practices for tef production