
 ?Mathematical formulae have been encoded as MathML and are displayed in this HTML version using MathJax in order to improve their display. Uncheck the box to turn MathJax off. This feature requires Javascript. Click on a formula to zoom.
Abstract
Devaluation of domestic currency is traditionally believed to foster a country’s trade balance. Innumerable papers have attempted to scrutinize the exchange rate-trade balance nexus in many countries across the globe, yet their conclusions diverge as they utilize different data, time frames, and methods. Most of them share the same weakness: disregarding the role of vehicle currency. Even though the literature about China is relatively large, no study has scrutinized the asymmetric impacts of vehicle currency and real effective exchange rate on China’s total trade balance with the entire EU. This research gap is especially notable in the circumstances that the EU has surpassed the USA to become China’s largest trading partner, and USD is the vehicle currency heavily employed in China-EU trade. This article aims to fill the aforesaid gap by applying the nonlinear ARDL method to investigate how USD as a vehicle currency, alongside real effective exchange rate, asymmetrically influences China’s trade balance with the whole EU. The empirical results indicate both long-run and short-run asymmetries in all models, and China’s trade balance reacts differently to the two kinds of exchange rates. The findings are robust in the EU-28 and EU-27 cases, and some useful implications are provided for policy-makers.
PUBLIC INTEREST STATEMENT
In the global trade, USD is the most utilized currency for settling exports and imports. The trade between China and the EU also substantially employs USD, but no research has covered its importance. This paper is the first to examine the nonlinear impacts of USD as a vehicle currency, along with real effective exchange rate, on China’s trade balance with the whole EU. The findings indicate the vital role of USD as a vehicle currency in China’s trade with the entire EU-28 as well as the EU-27: when CNY appreciates against USD, China’s trade balance is facilitated. Besides, when CNY depreciates against the EU’s currencies, China’s trade balance is encouraged. This paper suggests that the role of USD as a vehicle currency should not be ignored when analyzing the relationship between exchange rate and trade balance. Also, the effectiveness of currency depreciation is subject to the choice of currency.
1. Introduction
China is one of the most remarkable emerging and developing economies in Asia as well as in the world with impressive statistics on economic growth and international trade. The nominal GDP of China substantially expanded by about 12 times from approximately 1,211 billion dollars in 2000 to 14,343 billion dollars in 2019.Footnote1 The fast growth of China is even more noticeable when she climbed from the 6th position in 2000 to the 2nd place in 2010 in the ranking of highest-GDP countries, surpassing Japan, Germany, United Kingdom, and France1. Additionally, in 2019, the nominal GDP of China nearly tripled Japan and was around 7,000 billion dollars behind the USA1. Besides, China is second only to the USA as the biggest international trader during 2000Q1–2018Q1, occupying around 9% of the world’s total trade value.Footnote2 Moreover, China has the highest trade surplus of all countries in the same period while the USA stands at the top of the largest trade deficit2. Although the economic growth and international trade of China are notable, they are not free from criticism. The large deficit of the USA in trading with China is often deemed resulting from the undervalued Chinese yuan renminbi (Bahmani-Oskooee & Zhang, Citation2013; Devadoss et al., Citation2014; Groenewold & He, Citation2007; Weber & Shaikh, Citation2021). This belief is partly supported by many studies proving that Chinese yuan renminbi (CNY) depreciation against USD boosts China’s trade balance with the USA (e.g., Bahmani-Oskooee et al., Citation2018; Bahmani-Oskooee & Wang, Citation2006; Hunter, Citation2019; Hurley & Papanikolaou, Citation2018; Narayan, Citation2006; Wahab et al., Citation2020; Wang et al., Citation2012). Thus, the issues of China’s big trade surplus and CNY undervaluation remain being criticized in the recent trade dispute between the USA and China, albeit some studies argue that they are not necessarily the culprits (e.g., Liu & Woo, Citation2018; Wang, Citation2020).
So much attention has been given to the trade of China with the USA, presumably because the USA had been the largest trading partner of China. Namely, in the period 2000Q1–2018Q1, the total trade value of China with the USA is more than 6,151 billion dollars, occupying around 13.53% of China’s total trade2. Meanwhile, the EU is the second-largest trading partner of China with the trade value of nearly 6,058 billion, holding more than 13.33% of China’s total trade2. Thus, the gap between the USA and the EU is not so considerable. In fact, it is smaller than the gap between the EU and the third-largest trading partner of China—Asian Emerging Markets and Developing Economies which constitute 11.02% of China’s total trade with the absolute value of approximately 5,010 billion dollars2. From the above statistics, it is obvious that the EU is a crucial trading partner of China. However, the existing literature shows little focus on China-EU trade. This neglection is more noticeable when the EU surpassed the USA in the first quarter of 20192 to become the largest trading partner of China (European Commission, Citation2021). Moreover, China is also the second-largest trading partner of the EU (European Commission, Citation2021). Thus, the trade relationship between China and the EU-27 plus the UK have long been reciprocally important, and it is more noteworthy during the China-USA trade conflict when high barriers exacerbate the export and import of the involved countries, but they can create opportunities for others (Li et al., Citation2018). China can seek an alternative market for the USA during the trade war, and the EU is likely a sound selection when the EU-China Investment Agreement will play a key role in their future long-term relationship (European Commission, Citation2021; Wahab et al., Citation2020). Despite the prominence of China-EU trade, only a few studies (e.g., Bahmani-Oskooee et al., Citation2018; Bahmani-Oskooee & Wang, Citation2006; Wang et al., Citation2012) have covered the trade between China and several EU partners alongside the UK such as Belgium, France, Germany, Italy, the Netherlands, and Spain. Accordingly, no research has investigated the trade between China and the whole EU-28 as well as EU-27. Moreover, nearly all papers overlook the role of vehicle currencyFootnote3 when examining the impacts of exchange rate on China’s trade balance (Yang & Gu, Citation2016), which is a considerable weakness because China strongly employs USD as a vehicle currency in her foreign trade but lightly uses CNY (Dobson & Masson, Citation2009; Ito & Chinn, Citation2014; Lai & Yu, Citation2015; Yang & Gu, Citation2016). Specifically, China’s utilization rate of CNY varied from just around 0% in 2009Q4 to nearly 16% in 2013Q2 (Dobson & Masson, Citation2009; Lai & Yu, Citation2015). Hence, the remaining amount of China’s trade values must be invoiced in other currencies, and it is indubitable that USD has a dominant position among them (Dobson & Masson, Citation2009; Ito & Chinn, Citation2014; Yang & Gu, Citation2016). This is not surprising because the role of USD as the world’s most important vehicle currency has been recognized for many decades (Bank for International Settlements, Citation2016, Citation2019; Boz et al., Citation2020; Krugman, Citation1980; Liu et al., Citation2019), and it continues to stand at the top of the most employed vehicle currencies in the globe during 2013–2019, occurring in roughly 88% of the global transactions; and in contrast, the share of CNY is only around 4% (Bank for International Settlements, Citation2016, Citation2019). Given the vital role of USD as a vehicle currency in China’s international trade, the fact that nearly all studies ignore its importance is a notable research gap leading to the lack of essential findings and useful policy implications. And this gap is even more noticeable in the trade between China and the EU because the EU extensively employs USD in trading with non-EU countries (Eurostat, Citation2021). Nonetheless, no research has covered this issue.
The main objective of this paper is to solve the aforementioned gaps by examining the impacts of the vehicle currency exchange rate, along with the real effective exchange rate, on China’s trade balance with the entire EU.
This study provides notable contributions to the existing literature. First, it is worth researching in the circumstances that the EU is now the largest trading partner of China, but little attention is paid to the China-EU trade while the China-USA trade has received so much spotlight. In addition, no study has examined the exchange rate-trade balance nexus between China and the whole EU. Therefore, this paper is the first to explore this problem. Second, available information indicates that the role of USD as a vehicle currency used by China and the EU is so crucial that it cannot be ignored (Bank for International Settlements, Citation2016, Citation2019; Boz et al., Citation2020; Dobson & Masson, Citation2009; Eurostat, Citation2021; Ito & Chinn, Citation2014; Lai & Yu, Citation2015; Yang & Gu, Citation2016). Nevertheless, it is disregarded in the vast majority of literature on the exchange rate-trade balance relationship, which fails to capture the reality that many countries in the world substantially employ vehicle currencies, mainly USD, in their foreign trade (Bao & Le, Citation2021b; Boz et al., Citation2020; Goldberg & Tille, Citation2008; Ito & Chinn, Citation2014). Moreover, no study has examined the role of USD as a vehicle currency in the trade between China and the EU. Thus, this study is the first to inspect its role in China’s trade with the entire EU. Finally, this paper provides useful information relating to the context that both China and the EU would like to decrease the reliance on USD and further promote the usage of their currencies in global trade. During the de-dollarization process, the trade between China and the EU plays a key role because they are among the top traders in the world and simultaneously employ their currencies alongside the vehicle currency USD. Hence, the comparison of the real effective exchange rate between CNY and all the currencies of the EU with the vehicle currency USD exchange rate in China-EU trade becomes relevant. This paper is also the first to analyze and compare the effects of the two kinds of exchange rates on China’s overall trade balance with the whole EU, which enables more detailed findings and implications for policy-makers.
2. Literature review
2.1. The importance of exchange rate and the J-curve effect
Exchange rate is the relative value of one currency compared with another, and it is the vital price in an economy (Ouyang & Rajan, Citation2013). It is associated with international trade, investment, and economic growth (Hausmann et al., Citation2005). Concerning international trade, exchange rate can influence export and import prices and thus affect the quantity demanded. Hence, the depreciation of the domestic currency is traditionally believed to lower export prices and raise import prices, which in turn improves trade balance by boosting exportation and discouraging importation. Nevertheless, this positive effect only occurs if the Marshall-Lerner condition is satisfied: the sum of absolute elasticities of export and import demand exceeds one (Bahmani et al., Citation2013). In addition, due to the different speeds of adjustments in quantity and price, trade balance needs some time to be eventually facilitated by currency depreciation while it can immediately deteriorate, which is regarded as the J-curve effect (Magee, Citation1973). Since the introduction by Magee (Citation1973), the J-curve effect has become a well-known topic researched by a myriad of papers for diverse countries with various results that can be attributed to the differences in data, methods, and time periods (Bahmani-Oskooee & Hegerty, Citation2010; Phong et al., Citation2018). As China is among the top exporters and importers in the world, her exchange rate-trade balance nexus has been examined by a large number of studies.
2.2. Studies about China assuming the linear relationship between exchange rate and trade balance
The exchange rate-trade balance causality in China’s international trade has long been scrutinized for several decades. Many papers assume the linear linkage between exchange rate and trade balance: a 1% depreciation of domestic currency has the same effect on trade balance as a 1% appreciation. For instance, Brada et al. (Citation1993) inspected the impact of CNY on China’s trade balance from 1980Q1 to 1989Q4 by employing Johansen and Juselius (Citation1990) cointegration technique. They found that CNY devaluation fostered China’s trade balance with the rest of the world in both the short run and long run, thus validating the Marshall-Lerner condition but not the J-curve effect, which goes in line with the results of Zhang (Citation1999) for the period 1986M1–1997M1. Weixian (Citation1999) confirmed the favorable effect of CNY devaluation on China’s overall trade balance during 1986M1–1996M6 as well as the occurrence of J-curve phenomenon. Bahmani-Oskooee and Wang (Citation2006) examined the bilateral trade between China and several major trading partners by using ARDL bound testing and Johansen cointegration approaches on the 1983Q1–2002Q1 data. They reported robust beneficial impacts of bilateral exchange rates on China’s trade balance with respect to Australia, France, and the USA. Meanwhile, for the cases of some European trading partners such as Belgium, Italy, the Netherlands, and the UK, no long-run influence was identified. Narayan (Citation2006) applied ARDL method to study the trade between China and the USA from November 1979 to September 2002 and demonstrated the facilitating role of CNY devaluation against USD on China’s trade balance, which is similar to Baak (Citation2008) as well as Hurley and Papanikolaou (Citation2018). In contrast, Upadhyaya et al. (Citation2020) witnessed no long-run effect of CNY depreciation in China-US trade when utilizing quarterly data between 1999 and 2018.
2.3. Studies about China recognizing the nonlinear relationship between exchange rate and trade balance
All of the above-mentioned articles listed in the sub-sections 2.2 rely on the assumption that the linkage between exchange rate and trade balance is linear. This supposition is proven incorrect by the current literature (e.g., Bahmani-Oskooee & Fariditavana, Citation2015; Bahmani-Oskooee & Nouira, Citation2020; Iyke & Ho, Citation2017, Citation2018). For example, Bahmani-Oskooee and Fariditavana (Citation2015) employed the new NARDL method of Shin et al. (Citation2014) and demonstrated that asymmetric effects were found in all sampled countries. Also, they detected the J-curve effect in China’s trade with the rest of the world in the period 1971Q1–2013Q3, alongside the cases of Canada and the USA. Bahmani-Oskooee et al. (Citation2018) applied both the ARDL and NARDL methods to inspect the trade between China and 21 big trading partners during 2000Q1–2015Q4, which reveals convincing evidence for short-run and long-run asymmetric impacts of exchange rate on the trade balance. Moreover, they documented that both depreciation and appreciation of USD/CNY stimulate China’s trade balance with the USA. Also, both depreciation and appreciation of EUR/CNY fostered China’s trade balance with France and Spain. Besides, the Netherlands and the UK exhibited no influence of exchange rates on China’s trade balance in the long run. Hunter (Citation2019) also utilized both the ARDL and NARDL approaches to assess the bilateral trade of China with Australia, Hong Kong, Japan, and the USA between 1986Q1 and 2014Q4, which authenticated the J-curve effect relating to all selected partners except Australia. Wahab et al. (Citation2020) scrutinized the monthly data from 2011M1 to 2018M8 and found positive impacts of CNY depreciation on China’s trade balance with the USA when using ARDL technique. In addition, asymmetric effects were witnessed in NARDL models.
2.4. Studies about some notable countries trading with China
Besides the papers devoted to China, studies focusing on the trade between some notable countries and China are also noteworthy. For instance, Bahmani-Oskooee and Wang (Citation2008) applied the ARDL model to investigate the trade balance of the USA with China at industry level using annual data between 1978 and 2002. They observed that 34 out of 88 industries in the USA were encouraged by the depreciation of USD against CNY. As they assumed linear relationship between exchange rate and trade balance, it can be inferred that CNY depreciation against USD reduced the trade balance of those 34 industries in the USA. In other words, CNY depreciation can boost China’s commodity trade balance with the USA in 34 industries. Bahmani-Oskooee and Zhang (Citation2013) explored the commodity trade between the UK and China over the period 1978–2010 by employing the ARDL approach. Their findings suggested that the majority of the UK’s 47 industries were positively influenced by the depreciation of GBP against CNY in the short run. Thus, due to the linear assumption of the ARDL model, those UK industries’ trade balance deteriorated under the influence of CNY depreciation. Bahmani-Oskooee et al. (Citation2017) evaluated the bilateral trade between the UK and her 19 partners including China in the period 2000M1–2016M11 by utilizing ARDL and NARDL methods. While they could trace the evidence of short-run and long-run asymmetries related to other partners, the UK-China trade exhibited no long-run impact of exchange rate on the UK’s trade balance. Wang (Citation2020) used the ARDL method to research the trade between the USA and China during 2005Q3–2018Q3 and reported that nominal CNY depreciation against USD promoted China’s exports and discouraged China’s imports, which implied the increase of China’s trade balance.
2.5. Studies covering the role of vehicle currency
The vast majority of existing literature ignores the role of vehicle currency when investigating the exchange rate-trade balance linkage (Bao & Le, Citation2021b; Yang & Gu, Citation2016), which incompletely reflects the global trade where vehicle currencies are frequently employed (Boz et al., Citation2020; Goldberg & Tille, Citation2008; Ito & Chinn, Citation2014). Few papers incorporated the role of vehicle currency in their analyses on exchange rate-trade balance nexus and reported significant results. Šimáková (Citation2013) included the role of EUR as a vehicle currency, alongside the bilateral exchange rates, when inspecting the trade of Hungary with respect to Czechia and Poland during 1997Q1–2012Q2. She could find more evidence of the J-curve effect when covering the role of vehicle currency. Also, she discovered that the effects of currency depreciation on trade balance were subject to the invoicing currencies. Yang and Gu (Citation2016) researched the trade between China and Singapore in the period 1993M1–2013M12 with the incorporation of USD as an important vehicle currency. They discovered that China’s exportation to Singapore was negatively influenced by the depreciation of Singapore dollar (SGD) and CNY against USD. Besides, China’s importation from Singapore was also reduced by the depreciation of SGD and CNY against USD, but to a higher degree, and thus, the trade balance of China was enhanced. To the best knowledge of the authors, Yang and Gu (Citation2016) is the first study to cover the role of the vehicle currency USD in the case of China, which inspires subsequent research on China’s trade with partners different from the USA to encompass its importance. Bao and Le (Citation2021a) explored the inter-regional trade between the whole ASEAN (Association of Southeast Asian Nations) and the entire EU over the period 2000Q1–2018Q1. They also incorporated the role of USD as a vehicle currency, together with the aggregated real effective exchange rate, and found that the depreciation or appreciation of ASEAN’s currencies against USD facilitates ASEAN’s total trade balance with the EU in a J-curve pattern. Thus, their findings affirm the prominence as well as the usefulness of including USD as a vehicle currency in exchange rate-trade balance analysis, especially when scrutinizing the trade between two partners which are not the USA. Recently, Bao and Le (Citation2021b) acknowledged the vital importance of USD as a vehicle currency in the bilateral trade between Vietnam and every trading partner belonging the EU-27 plus the UK. They also used the NARDL method and the data from 2000Q1 to 2018Q1. Besides, they reported that the incorporation of USD as a vehicle currency is very helpful and meaningful in the trade contexts of Vietnam and the EU-27 plus the UK.
3. Methodology
The conventional model of exchange rate-trade balance relationship used by numerous studies such as Bahmani-Oskooee and Wang (Citation2006), Wang et al. (Citation2012), Bahmani-Oskooee and Fariditavana (Citation2015), Bahmani-Oskooee et al. (Citation2018), and Yazgan and Ozturk (Citation2018) indicates that the trade balance between two countries is determined by the real exchange rate and their real incomes. In this paper, the aforementioned model is depicted as:
where is the trade balance of China with respect to the whole EU and defined as the ratio export/import.
denotes the real effective exchange rate between Chinese yuan renminbi (CNY) and the basket of all currencies of the EU; and an increase in
signifies the depreciation of CNY. Hence, if
, CNY depreciation fosters China’s trade balance in the long run, and thus the Marshall-Lerner condition is satisfied. In addition,
indicates the real income of China, and
represents the real income of the entire EU. All variables are in real terms and transformed into indices in which the base quarter 2000Q1 has a value of 100.
To examine the role of USD as a vehicle currency in determining China’s trade balance with the EU, we utilize the following model:
in which stands for USD/CNY real exchange rate index (base quarter 2000Q1 = 100), and an increase of this variable means the depreciation of CNY against USD. Similar to the model described in EquationEquation 1
(1)
(1) , if
is positive, the Marshall-Lerner condition induced by the world’s most popular vehicle currency USD is validated. The other variables in EquationEquation 2
(2)
(2) are the same as EquationEquation 1
(1)
(1) .
EquationEquations 1(1)
(1) and Equation2
(2)
(2) only indicate the long-run relationship of the variables and thus lacks the short-run dynamics. Consequently, to capture the short-run and long-run asymmetric effects of exchange rates on trade balance, they must be turned into error correction forms associated with nonlinear ARDL framework proposed by Shin et al. (Citation2014) based on Pesaran et al. (Citation2001) in EquationEquations 3
(3)
(3) and Equation4
(4)
(4) respectively:
In EquationEquation 3(3)
(3) , the variables
and
are respectively the partial sum of positive and negative changes in the real effective exchange rate between CNY and the basket of EU’s currencies, which are calculated by the formulas given in EquationEquations 5
(5)
(5) and Equation6
(6)
(6) . Also,
denotes CNY depreciation, and
signifies CNY appreciation, and they are allowed to be different in both the short run and long run. Hence, this is a superiority of NARDL method compared with the conventional linear ARDL approach in terms of separating the effects of currency depreciation and appreciation.
In EquationEquation 4(4)
(4) ,
indicates the depreciation of CNY against USD, and
reflects the appreciation of CNY against USD. They are also computed by the method of Shin et al. (Citation2014):
Shin et al. (Citation2014) proved that the estimation of EquationEquations 3(3)
(3) and Equation4
(4)
(4) can follow the standard ARDL procedure developed by Pesaran et al. (Citation2001). Thus, the unit root test is not necessary as the approach of Pesaran et al. (Citation2001) permits the presence of both I(0) and I(1) variables (Bahmani-Oskooee & Baek, Citation2018; Bahmani-Oskooee & Nasir, Citation2019). Next, the long-run relationship among the variables can be verified by the bound test: if the F statistic is higher than the critical value of I(1) variable provided by Pesaran et al. (Citation2001), the presence of cointegration is validated. The null hypothesis of the bound test, considering the case of EquationEquation 3
(3)
(3) for example, is no cointegration: H0:
, and the alternative hypothesis is H1:
. After the cointegration among the variables is confirmed, short-run and long-run coefficients can be estimated. Then, several tests including Breusch-Godfrey, Breusch–Pagan, and Ramsey RESET are conducted to ensure that the models are free from autocorrelation, heteroskedasticity, and misspecification. Finally, Cumulative Sum of Recursive Residuals (CUSUM) and Cumulative Sum of Square of Recursive Residuals (CUSUMSQ) tests help reveal the stability of the estimated coefficients.
The data employed in this paper range from 2000Q1 to 2018Q1, which is derived from several sources. First, the dataset Direction of Trade Statistics (DOTS) provided by IMF is used for calculating the trade balance between China and the whole EU-27 plus the UK. Second, nominal exchange rates and consumer price indices are retrieved from the dataset International Financial Statistics (IFS) provided by IMF in order to compute real effective exchange rate between CNY and the currencies of the EU-27 plus the UK as well as the vehicle currency exchange rate USD/CNY. Third, the real incomes of China, EU-27 countries, and the UK are collected from the Federal Reserve Economic Data (https://fred.stlouisfed.org).
4. Empirical results
We first represent the NARDL estimation results for the REER model in . As the bound test has a very high F statistic (i.e., 7.24) that is significant at 1% level, the null hypothesis of non-cointegration is rejected, and thus the occurrence of cointegration among the variables is supported (Bahmani-Oskooee & Nasir, Citation2019; Pesaran et al., Citation2001). An alternative method to validate the presence of cointegration is using the error correction term (ECT): when the coefficient of ECT is negative and significant, the cointegration exists (Bahmani-Oskooee & Fariditavana, Citation2015). Moreover, the ECT also indicates the speed of adjustment towards long-run equilibrium (Phong et al., Citation2018). Namely, demonstrates that the ECT’s coefficient is −0.21, so roughly 21% of the short-run shocks will return to the long-run equilibrium. Besides, no problem relating to serial correlation, heteroskedasticity, misspecification, and unstable coefficients is found, as evidenced by the small F statistics in Breusch-Godfrey, Breusch-Pagan, and Ramsey RESET tests. In addition, presents that the CUSUM and CUSUMSQ graphs lie between the boundaries, thus the estimated coefficients are stable. Consequently, the estimation outcomes are trustworthy.
Figure 1. The CUSUM and CUSUMSQ tests of the REER model.Notes. The CUSUM and CUSUMSQ graphs are respectively indicated in blue and red.
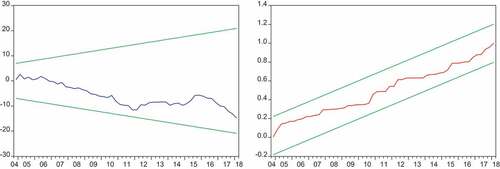
Table 1. The impacts of real effective exchange rate on China’s trade balance with EU-28
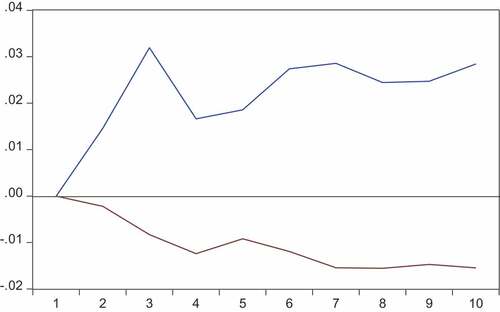
In , the asymmetrical impacts of real effective exchange rate on China’s trade balance with respect to the EU-28 are identified. Namely, in the long run, while CNY depreciation against EU-28ʹs currencies (i.e., REER+t) boosts China’s trade balance, the appreciation counterpart has no effect. Also, in the short run, CNY depreciation and appreciation exhibit opposite impacts. Thus, both short-run and long-run asymmetries are detected. Besides, the Marshall-Lerner condition is supported because when CNY depreciates, it enhances China’s trade balance. Particularly, a 1% depreciation of CNY against EU-28ʹs currencies improves China’s trade balance by nearly 1.58%. Therefore, the depreciation of CNY against the currencies of the EU-28 can be an effective tool for China to promote trade balance with the EU-28. In addition, the income of the EU-28 also stimulates the trade balance of China. Specifically, a 1% increase in their income stimulates China’s trade balance by around 2.86%. Besides, no J-curve effect is found according to the definition of Rose and Yellen (Citation1989) because CNY depreciation in both the short run and long run have positive coefficients. This can be observed by the impulse response graph displayed in where there is no J-curve pattern. Also, the results shown in are very similar to those in when REER+ encourages China’s trade balance, and REER—exhibits negative effect in the short run.
Figure 2. The responses of trade balance to REER+ and REER.Notes. The blue and brown colors respectively denote the responses of trade balance to REER+ and REER–.
From the aforesaid results, it seems that China can benefit from the positive impact of CNY depreciation against EU-28ʹs currencies on her trade balance. Nevertheless, this is not the whole story, and there is another one because a substantial amount of trade value between China and the EU-28 is invoiced by the vehicle currency USD, which could affect China’s trade balance differently. By looking at the vehicle currency model in , it can be observed that the depreciation of CNY against USD (i.e., USD+t) does not change China’s trade balance with the EU-28. However, when CNY appreciates against USD by 1%, China’s trade balance is fostered by roughly 2.49%. Thus, the USD/CNY exchange rate not only impacts China’s trade balance with the USA (Bahmani-Oskooee et al., Citation2018; Bahmani-Oskooee & Wang, Citation2006; Hurley & Papanikolaou, Citation2018; Narayan, Citation2006; Wang et al., Citation2012) but also impacts China’s trade balance with the EU-28. Thus, when USD is still substantially utilized as a vehicle currency, the fluctuation of USD/CNY should be paid great attention by Chinese policy-makers as it could also affect China’s trade balance with partners other than the USA.
Table 2. The impacts of vehicle currency exchange rate on China’s trade balance with EU-28
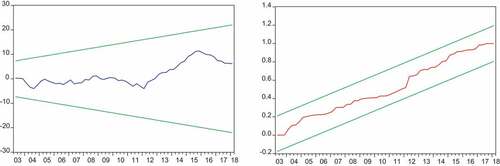
The estimation results of the vehicle currency model are demonstrated in . It can be witnessed that the diagnostic tests report no issue. Further, the presence of cointegration is supported by both the bound test and error correction term (ECT). Additionally, based on the CUSUM and CUSUMSQ tests in , the stability of coefficients is confirmed. Thus, the estimation outcomes are trustworthy. Also, indicates the presence of both long-run and short-run asymmetric impacts of USD/CNY on China’s trade balance. Moreover, the Marshall-Lerner condition in the vehicle currency model is not satisfied because the depreciation of CNY against USD cannot boost the trade balance. Besides, the income of the EU-28 still encourages China’s trade balance, which implies that the EU-28 will buy more Chinese products when their income increases.
Figure 3. The CUSUM and CUSUMSQ tests of the vehicle currency model.Note. The CUSUM and CUSUMSQ graphs are respectively indicated in blue and red.
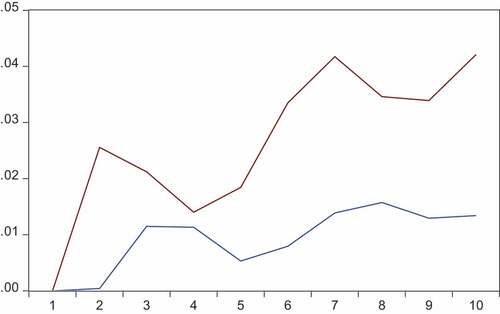
Similar to the REER model, no J-curve effect is identified in the vehicle currency model. Nevertheless, the appreciation of CNY against the vehicle currency USD (i.e., USD–) fosters China’s trade balance in both the short run and the long run, which is very consistent with the impulse response graph exhibited in .
Figure 4. The responses of trade balance to USD+ and USD.Notes. The blue and brown colors respectively denote the responses of trade balance to USD+ and USD–.
In 2020, the UK officially left the EU, and now the EU has 27 members. To check for the robustness of the empirical results as well as provide more useful information for policy-makers, the authors re-estimate the REER and vehicle currency models (specified in EquationEquations 3(3)
(3) and Equation4
(4)
(4) ) using the EU-27 sample instead of the EU-28 one. Specifically, when the UK is excluded from the 2000Q1–2018Q1 data, the variables relating to China’s trade balance with the whole EU, real effective exchange rate, and the EU’s income will change accordingly. The estimation outcomes are presented in . It can be observed that the results in are very similar to those in , which indicates the robustness of the findings. Particularly, in the REER model, CNY depreciation against the basket of EU-28ʹs and EU-27ʹs currencies encourages China’s trade balance with the EU-28 and EU-27 respectively, but the appreciation analogue has no impact. Again, in the vehicle currency model, while China’s trade balance with the EU-28 or EU-27 is unresponsive to the depreciation of CNY against USD, it rises when CNY appreciates against USD. Also, the long-run and short-run asymmetries are spotted in both the cases of EU-28 and EU-27, which demonstrates the suitability of the NARDL method for the data. Besides, no J-curve effect is found. The EU-27ʹs income still boosts China’s trade balance in both REER and vehicle currency models while the income of China has significant effect in the latter model only. Moreover, the exclusion of the UK does not affect the exchange rate-trade balance linkage as well as the role of USD as a vehicle currency in China-EU trade. In other words, USD is a vital vehicle currency in the trade between China and the EU, regardless of the presence of the UK.
Table 3. The impacts of real effective exchange rate on China’s trade balance with EU-27
Table 4. The impacts of vehicle currency exchange rate on China’s trade balance with EU-27
5. Conclusion
Although the trade between China and the USA has gained much attention, the trade between China and the EU is not adequately focused, although the EU is China’s largest trading partner (European Commission, Citation2021). In addition, no study has scrutinized the exchange rate-trade balance linkage in the context of China’s trade with the whole EU employing a real effective exchange rate between CNY and the basket of all EU’s currencies as the proxy. Moreover, the vast majority of research neglects the role of vehicle currency, and thus no paper has examined the role of vehicle currency, especially USD, in the trade between China and the entire EU, albeit it is heavily employed by China and the EU. The main objective of this paper is to fill the aforementioned gaps by investigating the impacts of both real effective exchange rate and vehicle currency exchange rate on China’s trade balance with the entire EU in the period 2000Q1–2018Q1. The empirical results indicate that the depreciation of CNY against the EU’s currencies encourages China’s overall trade balance with the whole EU. However, in the vehicle currency model, China’s trade balance is fostered by the appreciation of CNY against USD. In addition, long-run and short-run asymmetries are detected in both models. The findings are robust in the EU-28 and EU-27 cases and confirm the vital role of USD as a vehicle currency.
From the outcomes of this paper, several useful policy implications can be provided. China’s total trade balance with the EU reacts distinguishably to the different currencies used in China-EU trade. The REER model indicates that when the currencies of the EU are used, the depreciation of CNY against them facilitates China’s trade balance. But, when USD is heavily used as a vehicle currency, CNY depreciation against USD does not impact China’s trade balance. Thus, the effectiveness of the devaluation policy is not independent of the currency choice, which is analogous to the results of Šimáková (Citation2013) as well as Bao and Le (Citation2021a, Citation2021b). Due to the global dominance of USD as a vehicle currency, higher pass-through and higher sensitivity of trade balance to USD exchange rate are experienced by the countries which substantially employ USD (Boz et al., Citation2020). And available statistics show that both China and the EU extensively apply USD as a vehicle currency (Bank for International Settlements, Citation2016, Citation2019; Boz et al., Citation2020; Dobson & Masson, Citation2009; Eurostat, Citation2021; Ito & Chinn, Citation2014; Lai & Yu, Citation2015; Yang & Gu, Citation2016). Thus, China’s and the EU’s policy makers should not ignore the role of USD, even in the trade with partners different from the USA, in designing effective exchange rate and trade policies. Moreover, increasing the usage of EUR or CNY in their trade with each other is perhaps worth considering for both China and the EU if they would like to decrease the reliance on USD. And this is particularly important when the EU is now the largest trading partner of China, and China is their second largest one (European Commission, Citation2021). The limitation of this paper is that it only examines the China-EU trade at aggregate level, and thus the bilateral and commodity levels have not been discovered. Hence, future studies can extend this paper by implementing bilateral and commodity analyses on the trade between China and the EU. For example, the vital role of USD as a vehicle currency in China’s trade in oil-related products is undeniable when the refinery/petroleum industry has been predominantly settled by USD (Sven et al., Citation2016), and China is the world’s largest oil importer (U.S. Energy Information Administration, Citation2018). Further, because Russia is among the top countries exporting oil products to China and the EU (Eurostat, Citation2020; U.S. Energy Information Administration, Citation2018), examining the role of USD as a vehicle currency, alongside the bilateral exchange rates, in China-Russia and EU-Russia trade in refinery/petroleum industry is a prominent topic. Therefore, this line of study can further provide valuable information for the de-dollarization efforts of both China and the EU, which contributes to the promotion of CNY and EUR in global trade.
Acknowledgements
This work was supported by the European Union’s Horizon 2020 research and innovation program under Marie Skłodowska-Curie grant agreement No. 734712; University of Economics Ho Chi Minh City; and Ho Chi Minh City University of Law. The authors owe extensive gratitude to the Senior Editor, Professor David McMillan, and the anonymous reviewers for their constructive comments. The authors would like to thank Professor Aaro Hazak, Department of Economics and Finance, Tallinn University of Technology, Estonia for his helpful support. The authors are solely responsible for any errors.
Data availability statement
Data is available in public repository. The authors confirm that all data underlying the findings are fully available without restriction.
Disclosure statement
The authors declare that they have no known competing financial interests or personal relationships that could have appeared to influence the work reported in this paper.
Additional information
Funding
Notes on contributors
Hoang Phong Le
Ho Hoang Gia Bao and Hoang Phong Le are lecturers at the Department of Finance and Accounting Management, Ho Chi Minh City University of Law, and researchers at University of Economics Ho Chi Minh City (Vietnam). Their research interests are international finance, public finance, financial economics, energy and environmental economics, and sustainable development. They have published and reviewed numerous articles in WoS and Scopus indexed journals. This study stems from their works as visiting researchers at the Department of Economics and Finance, Tallinn University of Technology (Estonia), which is funded by the European Union’s Horizon 2020 research and innovation program (Marie Skłodowska-Curie grant agreement No 734712).
Ly T.T.H. is an associate professor in Finance at School of Finance, University of Economics Ho Chi Minh City, Vietnam. She teaches corporate finance, investment, and behavioral finance. Her research interests are corporate financial events and market response, stock liquidity, and corporate financial decisions.
Notes
1. Authors’ calculation from the World Development Indicators database of World Bank.
2. Authors’ calculation from the Direction of Trade Statistics database of IMF.
3. Vehicle currency can be understood as the currency used in the trade between two countries but not belonging to them (Magee & Rao, Citation1980).
References
- Baak, S. (2008). The bilateral real exchange rates and trade between China and the U.S. China Economic Review, 19(2), 117–16. https://doi.org/10.1016/j.chieco.2008.02.003
- Bahmani-Oskooee, M., & Baek, J. (2018). Asymmetry cointegration and the J-curve: New evidence from Korean bilateral trade balance models with her 14 partners. Journal of the Asia Pacific Economy, 24(1), 66–81. https://doi.org/10.1080/13547860.2018.1469589
- Bahmani-Oskooee, M., Bose, N., & Zhang, Y. (2018). Asymmetric cointegration, nonlinear ARDL, and the J-Curve: A bilateral analysis of China and its 21 trading partners. Emerging Markets Finance and Trade, 54(13), 3131–3151. https://doi.org/10.1080/1540496X.2017.1373337
- Bahmani-Oskooee, M., & Fariditavana, H. (2015). Nonlinear ARDL approach, asymmetric effects and the J-curve. Journal of Economic Studies, 42(3), 519–530. https://doi.org/10.1108/JES-03-2015-0042
- Bahmani-Oskooee, M., Ghodsi, S. H., & Halicioglu, F. (2017). UK trade balance with its trading partners: An asymmetry analysis. Economic Analysis and Policy, 56 (December 2017) , 188–199. https://doi.org/10.1016/j.eap.2017.09.005
- Bahmani-Oskooee, M., & Hegerty, S. W. (2010). The J- and S-Curves: A survey of the recent literature. Journal of Economic Studies, 37(6), 580–596. https://doi.org/10.1108/01443581011086639
- Bahmani-Oskooee, M., & Nasir, M. A. (2019). Asymmetric J-curve: Evidence from industry trade between U.S. and U.K. Applied Economics, 52(25), 2679–2693. https://doi.org/10.1080/00036846.2019.1693700
- Bahmani-Oskooee, M., & Nouira, R. (2020). U.S. – Italy commodity trade and the J-curve: New evidence from asymmetry analysis. International Economics and Economic Policy, 17(2), 427–482. https://doi.org/10.1007/s10368-020-00472-4
- Bahmani-Oskooee, M., & Wang, Y. (2006). The J-curve: China versus her trading partners. Bulletin of Economic Research, 58(4), 323–343. https://doi.org/10.1111/j.0307-3378.2006.00247.x
- Bahmani-Oskooee, M., & Wang, Y. (2008). The J-curve: Evidence from commodity trade between US and China. Applied Economics, 40(21), 2735–2747. https://doi.org/10.1080/00036840600970328
- Bahmani-Oskooee, M., & Zhang, R. (2013). The J-curve: Evidence from commodity trade between UK and China. Applied Economics, 45(31), 4369–4378. https://doi.org/10.1080/00036846.2013.783680
- Bahmani, M., Harvey, H., & Hegerty, S. W. (2013). Empirical tests of the Marshall‐Lerner condition: A literature review. Journal of Economic Studies, 40(3), 411–443. https://doi.org/10.1108/01443581311283989
- Bank for International Settlements. (2016). Triennial Central Bank Survey of foreign exchange and OTC derivatives markets in 2016. https://www.bis.org/publ/rpfx16.htm
- Bank for International Settlements. (2019). Triennial Central Bank Survey of Foreign Exchange and Over-the-counter (OTC) Derivatives Markets in 2019. https://www.bis.org/statistics/rpfx19.htm
- Bao, H. H. G., & Le, H. P. (2021a). The role of vehicle currency in ASEAN-EU trade: A double-aggregation method. Journal of Asian Finance, Economics and Business, 8(5), 43–52. https://doi.org/10.13106/jafeb.2021.vol8.no5.0043
- Bao, H. H. G., & Le, H. P. (2021b). Asymmetric impact of exchange rate on trade between Vietnam and each of EU-27 countries and the UK: Evidence from nonlinear ARDL and the role of vehicle currency. Heliyon, 7(6), e07344. https://doi.org/10.1016/j.heliyon.2021.e07344
- Boz, E., Casas, C., Georgiadis, G., Gopinath, G., Mezo, H. L., Mehl, A., & Nguyen, T. (2020). Patterns in invoicing currency in global trade (Working Paper No. 20/126). International Monetary Fund. https://www.imf.org/en/Publications/WP/Issues/2020/07/17/Patterns-in-Invoicing-Currency-in-Global-Trade-49574
- Brada, J. C., Kutan, A. M., & Zhou, S. (1993). China’s exchange rate and the balance of trade. Economics of Planning, 26(3), 229–242. https://doi.org/10.1007/bf01265668
- Devadoss, S., Hilland, A., Mittelhammer, R., & Foltz, J. (2014). The effects of the Yuan-dollar exchange rate on agricultural commodity trade between the United States, China, and their competitors. Agricultural Economics, 45(1), 23–37. https://doi.org/10.1111/agec.12127
- Dobson, W., & Masson, P. R. (2009). Will the renminbi become a world currency? China Economic Review, 20(1), 124–135. https://doi.org/10.1016/j.chieco.2008.05.005
- European Commission. (2021). Countries and regions – China. https://ec.europa.eu/trade/policy/countries-and-regions/countries/china
- Eurostat. (2020). EU imports of energy products - recent developments. https://ec.europa.eu/eurostat/statistics-explained/index.php?title=EU_imports_of_energy_products_-_recent_developments
- Eurostat. (2021). Extra-EU trade by invoicing currency. https://ec.europa.eu/eurostat/statistics-explained/index.php/Extra-EU_trade_by_invoicing_currency
- Goldberg, L. S., & Tille, C. (2008). Vehicle currency use in international trade. Journal of International Economics, 76(2), 177–192. https://doi.org/10.1016/j.jinteco.2008.07.001
- Groenewold, N., & He, L. (2007). The US–China trade imbalance: Will revaluing the RMB help (much)? Economics Letters, 96(1), 127–132. https://doi.org/10.1016/j.econlet.2006.12.021
- Hausmann, R., Pritchett, L., & Rodrik, D. (2005). Growth Accelerations. Journal of Economic Growth, 10(4), 303–329. https://doi.org/10.1007/s10887-005-4712-0
- Hunter, A. (2019). Non-linear autoregressive distributed lag model approach and the J-Curve phenomenon: China and her major trading partners. Major Themes in Economics, 21 (2019) , 1–13. https://scholarworks.uni.edu/mtie/vol21/iss1/3
- Hurley, D. T., & Papanikolaou, N. (2018). An investigation of China-U.S. bilateral trade and exchange rate changes using the autoregressive distributed lag model. Economic Papers: A Journal of Applied Economics and Policy, 37(2), 162–179. https://doi.org/10.1111/1759-3441.12206
- Ito, H., & Chinn, M. (2014). The rise of the “Redback” and the People’s Republic of China’s Capital Account Liberalization: An empirical analysis of the determinants of invoicing currencies (Working Paper No. 473). Asian Development Bank Institute. https://www.adb.org/publications/rise-redback-and-peoples-republic-chinas-capital-account-liberalization-empirical
- Iyke, B. N., & Ho, S. H. (2017). The Real Exchange Rate, the Ghanaian Trade Balance, and the J-curve. Journal of African Business, 18(3), 380–392. https://doi.org/10.1080/15228916.2017.1315706
- Iyke, B. N., & Ho, S. H. (2018). Nonlinear effects of exchange rate changes on the South African bilateral trade balance. The Journal of International Trade & Economic Development, 27(3), 350–363. https://doi.org/10.1080/09638199.2017.1378916
- Johansen, S., & Juselius, K. (1990). Maximum likelihood estimation and inference on cointegration-with applications to the demand for money. Oxford Bulletin of Economics and Statistics, 52(2), 169–210. https://doi.org/10.1111/j.1468-0084.1990.mp52002003.x
- Krugman, P. (1980). Vehicle currencies and the structure of international exchange. Journal of Money, Credit and Banking, 12(3), 513–526. https://doi.org/10.2307/1991725
- Lai, E. L. ‐. C., & Yu, X. (2015). Invoicing currency in international trade: An empirical investigation and some implications for the Renminbi. World Economy, 38(1), 193–229. https://doi.org/10.1111/twec.12211
- Li, C., He, C., & Lin, C. (2018). Economic impacts of the possible China–US trade war. Emerging Markets Finance and Trade, 54(7), 1557–1577. https://doi.org/10.1080/1540496X.2018.1446131
- Liu, T., Wangcor, X., & Woo, W. T. (2019). The road to currency internationalization: Global perspectives and Chinese experience. Emerging Markets Review, 38 (March 2019) , 703–101. https://doi.org/10.1016/j.ememar.2018.11.003
- Liu, T., & Woo, W. T. (2018). Understanding the U.S.-China trade war. China Economic Journal, 11(3), 319–340. https://doi.org/10.1080/17538963.2018.1516256
- Magee, S. P., & Rao, R. K. S. (1980). Vehicle and nonvehicle currencies in international trade. The American Economic Review, 70(2), 368–373. https://www.jstor.org/stable/1815500
- Magee, S. P. (1973). Currency contracts, pass through and devaluation. Brookings Papers on Economic Activity, 1973(1), 303–325. https://doi.org/10.2307/2534091
- Narayan, P. K. (2006). Examining the relationship between trade balance and exchange rate: The case of China’s trade with the USA. Applied Economics Letters, 13(8), 507–510. https://doi.org/10.1080/13504850500400488
- Ouyang, A. Y., & Rajan, R. S. (2013). Real exchange rate fluctuations and the relative importance of nontradables. Journal of International Money and Finance, 32 (February 2013) , 844–855. https://doi.org/10.1016/j.jimonfin.2012.07.006
- Pesaran, M., Shin, Y., & Smith, R. (2001). Bounds testing approaches to the analysis of level relationships. Journal of Applied Econometrics, 16(3), 289–326. https://doi.org/10.1002/jae.616
- Phong, L. H., Bao, H. H. G., & Van, D. T. B. (2018). Testing J-Curve phenomenon in Vietnam: An autoregressive distributed lag (ARDL) approach. In L. Anh, L. Dong, V. Kreinovich, & N. Thach (Eds.), Econometrics for financial applications. Studies in computational intelligence (Vol. 760, pp. 491‒503). Springer International Publishing. https://doi.org/10.1007/978-3-319-73150-6_39
- Rose, A. K., & Yellen, J. L. (1989). Is there a J-curve? Journal of Monetary Economics, 24(1), 53–68. https://doi.org/10.1016/0304-3932(89)90016-0
- Shin, Y., Yu, B., & Greenwood-Nimmo, M. (2014). Modelling asymmetric cointegration and dynamic multipliers in a nonlinear ARDL framework. In R. Sickels & W. Horrace (Eds.), Festschrift in honor of Peter Schmidt: Econometric methods and applications (pp. 281–314). Springer. https://doi.org/10.1007/978-1-4899-8008-3_9
- Šimáková, J. (2013). Estimation of the J-curve effect in the bilateral trade of Hungary. Ekonomická Revue, 16(3), 183–191. https://doi.org/10.7327/cerei.2013.09.07
- Sven, L., Stylianos, K., & Evangelia, P. (2016). Invoicing currencies in international trade - Drivers and obstacles to the use of the Euro (JRC Publications Repository EUR 27754 EN). European Commission. https://doi.org/10.2788/118704
- U.S. Energy Information Administration. (2018). China surpassed the United States as the world’s largest crude oil importer in 2017. https://www.eia.gov/todayinenergy/detail.php?id=37821
- Upadhyaya, K. P., Mixon, F. G., Jr, & Bhandari, R. (2020). Is there a J‐curve in China‐U.S. trade? International Journal of Finance & Economics. https://doi.org/10.1002/ijfe.2137
- Wahab, S., Safi, A., Wahab, Z., Amin, M., & Zhang, X. (2020). China–United States trade war: Does devaluation favors China? An application NARDL. Journal of Public Affairs 21(3), e2234. https://doi.org/10.1002/pa.2234
- Wang, C.-H., Lin, C.-H. A., & Yang, C.-H. (2012). Short-run and long-run effects of exchange rate change on trade balance: Evidence from China and its trading partners. Japan and the World Economy, 24(4), 266–273. https://doi.org/10.1016/j.japwor.2012.07.001
- Wang, Y. (2020). Causes of U.S.-China trade imbalances: A review. Journal of Chinese Economic and Foreign Trade Studies, 13(1), 37–44. https://doi.org/10.1108/JCEFTS-01-2020-0003
- Weber, I., & Shaikh, A. (2021). The U.S.–China trade imbalance and the theory of free trade: Debunking the currency manipulation argument. International Review of Applied Economics, 35(3–4), 432–455. https://doi.org/10.1080/02692171.2020.1814221
- Weixian, W. (1999). An empirical study of the foreign trade balance in China. Applied Economics Letters, 6(8), 485–490. https://doi.org/10.1080/135048599352781
- Yang, G., & Gu, Q. (2016). Effects of exchange rate variations on bilateral trade with a vehicle currency: Evidence from China and Singapore. Journal of International Money and Finance, 68 (November 2016) , 50–73. https://doi.org/10.1016/j.jimonfin.2016.06.010
- Yazgan, M., & Ozturk, S. (2018). Real exchange rates and the balance of trade: Does the J-curve effect really hold? Open Economies Review, 30(2), 343–373. https://doi.org/10.1007/s11079-018-9510-3
- Zhang, Z. (1999). Foreign exchange rate reform, the balance of trade and economic growth: An empirical analysis for China. Journal of Economic Development, 24(2), 143–162. http://www.jed.or.kr/full-text/24-2/zhang.PDF