
 ?Mathematical formulae have been encoded as MathML and are displayed in this HTML version using MathJax in order to improve their display. Uncheck the box to turn MathJax off. This feature requires Javascript. Click on a formula to zoom.
Abstract
This paper empirically investigates the causal relationship between energy prices and economic performance in South Africa by employing the auto-regressive distributed lag (ARDL) bounds test technique for the period 1994 to 2019. The empirical evidence that was reviewed used a different methodology and covered different periods, particularly in the South African context. While previous studies investigated energy prices by examining oil or electricity prices separately, this study combined these prices in the regression model. The ARDL model is capable of detecting hidden cointegration relationships and works even in series that are integrated of different orders. The study established a long-run relationship between the variables. The findings revealed that electricity prices have a significant negative impact on economic growth in the long and short run, while crude oil prices show a significant positive linkage with economic growth in the long and short run. The Granger causality analysis did not establish a causal relationship between energy prices and economic growth in South Africa. However, it pointed to unidirectional causality from both labour productivity and gross fixed capital formation to economic growth. It is thus recommended that the government should take steps to mitigate the effects of high electricity prices on economic growth in South Africa.
PUBLIC INTEREST STATEMENT
Energy prices play a critical role in determining the economy of a country. The study attempted to examine the causal effect of energy prices on economic growth of South Africa. This study revealed that in the short-run and long-run, electricity prices have a negative effect on economic growth, while crude oil prices have a positive effect on growth of South Africa in the short-run and long-run. This study argues that the positive effect of crude oil prices on economic growth could be caused by the strong monetary policy of South Africa. These results could be used by other economies in Africa to establish a sustainable system of neutralising the effect of high energy prices on economic growth.
1. Introduction
Energy prices are regarded as a crucial factor in facilitating economic growth. Legoete (Citation2005) notes that several factors affect energy prices, including the cost of energy production, taxation or subsidies, weather conditions, distribution and transmission infrastructure, and multi-tiered market control.
The average price of electricity is the amount paid by the consumer (Vermeulen, Citation2017). National average costs are used to maintain a clear and consistent approach to fees and to ensure that consumers are paying equal, reasonable, and average associated costs. In South Africa, energy prices differ among commercial, manufacturing, and residential consumers (Oruoch, Citation2015). Electricity distribution is controlled by Eskom, municipalities, and other licensed suppliers, with 180 municipalities currently responsible for 40% of electricity sales to 60% of customers. Households consume 17.2% of electricity in South Africa, with 2.6% consumed by agriculture, 15% by mines, and 37.7% by industry. The commercial sector consumes 12.6%, transportation 2.6% and the public sector 12.3% (Letschert et al., Citation2013).
In general, the price of crude oil is set per barrel, with price variations depending on its quality, measured by factors such as its specific use, sulphur level and the distance it has to be transported. Nkomo (Citation2006) notes that South Africa is totally dependent on imported crude oil. In 2018, it constituted 11.3% of the country’s total imports, with Saudi Arabia contributing 42.29%, Nigeria 33.81%, Angola 13.02%, United Arab Emirates 5.59%, Ghana 3.05%, Togo 1.71%, and Norway 0.53% (South African Market Insights (SAMI), Citation2018).
In this paper, economic growth, defined by gross domestic product (GDP), is used to assess economic performance in South Africa. GDP is one of the most common indicators used to monitor the growth of a country’s economy. It is a significant economic measure for economists and investors since it represents the aggregate value of all products and services produced by an economy over a particular period (Mohr, Citation2015). Economic growth might improve if energy prices are fairly stable; however, if they are unstable, prices could increase, negatively impacting economic growth (Frimpong et al., Citation2018).
Inglesi-Lotz and Pouris (Citation2016) note that there is a lack of consensus in the energy economics literature on the link between energy prices and economic growth, with studies (Balcilar et al., Citation2017; Khobai et al., Citation2017; Kumar et al., Citation2015; Sodeyfi & Katircioglu, Citation2016) having produced mixed results. This paper combines electricity prices and crude oil prices in a regression model to examine their impact on economic growth in South Africa. The country produces 70% of its electricity from its primary source of energy, coal (Statistics South Africa (StatsSA), Citation2020), while crude oil is its primary imported source of energy (SAMI, Citation2018).
Electricity is a major production input in South Africa, particularly among companies that mine gold and nonferrous metal, and the soap and pharmaceutical industry (Mazambani, Citation2015). Gonese et al. (Citation2019) established a negative relationship between electricity prices and economic growth in South Africa. Oil is also a necessary input for many petroleum products used in industrial production, transportation and power production. The price of crude oil has risen significantly (Dikkaya & Doyar, Citation2017), with negative effects on economic growth in South Africa (Balcilar et al., Citation2014). This paper will thus provide information to assist the South African government to identify strategies to mitigate the effect of high energy prices.
The paper also contributes to the empirical literature on the energy price-growth link by extending empirical work to the current period. Other studies, such as those by Frimpong et al. (Citation2018) and Antwi (Citation2017), applied panel data analysis to examine the variables under review. Sasana and Ghozali (Citation2017) and Bah and Azam (Citation2017) investigated the effect of energy use on growth in South Africa, while other studies focused on the link between energy consumption and growth (Lin & Wesseh, Citation2014; Usman et al., Citation2020; Ye et al., Citation2018). A further body of work (Li et al., Citation2021; Wang, Guo et al., Citation2022; Wang, Wang, et al., Citation2022a) investigated carbon emissions from energy-related factors. Wang, Wang, al. (Citation2022b) examined renewable energy and economic growth. None of these studies focussed on the energy price-growth link, particularly in the South African context. Furthermore, they used different country case studies, diverse methodologies, and different data sets and study periods.
Dagoumas et al. (Citation2020) and He et al. (Citation2015) investigated the electricity price’s effect on growth, while Chisadza et al. (Citation2016) and Ogboru et al. (Citation2017) explored the impact of the oil price on growth, with both studies pointing to the former positively influencing the latter. However, Difeto et al. (Citation2018) and Adeniran and Igbatayo (Citation2016) concluded that the oil price harms growth. In order to bridge the gap, this study combined oil prices and electricity prices in a regression model to determine their mutual impact on the South African economy.
The majority of previous studies such as Gonese et al. (Citation2019) and Sibanda et al. (Citation2018) on the variables under review analysed panel data while this study used time-series data. It aimed to empirically and theoretically investigate the causal connection between energy prices and growth using the autoregressive distributed lag ARDL model for the period 1994 to 2019. The ARDL model is a more appropriate econometric tool as it can detect hidden cointegration relationships, especially in small samples.
The paper is structured as follows: Section 2 presents a literature review, section 3 the methodology employed and section 4 the data analysis and interpretation. The last section offers policy recommendations and summarises the study.
2. Literature review
2.1. Theoretical literature
This section focuses on theoretical views on the causal link between energy prices and growth. The main theories that were identified in the theoretical literature were the neo-classical growth theory, the Kümmel capital-labour-energy and creative model, the endogenous growth model and the transmission mechanism.
2.1.1. The neo-classical growth theory
Solow’s (Citation1956) neo-classical theory posits that sustained economic growth is determined by external factors such as technological progress as the main factor of production. In this theory, technological progress refers to qualitative changes in production factors such as improved knowledge among employees, growth in the scale of production and improved production inputs (Solow, Citation1999). The model assumes that a single industry manufactures a specific product which can either be used as a consumption commodity or investment (Hahn, Citation2010). A rise in investment causes an increase in aggregate demand indicated by an upsurge in consumer spending, followed by an increase in capital investment by companies to improve the aggregate supply of these measures to promote economic growth (Meyer & Sanusi, Citation2019).
Moreover, given the assumption of a closed economy, planned private saving (S) is proportional to income (Y); thus, S = sY and equals planned investment (I). Klump et al. (Citation2007) argued that the Solow growth model allows for labour force growth (n) and for capital stock to depreciate. Population growth, technological improvement and depreciation rate are all determined exogenously. Thus, the Cobb-Douglass production function in equation (i) represents this theory.
According to Solow (Citation1956), in the long run, the economy will slowly reach a level where the capital-output ratio (K/L) no longer changes. The greater the saving rate/investment and the lower the population and depreciation rate, the faster an economy will grow. In other words, when there is an increase in infrastructure investment such as energy, electricity and downstream oil, economic growth will rise. In addition, improved energy facilities and low energy prices lead to low input costs for all goods and services, which could render industrial sectors more efficient and increase productivity. Solow (Citation1956) thus posited that growth can be achieved by increasing private savings (S).
2.1.2. The Kümmel capital-labour-energy and creativity model
This model that was developed by Kümmel in 1980 rejects the neo-classical equilibrium assumption of fair output elasticity and cost-sharing. Kümmel et al. (Citation2010) assert that materials are passive participants in the manufacturing process, and do not lead directly to value-added generation. However, if resources are scarce even after their recycling, economic performance and growth will be restricted. Kümmel and Lindenberger (Citation2014) argue that the Kümmel capital-labour-energy and creativity hypothesis implies a growth function Y (K, L, E; t) that represents value added Y of products and produces services in the economic system as a function of production factors and time.
Lindenberger and Kümmel (Citation2002) state that output Y is the growth of the national economy or part of the output of the commercial sub-sector. Y is the state function of inputs K which signifies capital, L that denotes labour and E which stands for energy. These are spatial or thermodynamic variables and are the same as the potential energy of a particle in a conservative force field or thermodynamic potential such as the free energy of Gibb (Kümmel et al., Citation2002). The equation for growth is as follows:
That is, the total output function differential Y (K, L, E; t), divided by Y, is controlled by the elasticity of capital production(K), α, labour(L), β, and energy (E), γ, described as:
α, β and γ evaluate the production rate of growth, dY/Y, relies on rates of growth dK/K, dL/L, dE/E of the inputs K, L, E (Kümmel et al., Citation2010). In this way, the model analyzes the productive capacity of capital, labour, energy, and creativity. Therefore, in handling these variables the model departs from the growth theories of the neo-classical model (Kümmel et al., Citation2002). It is apparent from equations (ii) and (iii) that the production elasticity of the factor of production determines the effective capacity of the variable in that output increases by 1% while the other parameters remain unchanged. Given the economic weights of the forces of production, the elasticity of output is of significance to the model of output and economic performance. The effect of creativity is defined by δ in equation (ii), with t0 the base-year of the statistical analysis. It is clear from equations (ii) and (iii) that if the level of energy declines in the production process, the growth rate will decrease and vice versa. Kümmel and Lindenberger (Citation2014) argue that these structural changes will occur over time and energy and other parameters of the model will no longer remain unchanged, as creativity brings about structural change. According to Kümmel et al. (Citation2002), energy prices will increase due to such structural changes. A rise in energy prices holds down economic growth, largely through its influence on consumer demand (Edelstein & Kilian, Citation2009).
2.1.3. Endogenous growth model
Economist Paul Romer developed the endogenous growth theory in the 1980s as an alternative to the neo-classical growth theory. Romer (Citation1994) noted that the model assumes that growth is an intrinsic product of the economy rather than a product of exterior influences. According to Romer (Citation1986), the key critique of the neo-classical theory required the creation of a model that merged growth with endogenous factors. The endogenous growth hypothesis suggests that the benefits of innovation and technologies stimulate sustained economic performance (Maré, Citation2004). Therefore, theoretical work does not depend on exogenous technological progress to justify why per capita income has risen by an order of magnitude since the industrial revolution.
According to this theory, the neo-classical theory would not explain how technology progresses over time. Romer (Citation1994) stated that the endogenous growth model focuses on the behaviour of the economy as a whole. As a consequence, this function complements but is separate from the analysis of technological development or productivity at the level of the industry or firm. The economy’s behaviour can be summarised in the following equation:
Where denotes output per worker,
represents capital per worker,
stands for the level of technology,
denotes the labour force growth rate,
indicates the savings rate, ^ signifies an exponential rate of growth and
is a parameter on labour for output.
Technological advances will drastically change the strategic role of the different energy sources, minimise environmental damage caused by energy consumption and reduce energy supply costs, particularly energy services. Furthermore, technological improvements can be stimulated by an energy price increase and more productive equipment can reduce energy demand (Bessec & Meritet, Citation2007). In other words, an increase in
causes an increase in energy prices, since technology requires energy to function. However, a technological advance might increase energy demand, and this could result in high energy prices. It is argued that an increase in
in equation (iv) also means an increase in energy prices that could result in a rise in output. The role of energy prices in economic growth has also been tested through modification of a two-sector endogenous growth model (Rebelo, Citation1991) and it was shown that there was a positive link between energy prices and economic growth (Berk & Yetkiner, Citation2013).
2.1.4. The transmission mechanism
The transmission mechanism outlines the supply-side effect channel and the demand-side effect channel. This theory explains how monetary policy uses these channels to control high crude oil prices.
In terms of the supply side channel, a rise in demand for crude oil higher than supply in the economy results in a rise in crude oil prices. High oil prices trigger a change in the supply curve for products and services that use oil as an input. Aye et al. (Citation2014) note that an upsurge in crude oil prices negatively impacts production costs and economic growth. Wakeford (Citation2006) argues that high oil prices cause a decline in production output, while Sibanda et al. (Citation2015) assert that they cause the price level to increase and a decline in real wages, which in turn, increases the unemployment rate (Matekenya, Citation2013).
This theory has an income transfer impact, which is the exchange of currencies between oil-trading countries. During periods of high oil prices, importing countries buy crude oil at a high cost, raising the prices of domestic goods produced using crude oil. The additional payments made by importing countries’ customers to foreign oil suppliers is no longer spent on other types of consumption goods and consumer demand falls, resulting in a slowdown in economic activities.
Hence, a rise in the supply of savings results in a decline in the interest rate which leads to a decrease in the exchange rate and is followed by an increase in the price of imports such as crude oil. Dovciak (Citation1999) notes that reduced interest rates could encourage investment, offsetting the decline in consumption while sustaining aggregate demand in oil-importing countries. Therefore, a rise in investment would cause a decrease in the unemployment rate, since job opportunities would be created. In line with Blanchard and Johnson (Citation2013), a decrease in the interest rate due to factors like high oil prices leads to a rise in money supply in circulation in the economy. This theory argues that too much money in the hands of citizens of the country results in high inflation. To balance this effect, the monetary channel raises interest rates, resulting in lower investment spending, lower aggregate demand, and a downturn in productivity. Furthermore, changes in oil prices create uncertainty about future prices, leading to companies postponing investments and to individuals reducing their spending.
The transmission channel indicates that changes in the economy triggered by high crude oil prices may have contributed to the effects of volatility in inflation and economic growth (Bhattacharya & Bhattacharyya, Citation2001). However, the effect of such high prices on inflation and growth depends on the strength of the nation’s monetary policy (Choi et al., Citation2018). Thus, central banks adjust interest rates in the presence of crude oil shocks to stabilise the economy. Inflation and growth levels would be more steady, while the interest rate would fluctuate (Smal & De Jager, Citation2001).
2.2. Empirical review
Empirical evidence was reviewed from different authors such as Sarwar et al. (Citation2017) who used panel data to examine the empirical link between growth, energy use and oil prices from 1960 to 2014, gross fixed capital formation and the Organisation for Economic Co-operation and Development (OECD) population. The long-run connection between variables, the Pedroni panel cointegration, the entirely updated ordinary least squares (OLS) and the panel Vector error correction model (VECM) were used to test the long-run connection between variables. The findings of the panel analysis affirmed a bi-directional connection between the use of electricity, price of oil, and growth. Parallel to these findings, Shahbaz et al. (Citation2017) established a positive two-directional connection between oil price and growth. They used panel data to evaluate the link between growth, use of electricity, the price of oil, labour and capital from 1960 to 2014 in OECD countries. Panel cointegration, long-term parameter estimation, and Pool Mean Party experiments were used to evaluate the cointegration of variables. The empirical results indicated cointegration between the variables.
Ciarreta and Zarraga (Citation2010) employed panel techniques to explore the long-term causal connection between consumption of electricity and growth across 12 countries in Europe, utilising annual data from 1970 to 2007. Measures for the panel unit-root, cointegration into diverse panels and the causality of the panel were used. The findings suggest two-way causality between the price of oil and growth and poor proof of a relationship between consumption of electricity and energy prices. Da Silva and Cerqueira (Citation2017) investigated the determinants of household electricity prices in Europe using the dynamic model of panel data and the generalized method of moments (GMM) technique. The study found a link between household electricity prices and the variables relating to market liberalisation, and renewable energy sources which supported the liberalisation of European policy, that resulted in a rise in growth.
Turning to studies that employed the time-series approach, Fatine et al. (Citation2018) examined the causal relationship between oil prices and growth in Saudi Arabia from 1998 to 2014 using the Granger causality test. The study established that a change in the price of oil has a major effect on growth in Saudi Arabia and confirmed the presence of a bi-directional causal link between oil prices and growth. Hanabusa (Citation2009) also found bi-directional causality between the price of oil and economic development in Japan using the exponential generalized autoregressive conditional heteroskedastic (EGARCH) model for the period 2000 to 2008.
Dagoumas et al. (Citation2020) investigated the connection between energy prices and growth in Europe from 1990 to 2018 using the Engle–Granger method to estimate annual data and employing the VECM. The study found causality between the price of crude oil and the industrial electricity price to the price of residential electricity. The results also suggest that an increase in electricity prices would not negatively impact European growth rates. However, He et al.’s (Citation2015) study in China that covered the period 2000 to 2010 and employed a theoretical model concluded that, from a statistical point of view, low electricity prices tend to be beneficial for economic growth. The above results were confirmed by Yoshino and Taghizadeh-Hesary (Citation2015) who used the Weighted Two-Stage Least-Squares method to investigate the role played by relaxed monetary policy in Japan’s growth from Q2 1994 to Q2 2014. The study found that high energy prices were the result of depreciation of the Japanese yen.
Shahbaz et al. (Citation2016) investigated the relationship between growth and renewable sources of energy in the United States (US) and found that there were important reciprocal influences between growth and energy consumption during extreme events. The Wavelet Squared Coherence and Multiple Wavelet Coherence methods were used to represent changes between the variables using monthly data from January 1981 to March 2015. Kirikkaleli et al. (Citation2021) employed Toda Yamamoto causality and wavelet coherence tests to analyse the causal connection between nuclear energy use and growth in the United Kingdom from 1998 to 2017. The study concluded that changes in growth lead to changes in nuclear energy consumption in the United Kingdom in the long run. In the short run, there was a positive association between nuclear energy use and growth from 2002 to 2006.
Many scholars have examined the relationship between energy prices and growth in developing nations. Some focused on energy prices and growth, while others examined energy consumption and growth. Frimpong et al. (Citation2018) used the GMM estimation methodology to explore the impact of energy prices on growth in West African nations. The findings revealed that energy prices had a significant negative impact on growth from 2002 to 2015. Arshad et al. (Citation2016) obtained similar results in their study that used the same technique to investigate the impact of energy prices on growth in Pakistan from 1991 to 2011. Antwi (Citation2017) employed the GMM estimating methodology to ascertain the impact of energy prices on growth among members of the Economic Community of West African States (ECOWAS) for the period 2000 to 2015. The study found that growth was extremely adversely impacted by energy.
Brucal and Dechezlepretre (Citation2021) used a two-stage least square method to examine the influence of energy prices on the environmental and economic performance of Indonesian manufacturing plants from 1980 to 2015. The authors found no convincing evidence that energy price changes had a negative impact on employment and output. Li and Leung (Citation2021) examined the link between energy prices, economic growth, and renewable energy consumption in seven European nations from 1985 to 2018. Long-run causality from the independent variables to renewable energy use was established as well as short-run causality from fossil fuel price indexes to renewable energy consumption.
Adams et al. (Citation2016) analysed panel data for 16 sub-Saharan African nations to determine the connection between energy consumption and economic performance from 1971 to 2013 using the panel vector autoregressive model in the GMM method. Positive feedback relations were found from energy consumption, energy prices and growth. These findings are in line with Iyke (Citation2015) who used VECM to examine the complex causal relationship between Nigeria’s electricity usage and growth from 1971 to 2011. The results showed causality from electricity usage to growth in both the short and long term. Sharaf (Citation2016) explored causality between energy usage and growth in Egypt between 1980 and 2012. The study found no evidence of Granger’s causality. However, a unidirectional causal link was found between growth, electricity and oil use. In addition, energy efficiency policies had an adverse effect on economic performance.
At the time of the study, there was a paucity of research on the link between energy prices and economic growth in South Africa. Many scholars have focused on energy prices’ impact on economic growth, but few have analysed the link between the two. Gonese et al. (Citation2019) examined the impact of electricity prices on production at the sectoral level in South Africa from 1994 to 2015 using the generalized least-squares methodology. The findings show that electricity prices negatively impact production. Mazambani’s (Citation2015) study on the effect of electricity prices on the South African economy employed VECM, the Johansen cointegration technique to analyse annual data from 1986 to 2013. The study found that electricity prices have a negative impact on economic growth.
Chisadza et al. (Citation2016) investigated oil shocks’ impact on the South African economy using the vector autoregressive technique and quarterly data from 1975 to 2011. The authors emphasised the significance of ascertaining the cause of fluctuations in the oil price, as a rise in price does not necessarily have negative effects on the economy. In contrast, Balcilar et al. (Citation2014) applied the Markov switching vector autoregressive method to inspect the impact of oil price volatility on growth between 1960 Q2 and 2013 Q3 and found that South Africa remains vulnerable to increases in the price of oil, regardless of the level of the economy.
Khobai et al. (Citation2017) explored the link between electricity prices and economic growth in South Africa from 1985 to 2014. The results of the bounds test suggest a long-run relationship between electricity prices and growth and that high prices harm growth. Matekenya (Citation2013) used the VECM method to investigate the influence of oil price fluctuations on economic growth in South Africa for the period Q4 1994 to Q4 2020. The findings revealed a negative short-run and positive long-run connection between these variables.
This review highlights the lack of research on the causal connection between energy prices and growth. Dagoumas et al. (Citation2020) and He et al. (Citation2015) focused on electricity prices’ impact on growth, while Chisadza et al. (Citation2016) and Ogboru et al. (Citation2017) explored the oil price’s effect on growth. Frimpong et al. (Citation2018) and Antwi (Citation2017) used the same variables as the current study; however, they employed panel data analyses. Van Eyden et al. (Citation2019) and Arshad et al. (Citation2016) focused on variables such as oil prices and Adams et al. (Citation2016) and Polat (Citation2018) analysed energy consumption’s impact on growth.
Furthermore, studies that investigated energy prices looked at oil prices or electricity prices separately, particularly in the South African context. Most employed the GMM technique and panel data. In addition, some focussed on the effect of energy consumption on growth, while others investigated the unidirectional effect of energy prices on growth. The current study was interested in the bidirectional relationship; hence the causality checks. It also combined electricity and oil prices in the regression model. It thus aimed to contribute to the literature in South Africa by investigating the causal link between energy prices and growth from 1994 to 2019 using time series data through the application of the ARDL model.
3. Methodology
3.1. Model specification
In analysing the causal relationship between the price of energy and economic growth in South Africa, the following econometric model that was applied by Khobai et al. (Citation2017) was modified..
where GDP denotes gross domestic product, TR signifies trade openness, ES stands for electricity supply, EM represents aggregate labour force, K denotes capital and P indicates electricity prices, and the output elasticities with respect to the mentioned variables are ,
,
,
,
respectively. Equation (v) was modified by excluding variables that were not reviewed, such as
: trade openness,
: electricity supply and replacing them with oil prices. Labour productivity was used instead of
: the total labour force and
: capital was substituted by gross fixed capital formation. The following variables were as they are,
: economic growth and
electricity prices. Therefore, in line with formulation (v), the specific econometric model for the study takes the following form:
Where: is the overall value contributed by all manufacturers in the national economy, plus product duty, less any subsidy that is not part of the value of goods,
in South Africa is an annual average of total electricity price charged to different customers,
denotes the general price of various barrels of Brent crude oil,
means how many goods can be produced in an hour of work, manufacturing-labour productivity,
denotes net investment, gross fixed capital formation-investment,
to
represents the parameters to be estimated,
denotes the error term and
signifies a dummy variable that captures the shock experienced by economic growth due to the 2007 and 2008 global financial crises.
3.2. Data sources
The data for the variables was obtained from the global economy, South African Reserve Bank (SARB) database and Eskom. To empirically test the model, the study employed annual data for the period 1994 to 2019 for South Africa. Time-series data were used that provide knowledge on the variables’ economic dynamics.
3.3. Estimation techniques
Summary statistics were conducted to describe the variables. Formal unit root tests such as the augmented Dickey Fuller test (ADF) and Philips Peron (P-P) tests were carried out, as well as informal unit root tests using the graphical method. The unit root tests were conducted to check the order of integration of the series. The Schwarz Criteria (SC) were used to select the lag structure.
The objective was to establish if there is a long-term connection between the variables by employing ARDL bounds testing because of its advantage of accommodating a small sample size, unlike the Johansen cointegration approach that requires a larger sample size to achieve reliability (Thao & Hua, Citation2016). The conventional ARDL model for this study is expressed as follows:
where signifies the first difference operator
depicts the maximum lag length
-
represents the short-run coefficients,
denotes the drift component,
to
represents long-run coefficients and
denotes the white noise residual. The ARDL bounds testing uses the
and
-statistics to test for the significance level of lagged variables in a univariate error correlation system when there is uncertainty about the long-run relationship between variables (Pesaran et al., Citation2001). The null hypothesis that there is no long-term link between the variables is checked against the alternative hypothesis that there is a long-run connection among the series under review. The rule of thumb suggests that if the
- statistic is more than the critical values of the upper bound
, the null hypothesis is not accepted or otherwise. In other words, this implies that there is a long-run connection between the series.
The Granger (Citation1969) causality tests were applied to examine the causal connection between energy prices and growth in South Africa. These tests examine causality among the variables in a time-series. The Granger causality technique is a statistical hypothesis for evaluating whether the existence of a single variable is important in forecasting the other variable by giving the causality direction amongst the variables. The null hypothesis is that lagged - values do not explain the variation in
and alternative x values do explain
values, meaning that
does not Granger-cause
(Granger, Citation1969).
Analytical tests of inferences such as autocorrelation, diagnostic tests and stability tests were carried out to ensure the model does not suffer from autoregressive conditional heteroscedasticity problems. Stability diagnostic tests were conducted to ensure that it does not disturb the classical assumption that is a misspecification of error. The cumulative sum (CUSUM) test and cumulative sum of squares (CUSUMQ) test were used to check the null hypothesis that the parameters are stable with an alternative hypothesis that the model is unstable. If the CUSUM line crosses one of the two 5% significance lines, the null hypothesis is rejected, which implies that the model is stable.
4. Empirical results
4.1. Descriptive statistics of variables
It is critical to determine the summary statistics of the variables before engaging in any econometric estimation of the model. The outcomes are presented in Table . According to Gujarati and Porter (Citation2009), a normal distributed series has a skewness of 0, kurtosis of 3 and a p-value of the Jarque-Bera greater than 5% level of significance.
Table 1. Summary statistics of variables
The results in Table illustrate that variables such as electricity prices, oil prices and gross fixed capital formation have a long-right tail distribution around the mean with a skewness of 1.107404, 0.454236 and 0.299430, respectively. However, growth has a skewness of −0.323340 and labour productivity’s skewness is −0.398766—both variables reflect the long-left tail distribution. The results in Table suggest that all the variables are platykurtic distributed, meaning that they have a flat distribution relative to normal distribution since their kurtosis values are less than 3. In other words, the frequency distribution curve of the variables under review is flatter than the normal distribution curve. Furthermore, the p-value of the Jarque–Bera test for all series is more than 5% level of significance. This means that the null hypothesis that all series are normally distributed is accepted.
4.2. Correlation test
Table presents the correlation matrix results of the variables under review.
Table 2. Correlation test results
It is observed from Table that the correlation coefficient of electricity prices is −0.297734, crude oil prices are around −0.059932 and labour productivity is about −0.320882. These variables are considered to have a weak negative correlation with economic growth since the correlation coefficients are less than 0.4. The strength of association between economic growth and gross fixed capital formation is moderately negative because the correlation coefficient is −0.517920 which lies between 0.5 and 0.7. The results also show that crude oil prices have a strong positive correlation to labour productivity with a correlation coefficient of 0.773472 which is greater than 0.7. The correlation between crude oil prices and gross fixed capital formation is moderately positive, since the correlation coefficient is 0.695003 which lies between the range of 0.5 and 0.7. The strength of association running from electricity prices to labour productivity and gross fixed capital formation with correlation coefficients of 0.395142 and 0.389542, respectively, is considered as weak positive correlation since both correlation coefficients are less than 0.4.
Moreover, there is moderate positive correlation from prices of electricity to prices of crude oil with a correlation coefficient of 0.676266, which ranges between 0.5 and 0.7. Labour productivity and gross fixed capital formation have strong positive correlation, since the correlation coefficient is 0.739779, which is greater than 0.7.
4.3. Formal unit root tests
The formal unit root tests employed include ADF and P-P, with the results presented in Tables and IV. The variables are stationary at level if integrated of order I(0) and stationary variables at first difference are integrated of order I(1). Table reports the ADF test at level and first difference.
Table 3. Augmented Dickey Fuller test results
Variables such as growth, prices of electricity, prices of crude oil and gross fixed capital formation are not stationary at level in both intercept and trend and intercept. However, all these variables are stationary at first difference under intercept and trend and intercept. Labour productivity is the only variable that is stationary at level and intercept. In addition, it is not stationary at level. The P–P test results are reported in Table .
Table 4. Phillips–Perron test results
Table shows that the unit root tests found that all the variables are stationary. Labour productivity is integrated of order I(0), because it is stationary at level, while growth, electricity prices, crude oil prices and gross fixed capital formation are stationary at first difference; therefore, they are integrated of order I(1). The ARDL methodology was chosen because both the ADF and P-P tests indicated that labour productivity is integrated of order I(0) while all the other variables are integrated of order I(1). This is because the ARDL model runs well in the regression with series of different orders. The model is an appropriate econometric tool as it can detect hidden cointegration relationships and it is suitable for estimating such relationships in small samples.
4.4. Optimal lag structure
The other important preliminary step in modelling data involves the selection of the appropriate lag order. figure shows the results of the optimal lag selection criteria for the ARDL method.
Figure 1. Optimal lag structure.Source: Authors’ computation using Eviews 10
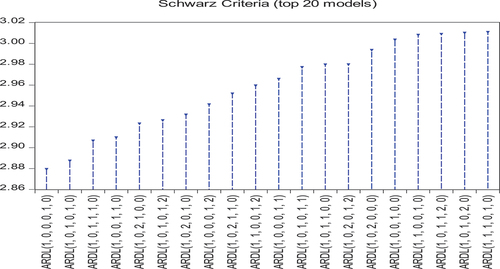
In line with the results depicted in Figure , the lag structure recommended by the Schwarz Criteria is the ARDL (1, 0, 0, 0, 1,0) model. Having determined the appropriate lag length for the model, the ARDL bounds cointegration test was conducted based on the selected lag length.
4.5. ARDL bounds test for cointegration
The next empirical test involved the test of the long-run relationship between series and the results are reported in Table .
Table 5. Bounds test results
The rule of thumb suggests that if the F-statistic is greater than the critical value of the upper bound I(1), the conclusion can be drawn that there is cointegration (Nkoro & Uko, Citation2016). The results in Table suggest rejection of the null hypothesis since the F-statistic has a value of 18%, which is more than all the critical values for the upper bound I(1). Therefore, the presence of cointegration between the variables of interest at the 5% significance level is confirmed.
4.6. Long-run elasticities
The results of the application of the long-run ARDL framework are presented in Table . The findings suggest highly persistent economic growth. The coefficient of lagged economic growth is −0.398, and it is statistically significant since the p-value of 0.0401 is less than the 5% significance level.
Table 6. Long-run elasticities
The results in Table suggest that electricity prices are negatively related to economic growth since the coefficient value is −0.060. Hence, a 1% rise in electricity prices will decrease the speed of growth in South Africa by 0.060 units. These findings are in line with the earlier stated expected a priori of the study. Moreover, Table indicates that electricity prices have a p-value of 3.6% which is less than the 5% significance level. In other words, electricity prices are significant in explaining the growth path of the South African economy, since it is significant at the 5% level. These findings are similar to those of recent studies by Khobai et al. (Citation2017) and Gonese et al. (Citation2019) who established that electricity prices in South Africa have a negative significant impact on growth. This was associated with a decrease in electricity sustainability in the country (Ateba et al., Citation2019). Akkemik (Citation2011) found that a rise in the price of electricity would result in increased production costs for the manufacturing sector. An increase in operational costs causes producers to cut other costs in order to maintain a reliable cash flow. In terms of production output, productivity would decline in response to a rise in electricity prices because producing more products requires more electricity, which will result in low economic growth (Edelstein & Kilian, Citation2009). However, electricity prices have an insignificant relationship with economic growth in the services, transport, residential and agricultural sectors (Gasealahwe, Citation2020). In the long run, the price of electricity has no effect on the manufacturing, wholesale, and retail sectors (Ezesele, Citation2017).
Table indicates that the long-run coefficient for crude oil prices is 2.759. Thus, in South Africa, a 1% increase in crude oil prices results in an approximate 2.759 units increase in growth. The results show that crude oil prices are a significant factor in South Africa’s economic growth since the p-value is 0.00, less than the 5% level of significance. These results are in line with Matekenya (Citation2013) and Chisadza et al. (Citation2016) who established that crude oil prices have a positive connection with economic growth in South Africa and are also significant. This is in contrast to the expected a priori and Balcilar et al. (Citation2014) who confirmed that crude oil prices have a negative effect on South Africa’s growth. Sodeyfi and Katircioglu (Citation2016) established that the price of crude oil has a negative effect on economic activity in some countries, but a positive impact in others. South Africa’s strong monetary policy could be a reason for the positive link between crude oil prices and economic growth. In addition, coal contributes about 77% of the country’s energy needs (Statistics South Africa (StatsSA), Citation2020); thus, crude oil is not the main source of energy.
Table shows that labour productivity is positive and significant relative to economic growth. Since the p-value is 0.00, less than the 5% significance level and the value of the coefficient is 15.406, a 1% increase in labour productivity accelerates growth in South Africa by 15.406 units. These results are in line with Mazambani (Citation2015) who found that labour productivity has a positive and significant relationship with economic growth in the long run. They are also consistent with Zulu and Banda (Citation2015) who established that labour productivity has a favourable impact on South Africa’s economic growth. However, they contradict Jajri and Ismail (Citation2010) who established that labour productivity is insignificant in explaining economic growth because labour is measured at the educational level.
Table further illustrates that gross fixed capital formation is positive in the long-run with a coefficient of 7.245. Thus, in South Africa, a 1% increase in gross fixed capital formation results in around a 7.245 units increase in growth. Gross fixed capital formation has a weak significant relationship with growth because the p-value is 8.8%, less than the 10% level of significance. This could be due to insufficient capital inflow into the economy and other negative factors affecting the economy such as corruption, political instability and weak investment strategies. The results are in line with Onyinye et al. (Citation2017) and Nwakanma and Ibe (Citation2014) who found that gross fixed capital formation has an insignificant relationship with economic growth. However, they contradict Pasara and Garidzirai (Citation2020) who found that gross capital formation has a positive connection with economic growth in South Africa.
Lastly, Table shows that the dummy variable (D) has a negative coefficient, which means that economic growth was extremely depressed in South Africa during the 2007/8 global financial crises.
4.7. Short-run elasticities
The short-run elasticities and the ARDL error correction model are presented in Table .
Table 7. Short-run elasticities and ECM
In the short run, the electricity price is negative and significant since the p-value is 0.57%, less than the 5% level of significance. Table shows that the coefficient for electricity prices is −0.060. As a result, in South Africa a 1% increase in electricity prices causes a 0.060 units’ decline in growth. These results concur with the long-run results. However, Mazambani (Citation2015) found that electricity prices have an insignificant influence on economic growth in South Africa.
Table indicates that crude oil prices are positive and significant in the short run, since the p-value is 0.00, less than the 5% significance level. It also shows that crude oil prices are positively related to economic growth since the coefficient value is 3.916. Hence, a 1% rise in crude oil prices increases the speed of growth in South Africa by 3.916 units. The findings are in line with the long-run results. A number of studies have found a positive connection between crude oil prices and economic growth (e.g., Berument et al., Citation2010; Kilian & Hicks, Citation2013; Shahbaz et al., Citation2017). This might be due to South Africa’s strong monetary policy. During the study period crude oil prices were high (South African Reserve Bank (SARB), Citation2020). Sibanda et al. (Citation2015) state that South African monetary policy is extremely accommodating; thus, high crude oil prices might not result in high inflation and low growth. Monetary policy measures such as interest rate and inflation targeting were utilised to balance high crude oil prices’ effect on the South African economy (South African Reserve Bank (SARB), Citation2020). These findings contradict those of Difeto et al. (Citation2018) and Adeniran and Igbatayo (Citation2016) who assert that high oil prices harm economic growth.
In the short run, labour productivity is significant since the p-value is 0.74%, less than the 5% significance level and these findings are in line with the long-run results. The results show that labour productivity has a positive relationship with economic growth since a 1% increase in labour productivity results in about 16.327 units of economic growth in South Africa. This is in line with Alam et al. (Citation2013) who argue that a rise in labour productivity causes an increase in economic growth. However, they are in contrast to Korkmaz and Korkmaz (Citation2017) who assert that the labour productivity does not cause economic growth.
Table shows that, in the short run, the coefficient of gross fixed capital formation indicates that for every 1% increase in gross fixed capital formation, economic growth declines by approximately 7.251 units. In other words, gross fixed capital formation has a negative but significant relationship with economic growth since the p-value is 1.05%, less than the 5% level of significance. The possible reason is that other investment takes time to influence the economy; hence, gross fixed capital formation has a negative impact on growth in the short run. These findings contradict those of Kanu and Ozurumba (Citation2014) who found that gross fixed capital formation has an insignificant impact on economic growth in the short run. The coefficient of ECM which is the speed of adjustment is negative and significant. This implies that the South African economic system has an adjustment mechanism that automatically corrects previous deviations from the equilibrium at a speed of 63.58% each year.
4.8. Granger causality test
The Granger causality test was performed using the pairwise Granger causality test and the results are presented in Table .
Table 8. Pairwise Granger causality tests
Table show that electricity prices do not Granger cause economic growth in South Africa, because the p-value is 22.60%, more than the 5% significance level. Furthermore, economic growth does not Granger cause electricity prices, since the p-value is 56.72%, more than the 5% level of significance. These results are in line with Lean and Smyth (Citation2010) who established that there is no causal connection between electricity prices and Malaysia’s economic growth.
As shown in Table , the hypothesis that crude oil prices do not Granger cause economic growth cannot be rejected, because the p-value of 30.12% is more than the 5% level of significance. Furthermore, the hypothesis that economic growth does not Granger cause crude oil prices is accepted, since the p-value is 39.81% which is also greater than the 5% significance level. These results are in line with Ghalayini (Citation2011) who established that there is no Granger causality between the price of oil and growth in most OPEC countries.
The hypothesis that labour productivity does not Granger cause economic growth is not accepted since the p-value is 5.49%, less than the 10% significance level. Moreover, the hypothesis that economic growth does not Granger cause labour productivity is accepted because the p-value of 23.31% is more than the 5% significance level. The findings highlight one-way causality running from labour productivity to economic growth. These findings are in line with Dhiman and Sharma (Citation2019) who found one-way causality from labour productivity to growth in India. Therefore, labour productivity causes economic growth in South Africa (Mongale, Citation2019).
The results in Table show evidence of long-run unidirectional causality from gross fixed capital formation to economic growth. In other words, gross fixed capital formation Granger causes growth, while growth does not Granger cause gross fixed capital formation in South Africa. These results concur with Blomstrom et al. (Citation1993) who found that gross fixed capital formation causes growth, whereas economic growth does not cause fixed gross capital formation.
4.9. Diagnostic test
The last empirical analysis undertaken in this study involved the diagnostic tests. The results of the heteroscedasticity, serial correlation and residual normality tests are indicated in Table .
Table 9. Residual diagnostic test results
The Breusch-Godfrey test was utilised, with a p-value of 6.25% indicating the absence of serial correlation; therefore, the null hypothesis that there is no serial correlation is accepted at the 5% level of significance. The White test was utilised to check for heteroscedasticity and, based on the result in Table , the null hypothesis that the residuals of the series have no heteroscedasticity is accepted because the p-value of 75.79% is above the 5% level of significance. Normality of the residuals was tested using the Jarque-Bera test. The table shows that the p-value of the Jarque-Bera statistic is 58.29%. Therefore, we cannot reject the null hypothesis that the residuals are normally distributed because the p-value is more than the 5% significance level.
The Ramsey Reset test outcomes presented in Table show there are no signs of misspecification errors in the model because the p-value of 28.56% is above the 5% significance level. Therefore, the null hypothesis that the model does not show any signs of misspecification is accepted.
4.10. Dynamic stability tests
Following diagnostic testing, it is also necessary to test whether the model is stable or otherwise at a 5% level of significance. The stability tests carried out were the recursive estimation of the model using the CUSUM and CUSUMQ tests, and the outcomes are reported in figure .
Figure 2. Dynamic stability test results.Source: Authors’ computation using Eviews 10
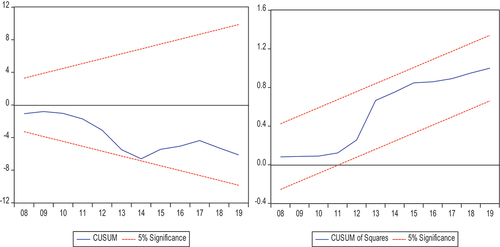
It is clear from the results reported in Figure that the regression model is stable since both the CUSUM and the CUSUMQ lines lie within the 5% significance level. Thus, the null hypothesis of instability in the model cannot be accepted.
5. Policy implications and recommendations
This paper examined the causal connection between energy prices and economic growth in South Africa using annual time-series data for the period 1994 to 2019. Relevant theories and empirical evidence from related studies were reviewed. Previous studies revealed mixed findings in developed and developing nations and in the context of South Africa. ADF and P-P methods were used to test the stationarity of the data. The results revealed that the variables are integrated of different orders. Hence this study used the ARDL methodology as it works well when the series are integrated in different orders. The specific econometric model for this paper was represented by equation (vi) which was estimated using ARDL methodology. The long-run cointegration relationship between the variables of interest was established. Taken together, the findings have a number of policy implications. These are structured as energy policy, labour policy, and investment policy.
5.1. Energy policy
Following the demise of the apartheid regime, South Africa experienced high energy prices from 1994 to 2019. The regression model used in this study included oil and electricity prices. The results showed that electricity prices have a significant negative long- and short-run effect on economic growth in South Africa. However, crude oil prices have a significant long- and short-run positive impact on economic growth since monetary policy managed to stabilise the effect of high crude oil prices during the study period. It is thus recommended that the government should take steps to mitigate the effects of rising electricity prices and maintain strong monetary policy in order to manage crude oil prices on an on-going basis. Possible policy solutions to address high energy prices, in particular electricity prices might include the establishment of suppliers that produce energy from green sources (sun, wind and water). These sustainable sources would enhance production output and reduce the inflation impact of increased prices.
5.2. Labour policy
The study’s findings indicated that labour productivity has a significant positive influence on the growth of the South African economy. The results from the Granger causality tests showed that labour productivity causes economic growth in the country. Based on this finding, it is recommended that government policy should focus on investment in skills development programmes, technological innovation and the educational system in order to increase the pool of skilled labour. In turn, this will increase the number of products produced per hour. It is also recommended that policies be adopted to promote job creation for South African citizens, particularly skilled labour. It is important to maintain high labour productivity since it results in high economic growth.
5.3. Investment policy
The results confirmed that gross fixed capital formation has a significant positive effect on growth in the long run in South Africa, supporting the notion that investment is an important tool for growth. The Granger causality test results indicated that gross fixed capital formation causes economic growth in the country. Thus, government investment should be encouraged. The government should also step up efforts to attract investors to South Africa, as this will result in increased output and thus, economic growth. In order to attract and retain investors, corruption should be eradicated and political stability must be maintained.
5.4. Suggestions for further research
This paper investigated the connection between energy prices and the growth of the South African economy. It is recommended that future studies in this area should use panel estimation techniques to examine the relationship between energy prices and economic growth at sector or industry level to check if the effect is the same. Further studies could also investigate the channels through which crude oil prices affect economic growth in South Africa, and the reasons why high crude oil prices do not negatively affect economic growth as much as electricity prices.
6. Limitations of the study
The paper’s primary goal was to examine the connection between energy prices and growth in South Africa from 1994 to 2019 using annual time series data. Electricity prices, crude oil prices, labour productivity and gross fixed capital formation were selected as variables. Many other variables such as exchange rates, population growth, unemployment and so on can be used to determine economic growth. Furthermore, while the study aimed to explore the relationship between energy prices and economic growth, some important related issues were not addressed. Finally, this paper was based on the effect of two types of energy sources on economic growth and did not include other energy sources in the South African economy.
Disclosure statement
No potential conflict of interest was reported by the author(s).
Additional information
Funding
Notes on contributors

Siyakudumisa Takentsi
Siyakudumisa Takentsi research interests lie in development economics, energy economics, applied econometrics, monetary economics, macroeconomics, economics in general, and public finance.
References
- Adams, S., Klobodu, E. K. M., & Opoku, E. E. O. (2016). Energy consumption, political regime and economic growth in sub-Saharan Africa. Energy Policy, 96, 36–23. https://doi.org/10.1016/j.enpol.2016.05.029
- Adeniran, A. O., & Igbatayo, S. (2016). The impact of petroleum price volatility on Nigeria’s economy. Institute for Oil, Gas, Energy, Environment and Sustainable Development.
- Akkemik, K. A. (2011). Potential impacts of electricity price changes on price formation in the economy: A social accounting matrix price modeling analysis for Turkey. Energy Policy, 39(2), 854–864. https://doi.org/10.1016/j.enpol.2010.11.005
- Alam, A., Arshad, M. U., & Rajput, W. (2013). Relationship of labor productivity, foreign direct investment and economic growth: Evidence from OECD countries. Journal of Business and Management Sciences, 1(6), 133–138.
- Antwi, A. O. 2017. Effects of energy prices on economic growth in the ECOWAS subregion: Investigating the channels using panel data. College of Arts and Social Sciences. http://hdl.handle.net/123456789/10269 (accessed on 24 December 2020)
- Arshad, A., Zakaria, M., & Junyang, X. (2016). Energy prices and economic growth in Pakistan: A macro-econometric analysis. Renewable and Sustainable Energy Reviews, 55(C), 25–33. https://doi.org/10.1016/j.rser.2015.10.051
- Ateba, B. B., Prinsloo, J. J., & Gawlik, R. (2019). The significance of electricity supply sustainability to industrial growth in South Africa. Energy Reports, 5, 1324–1338. https://doi.org/10.1016/j.egyr.2019.09.041
- Aye, G. C., Dadam, V., Gupta, R., & Mamba, B. (2014). Oil price uncertainty and manufacturing production. Energy Economics, 43(C), 41–47. https://doi.org/10.1016/j.eneco.2014.02.004
- Bah, M. M., & Azam, M. (2017). Investigating the relationship between electricity consumption and economic growth: Evidence from South Africa. Renewable and Sustainable Energy Reviews, 80(C), 531–537. https://doi.org/10.1016/j.rser.2017.05.251
- Balcilar, M., Van Eyden, R., Uwilingiye, J., & Gupta, R. (2014). The impact of oil price on South African GDP growth: A bayesian markov switching-VAR analysis. Working Papers 15–13. Eastern Mediterranean University, Department of Economics.
- Balcilar, M., Van Eyden, R., Uwilingiye, J., & Gupta, R. (2017). The impact of oil price on South African GDP growth: A bayesian markov switching‐VAR analysis. African Development Review, 29(2), 319–336. https://doi.org/10.1111/1467-8268.12259
- Berk, Ý., & Yetkiner, H. (2013). Energy prices and economic growth: Theory and evidence in the long run, Working Papers in Economics (No 13/03). http://hdl.handle.net/10419/175927
- Berument, M. H., Ceylan, N. B., & Dogan, N. (2010). The impact of oil price shocks on the economic growth of selected MENA1 countries. The Energy Journal, 31(1), 149–176.
- Bessec, M., & Meritet, S. (2007). The causality link between energy prices, technology and energy intensity. In Horst Keppler, Jan, Bourbonnais, Regis, Girod, Jacques (eds.,). The econometrics of energy systems (pp. 121–145). Palgrave Macmillan.
- Bhattacharya, K., & Bhattacharyya, I. (2001). Impact of increase in oil prices on inflation and output in India. Economic and Political Weekly 51(36), , 4735–4741.
- Blanchard, O., & Johnson, D. R. (2013). Macroeconomics (6th ed.). Pearson Education.
- Blomstrom, M., Lipsey, R. E., & Zejan, M. 1993. Is fixed investment the key to economic growth? NBER Working Paper No. 4436. Cambridge, MA: National Bureau of Economic Research.
- Brucal, A., & Dechezlepretre, A. (2021). Assessing the impact of energy prices on plant-level environmental and economic performance: Evidence from Indonesian manufacturers (OECD Environmental Working Papers.).
- Chisadza, C., Dlamini, J., Gupta, R., & Modise, M. P. (2016). The impact of oil shocks on the South African economy. Energy Sources, Part B: Economics, Planning, and Policy, 11(8), 739–745. https://doi.org/10.1080/15567249.2013.781248
- Choi, S., Furceri, D., Loungani, P., Mishra, S., & Poplawski-Ribeiro, M. (2018). Oil prices and inflation dynamics: Evidence from advanced and developing economies. Journal of International Money and Finance, 82(C), 71–96. https://doi.org/10.1016/j.jimonfin.2017.12.004
- Ciarreta, A., & Zarraga, A. (2010). Economic growth-electricity consumption causality in 12 European countries: A dynamic panel data approach. Energy Policy, 38(7), 3790–3796. https://doi.org/10.1016/j.enpol.2010.02.058
- Da Silva, P. P., & Cerqueira, P. A. (2017). Assessing the determinants of household electricity prices in the EU: A system-GMM panel data approach. Renewable and Sustainable Energy Reviews, 73(C), 1131–1137. https://doi.org/10.1016/j.rser.2017.02.016
- Dagoumas, A. S., Polemis, M. L., & Soursou, S. E. (2020). Revisiting the impact of energy prices on economic growth: Lessons learned from the European Union. Economic Analysis and Policy, 66(C), 85–95. https://doi.org/10.1016/j.eap.2020.02.013
- Dhiman, R., & Sharma, M. (2019). Relation between labour productivity and export competitiveness of Indian textile industry: Co-integration and causality approach. Vision: The Journal of Business Perspective, 23(1), 22–30. https://doi.org/10.1177/0972262918821230
- Difeto, M., Van Eyden, R., Gupta, R., & Wohar, M. E. (2018). Oil price volatility and economic growth: Evidence from advanced OECD countries using over one century of data. Working Papers No. 201813. University of Pretoria, Department of Economics.
- Dikkaya, M., & Doyar, B. V. (2017). Causality among oil prices, GDP and exchange rate: Evidence from Azerbaijan and Kazakhstan. Bilig, 83(Autumn), 79–98.
- Dovciak, P. (1999). Transmission mechanism channel of monetary policy. Institute of Monetary and Financial Studies of the NBS.
- Edelstein, P., & Kilian, L. (2009). How sensitive are consumer expenditures to retail energy prices? Journal of Monetary Economics, 56(6), 766–779. https://doi.org/10.1016/j.jmoneco.2009.06.001
- Ezesele, S. L. 2017. Dynamic relationships between sectoral electricity consumption, economic growth and electricity prices in South Africa [Doctoral dissertation KwaZulu-Natal]: University of Zululand.
- Fatine, M., Elmezouar, Z. C., & Amanjahie, I. (2018). Test of causality between oil prices and GDP. Case study Saudi Arabia. Economic Computation and Economic Cybernetics Studies and research/Academy of Economic Studies, 52(3), 279–289.
- Frimpong, P. B., Antwi, A. O., & Brew, S. E. Y. (2018). Effect of energy prices on economic growth in the ECOWAS sub-region: Investigating the channels using panel data. Journal of African Business, 19(2), 227–243. https://doi.org/10.1080/15228916.2017.1405706
- Gasealahwe, B. 2020. Relationship between electricity prices, consumption and economic growth in South Africa [Master’s thesis]. Faculty of Commerce, Graduate School of Business, University of Cape Town.
- Ghalayini, L. (2011). The interaction between oil price and economic growth. Middle Eastern Finance and Economics, 13(21), 127–141.
- The Global Economy. 2021. Annual economic report. https://www.theglobaleconomy.com (accessed on 08 February 2021)
- Gonese, D., Hompashe, D., & Sibanda, K. (2019). The impact of electricity prices on sectoral output in South Africa from 1994 to 2015. African Journal of Economic and Management Studies, 10(2). https://www.researchgate.net/deref/https%3A%2F%2Fdoi.org%2F10.1108%2FAJEMS-12-2017-0305
- Granger, C. W. (1969). Investigating causal relations by econometric models and cross-spectral methods. Econometrica: Journal of the Econometric Society, 37(3), 424–438. https://doi.org/10.2307/1912791
- Gujarati, D. N., & Porter, D. C. (2009). Basic econometrics (5th ed.). United States of America: McGraw Hill Companies.
- Hahn, F. H. (2010). Neoclassical growth theory. In Durlauf, S.N, Blume, L.E. (eds.,). Economic growth (pp. 172–192). Palgrave Macmillan.
- Hanabusa, K. (2009). Causality relationship between the price of oil and economic growth in Japan. Energy Policy, 37(5), 1953–1957. https://doi.org/10.1016/j.enpol.2009.02.007
- He, W., Zhang, C., & Hao, R. (2015). Analysis of electricity price policy and economic growth. Journal of Scientific and Industrial Research, 74, 11–18.
- Inglesi-Lotz, R., & Pouris, A. (2016). On the causality and determinants of energy and electricity demand in South Africa: A review. Energy Sources, Part B: Economics, Planning, and Policy, 11(7), 626–636. https://doi.org/10.1080/15567249.2013.801536
- Iyke, B. N. (2015). Electricity consumption and economic growth in Nigeria: A revisit of the energy-growth debate. Energy Economics, 51, 166–176. https://doi.org/10.1016/j.eneco.2015.05.024
- Jajri, I., & Ismail, R. (2010). Impact of labour quality on labour productivity and economic growth. African Journal of Business Management, 4(4), 486–495.
- Kanu, S. I., & Ozurumba, B. A. (2014). Capital formation and economic growth in Nigeria. Global Journal of Human-Social Science: Economics, 14(4), 43–58.
- Khobai, H., Mugano, G., & Le Roux, P. (2017). The impact of electricity price on economic growth in South Africa. International Journal of Energy Economics and Policy, 7(1), 108–116.
- Kilian, L., & Hicks, B. (2013). Did unexpectedly strong economic growth cause the oil price shock of 2003–2008? Journal of Forecasting, 32(5), 385–394. https://doi.org/10.1002/for.2243
- Kirikkaleli, D., Adedoyin, F. F., & Bekun, F. V. (2021). Nuclear energy consumption and economic growth in the UK: Evidence from wavelet coherence approach. Journal of Public Affairs, 21(1), 21–30. https://doi.org/10.1002/pa.2130
- Klump, R., McAdam, P., & Willman, A. (2007). The long-term success of the neoclassical growth model. Oxford Review of Economic Policy, 23(1), 94–114. https://doi.org/10.1093/oxrep/grm003
- Korkmaz, S., & Korkmaz, O. (2017). The relationship between labor productivity and economic growth in OECD Countries. International Journal of Economics and Finance, 9(5), 71–76. https://doi.org/10.5539/ijef.v9n5p71
- Kumar, R. R., Stauvermann, P. J., Loganathan, N., & Kumar, R. D. (2015). Exploring the role of energy, trade and financial development in explaining economic growth in South Africa: A revisit. Renewable and Sustainable Energy Reviews, 52, 1300–1311. https://doi.org/10.1016/j.rser.2015.07.188
- Kümmel, R., Ayres, R. U., & Lindenberger, D. (2010). Thermodynamic laws, economic methods and the productive power of energy. Journal of Non-Equilibrium Thermodynamics, 35(2), 145–179. https://doi.org/10.1515/jnetdy.2010.009
- Kümmel, R., Henn, J., & Lindenberger, D. (2002). Capital, labor, energy and creativity: Modeling innovation diffusion. Structural Change and Economic Dynamics, 13(4), 415–433. https://doi.org/10.1016/S0954-349X(02)00008-5
- Kümmel, R., & Lindenberger, D. (2014). How energy conversion drives economic growth far from the equilibrium of neoclassical economics. New Journal of Physics, 16(12), 125008. https://iopscience.iop.org/article/10.1088/1367-2630/16/12/125008/pdf.
- Lean, H. H., & Smyth, R. (2010). Multivariate Granger causality between electricity generation, exports, prices and GDP in Malaysia. Energy, 35(9), 3640–3648. https://doi.org/10.1016/j.energy.2010.05.008
- Legoete, L. 2005. An evaluation, investigation and recording of the design and implementation of the cost-based tariff design training programme to align Eskom distribution for EDI restructuring [Doctoral dissertation]. University of KwaZulu-Natal.
- Letschert, V., Leventis, G., & Covary, T., & SEAD Incentives Working Group. (2013). Energy efficiency country study: Republic of South Africa. No. LBNL-6365E. Lawrence Berkeley National Lab (LBNL).
- Li, R., & Leung, G. C. (2021). The relationship between energy prices, economic growth and renewable energy consumption: Evidence from Europe. Energy Reports, 7, 1712–1719. https://doi.org/10.1016/j.egyr.2021.03.030
- Li, R., Wang, Q., Liu, Y., & Jiang, R. (2021). Per-capita carbon emissions in 147 countries: The effect of economic, energy, social, and trade structural changes. Sustainable Production and Consumption, 27, 1149–1164. https://doi.org/10.1016/j.spc.2021.02.031
- Lin, B., & Wesseh, P. K., Jr. (2014). Energy consumption and economic growth in South Africa reexamined: A nonparametric testing approach. Renewable and Sustainable Energy Reviews, 40(C), 840–850. https://doi.org/10.1016/j.rser.2014.08.005
- Lindenberger, D., & Kümmel, R. (2002). Energy-dependent production functions and the optimization model “PRISE” of price-induced sectoral evolution. International Journal of Applied Thermodynamics, 5(3), 101–108.
- Maré, D. C. (2004). What do endogenous growth models contribute? Development and comp systems 0412002. University Library of Munich.
- Matekenya, W. 2013. The impact of oil price volatility on economic growth in South Africa: A cointegration approach [Master’s thesis]. University of Fort Hare.
- Mazambani, F. R. 2015. The impact of electricity prices on economic growth: A case study of South Africa [Master’s thesis]. University of Fort Hare.
- Meyer, D. F., & Sanusi, K. A. (2019). A causality analysis of the relationships between gross fixed capital formation, economic growth and employment in South Africa. Studia Universitatis Babes-Bolyai Oeconomica, 64(1), 33–44. https://doi.org/10.2478/subboec-2019-0003
- Mohr, P. (2015). Economics for South African students (5th ed.). Van Schaik Publishers.
- Mongale, I. P. (2019). The Implications of labour productivity and labour costs on the South African economy. Journal of Reviews on Global Economics, 8, 1298–1307. https://doi.org/10.6000/1929-7092.2019.08.113
- Nkomo, J. C. (2006). Crude oil price movements and their impact on South Africa. Journal of Energy in Southern Africa, 17(4), 25–32. https://doi.org/10.17159/2413-3051/2006/v17i4a3196
- Nkoro, E., & Uko, A. K. (2016). Autoregressive Distributed Lag (ARDL) cointegration technique: Application and interpretation. Journal of Statistical and Econometric Methods, 5(4), 63–91.
- Nwakanma, P. C., & Ibe, R. C. (2014). Globalization and economic growth. An econometric dimension drawing evidence from Nigeria. International Review of Management and Business Research, 3(2), 771–778.
- Ogboru, I., Rivi, M. T., & Idisi, P. (2017). The impact of changes in crude oil prices on economic growth in Nigeria: 1986–2015. Journal of Economics and Sustainable Development, 8(12), 78–89.
- Onyinye, N. G., Idenyi, O. S., & Ifeyinwa, A. C. (2017). Effect of capital formation on economic growth in Nigeria. Asian Journal of Economics, Business and Accounting, 5(1), 1–16. https://doi.org/10.9734/AJEBA/2017/36075
- Oruoch, A. N. O. 2015. Financial aspects of stand-alone solar power systems in Sub-Saharan Africa [Doctoral dissertation]. University of Missouri-Kansas City.
- Pasara, M. T., & Garidzirai, R. (2020). Causality effects among gross capital formation, unemployment and economic growth in South Africa. Economies, 8(2), 26. accessed on 2 November 2020.
- Pesaran, M. H., Shin, Y., & Smith, R. J. (2001). Bounds testing approaches to the analysis of level relationships. Journal of Applied Econometrics, 16(3), 289–326. https://doi.org/10.1002/jae.616
- Polat, B. (2018). The impact of renewable and nonrenewable energy consumption on economic growth: A dynamic panel data approach. Asia-Pacific Journal of Accounting & Economics, 1–12.
- Rebelo, S. (1991). Long-run policy analysis and long-run growth. Journal of Political Economy, 99(3), 500–521. https://doi.org/10.1086/261764
- Romer, P. M. (1986). Increasing returns and long run growth. Journal of Political Economy, 94(5), 12–37. https://doi.org/10.1086/261420
- Romer, P. M. (1994). The origins of endogenous growth. Journal of Economic Perspectives, 8(1), 3–22. https://doi.org/10.1257/jep.8.1.3
- Sarwar, S., Chen, W., & Waheed, R. (2017). Electricity consumption, oil price and economic growth: Global perspective. Renewable and Sustainable Energy Reviews, 76(C), 9–18. https://doi.org/10.1016/j.rser.2017.03.063
- Sasana, H., & Ghozali, I. (2017). The impact of fossil and renewable energy consumption on the economic growth in Brazil, Russia, India, China and South Africa. International Journal of Energy Economics and Policy, 7(3), 194–200.
- Shahbaz, M., Hussain Shahzad, S. J., & Jammazi, R. 2016. Nexus between US energy sources and economic activity: Time-frequency and bootstrap rolling window causality analysis. MPRA Paper No. 68724. Munich Personal RePEc Archive.
- Shahbaz, M., Sarwar, S., Chen, W., & Malik, M. N. (2017). Dynamics of electricity consumption, oil price and economic growth: Global perspective. Energy Policy, 108(C), 256–270. https://doi.org/10.1016/j.enpol.2017.06.006
- Sharaf, M. F. (2016). Energy consumption and economic growth in Egypt: A disaggregated causality analysis with structural breaks. Topics in Middle Eastern and African Economies, 18(2), 61–86.
- Sibanda, K., Gonese, D., Mukarumbwa, P., & Hove-Sibanda, P. (2018). The impact of oil price on sectorial output in South Africa. International Journal of Sciences and Research, 74(4/1), 66–79.
- Sibanda, K., Mishi, S., & Tsegave, A. (2015). The impact of oil prices on sectorial employment in South Africa. International Business & Economics Research Journal (IBER), 14(2), 287–296. https://doi.org/10.19030/iber.v14i2.9165
- Smal, M. M., & De Jager, S. (2001). The monetary transmission mechanism in South Africa. South African Reserve Bank.
- Sodeyfi, S., & Katircioglu, S. (2016). Interactions between business conditions, economic growth and crude oil prices. Economic Research-Ekonomska Istraživanja, 29(1), 980–990. https://doi.org/10.1080/1331677X.2016.1235504
- Solow, R. M. (1956). A contribution to the theory of economic growth. Quarterly Journal of Economics, 70(1), 65–94. https://doi.org/10.2307/1884513
- Solow, R. M. (1999). Neoclassical growth theory. In J. B. Taylor & M. Woodford (Eds.), Handbook of macroeconomics (pp. 637–667). Elsevier.
- South African Market Insights (SAMI). 2018. South Africa’s crude oil imports from January 2018 to May 2018. https://www.southafricanmi.com/south-africas-crude-oil-imports-6jul2018.html (accessed on 08 November 2020)
- South African Reserve Bank (SARB). 2020. Annual report. https://www.resbank.co.za/en/home (accessed on 02 October 2020)
- Statistics South Africa (StatsSA). 2020. Quarterly economic report. http://www.statssa.gov.za (accessed on 02 October 2020)
- Thao, D. T., & Hua, Z. J. (2016). Impact of trade policy reform on Vietnam fisheries export. Journal of Economic and Sustainable Development, 7(10), 140–152.
- Usman, O., Olanipekun, I. O., Iorember, P. T., & Abu-Goodman, M. (2020). Modelling environmental degradation in South Africa: The effects of energy consumption, democracy, and globalization using innovation accounting tests. Environmental Science and Pollution Research, 27(8), 8334–8349. https://doi.org/10.1007/s11356-019-06687-6
- Van Eyden, R., Difeto, M., Gupta, R., & Wohar, M. E. (2019). Oil price volatility and economic growth: Evidence from advanced economies using more than a century’s data. Applied Energy, 233(1), 612–621. https://doi.org/10.1016/j.apenergy.2018.10.049
- Vermeulen, P. 2017. Global electricity disruption: The South African parallels. Paper presented at the 66th Annual Convention of the Association of Municipal Electricity Undertakings (AMEU). City Power Johannesburg. https://www.ee.co.za/wp-content/uploads/2017/11/Pages-from-AMEU-2017_-67-74.pdf (accessed on 2 November 2020).
- Wakeford, J. J. 2006. Risks to global trade and implications for South Africa’s economy and policy. Working Paper No. 06111. Cape Town: University of Cape Town.
- Wang, Q., Guo, J., & Li, R. (2022). Official development assistance and carbon emissions of recipient countries: A dynamic panel threshold analysis for low-and lower-middle-income countries. Sustainable Production and Consumption, 29, 158–170. https://doi.org/10.1016/j.spc.2021.09.015
- Wang, Q., Wang, X., & Li, R. (2022a). Does urbanization redefine the environmental Kuznets curve? An empirical analysis of 134 countries. Sustainable Cities and Society, 76, 103382. https://doi.org/10.1016/j.scs.2021.103382
- Wang, Q., Wang, L., & Li, R. (2022b). Renewable energy and economic growth revisited: The dual roles of resource dependence and anticorruption regulation. Journal of Cleaner Production, 337, 130514. https://doi.org/10.1016/j.jclepro.2022.130514
- Ye, Y., Koch, S. F., & Zhang, J. (2018). Determinants of household electricity consumption in South Africa. Energy Economics, 75, 120–133. https://doi.org/10.1016/j.eneco.2018.08.005
- Yoshino, N., & Taghizadeh-Hesary, F. (2015). Effectiveness of the easing of monetary policy in the Japanese economy, incorporating energy prices. Journal of Comparative Asian Development, 14(2), 227–248. https://doi.org/10.1080/15339114.2015.1059059
- Zulu, J. J., & Banda, B. M. (2015). The impact of labour productivity on economic growth: The case of Mauritius and South Africa. Southern African Journal of Policy and Development, 2(1), 6.