
 ?Mathematical formulae have been encoded as MathML and are displayed in this HTML version using MathJax in order to improve their display. Uncheck the box to turn MathJax off. This feature requires Javascript. Click on a formula to zoom.
Abstract
One of Ethiopia’s main challenges is increasing wheat production and productivity by designing and implementing an appropriate wheat policy. The country has a wheat supply and demand gap, forcing the country to spend a substantial amount of foreign currency for wheat imports, which are primarily derived from coffee and oilseed exports. The increasing imbalance between supply and demand for wheat presents serious policy issues. The purpose of this study was to evaluate the effects of wheat policy, and wheat processing industrial policy on wheat yield and production using Vector Error Correction (VEC) and Tobit models. The comparative use of both Tobit and vector error correction models enables useful critiques of the applicability of both models. The models’ results indicated that wheat policy had significant and positive effects on wheat yield and production. Importantly, the sign of the estimated coefficients is consistent across the models (i.e., Tobit and VEC models). More specifically, the estimated coefficients for technical change, market coordination, and integrated wheat policy interventions were positive, thereby confirming that the implementation of wheat policy interventions would significantly increase wheat production and productivity. Wheat yield and production were elastic due to policy interventions in the long run (i.e., elasticities values of wheat yield and output are greater than 1.00 unit). The results imply that wheat policy is important to increase wheat production and productivity by increasing the level of adoption of wheat technologies that shift from inelasticities to elasticities of wheat yield and production due to changes in the demand and price incentive in the long-run. The current supply-demand gap in wheat was 44%. In the long run, if the government implements the suggested wheat policy initiatives, this disparity might be decreased from 44 to 7%.
PUBLIC INTEREST STATEMENT
African countries require wheat policies to address input market and wheat output market failures by implementing proper wheat policy. Wheat policies are the primary causes of differences in wheat productivity and production. For example, the wheat policies cause significant differences in wheat production and productivity among the top three wheat-producing countries: Egypt, Ethiopia, and South Africa. This study proposes alternative policy options for government organizations, International Agricultural Organizations, International Agricultural Research Centers, and the Institute of Agricultural Research to develop and disseminate improved wheat varieties as well as improve low rates of technical knowledge usage. The outcomes of this study could also enable these various organizations to address poor input market coordination and weak systematic linkages in the wheat value chain. Implementing the wheat policies alongside the price support policies have direct significant effects on wheat productivity and production, indirect significant effects on the production and productivity of the wheat processing industry, and also close the wheat production and demand gap.
1. Introduction
Many Asian and Latin American countries have used various price support and stability policies to boost crop production and productivity while also improving social welfare since the 1960s. These measures hastened the adoption of Green Revolution innovations, which have resulted in higher crop productivity. In many developed countries, supported and stabilized domestic pricing policies had resulted in higher levels of crop production and productivity as well as a larger food supply than demand after World War II. Many poor African countries, on the other hand, relied on inadequate or little price support programs to manage agricultural productivity and price fluctuation, which resulted in low crop productivity growth and increased dependency on food imports. In Ethiopia, the lack of price support policies resulted in low crop productivity as well as social welfare for producers (Shikur, Citation2020).
In spite of the implementation of various agricultural policies, such as Structural Adjustment Programs, Industrial Policy, Growth and Transformation Plans in Ethiopia, the record of the past three decades with respect to wheat productivity has been unsatisfactory. Still, the nature and speed of agricultural productivity in particular wheat productivity in Ethiopia remain slower as compared to top wheat-producing countries, such as Egypt and South Africa (see, ). It has become clear that Ethiopian policy efforts were insufficient to increase wheat productivity further to level up with African and World averages. Egypt and South Africa have relatively better wheat policies to boost wheat productivity and create a competitive wheat market to ensure relatively higher prices and profitability which are discussed in Section 2.
Table 1. Wheat yield, production, and import in top wheat-producing countries in Africa, triennium ending (TE)
In general, only a few studies are focusing on the effect of agricultural policy on wheat yield and production in developing countries (Riethmuller & Roe, Citation1986; Yu et al., Citation2011). Specifically, several studies had investigated Ethiopian agricultural policy and its consequences on agricultural productivity and food security (Admassie, Citation2015; Alemu, Citation2010; Alemu et al., Citation2002;; Byerlee et al., Citation2006; Khairo et al., Citation2005; Rahmeto, Citation2008; Shikur, Citation2020). Empirical studies that focus on the effects of wheat policy and wheat processing industrial policy on wheat production and productivity are quite scarce. This study is one of the few that focuses on examining the effects of wheat policy options and wheat processing industrial policy on wheat production and productivity using time series data.
For numerous reasons, it is vital to study the effect of wheat policy on wheat production and productivity. As the African countries have been making efforts to increase wheat production and productivity by implementing a wheat policy which has been critical for achieving food security. The study has the potential to solve a significant issue in the context of African wheat sectors, particularly Ethiopian wheat sectors. The findings are significant in terms of their implications, as the African continent strives to reduce the gaps between wheat demand and supply, reduce the price of wheat, decrease the share of wheat import in the total domestic production and increase the wheat processing industries’ capacity utilization. The study explains why top wheat-producing countries’ wheat policy has succeeded and failed in the past to provide significant education and experience for designing and implementing successful wheat policy in Africa, particularly in Ethiopia.
Wheat processing industrial policy aimed at promoting new and existing wheat processing industries, and increasing their efficiency by increasing capacity utilization. However, one of Ethiopia’s main challenges is increasing wheat production and productivity by integrating wheat producers into the wheat value chain. The question of whether the wheat processing industrial policy affects wheat productivity in Ethiopia remains unsolved. The purpose of this study was to evaluate the effects of wheat policy, wheat processing industrial policy, demand and price of wheat on wheat yield and production. Do differences in wheat production and productivity derived from wheat policy differences? So, this study fills a limited knowledge of the Ethiopian wheat policy gap by assessing the effects of technical change and increased market coordination on wheat yield and production in Ethiopia.
The rest of this paper is structured as follows. The background is presented in the next section. Section 3 discusses the data sources and the econometric models that are employed in this study. The results of the analysis are discussed in Section 4. Conclusions and policy implications are presented in the final Section.
2. Backgrounds
Ethiopian wheat production accounts for roughly 20% of total African wheat production. Ethiopia is Africa’s second-largest wheat producer next to Egypt. Wheat production is a source of income for more than 30% of the country’s smallholder farmers (CSA (Central Statistical Agency of Ethiopia), Citation2014). Wheat is also a source of income and food for both urban and rural residents (Habte et al., Citation2020). Wheat and wheat products provide approximately 14% of the total calories consumed by Ethiopian people (FAO, Citation2014). However, there is a significant imbalance between wheat demand and supply, forcing the country to spend a substantial amount of foreign currency to import about 46 % of total domestic wheat production, which is primarily derived from coffee and oilseed exports. The main reasons for the large dependence on wheat import are inappropriate wheat policy, the expansion of wheat processing industries, population growth and the increased national income per capita at an average rate (Bergh et al., Citation2012; Habte et al., Citation2020).
Ethiopia, Egypt, and South Africa are the top wheat-producing countries in Africa, and they also import a substantial quantity of wheat. Egypt is the leading wheat-producing and importing country in Africa. Wheat yield per hectare is the highest in Egypt. The average wheat yield increased by 2.94 tonnes in 1961–1980 to 4.48 tonnes in 1981–2000 and 6.44 tonnes in 2000–2019 in Egypt due to wheat policy reform. This wheat policy reform has increased the adoption of the improved varieties, and modern agricultural techniques. The wheat yield was 6.50 tonnes in 2019 which was the highest among the top wheat-producing countries (). About 97% of the rise in wheat yield has been achieved through the adoption of new improved varieties, new production techniques, agricultural mechanization and modern irrigation techniques, and the remaining percentage increase in yield has been attributed to planting area expansion (Abdelmageed et al., Citation2019).
The largest amount of area cultivated is allocated for wheat production which is not a guarantee to reduce the wheat yield gap in Ethiopia (). The average wheat area cultivated increased from 1963 to 2019. clearly showed that Ethiopian wheat yield was the lowest among the top wheat-producing countries in Africa due to a lack of technical knowledge and information, and poor seeds/inputs delivery systems which resulted in a big wheat yield gap. For instance, model farmers under optimal circumstances could obtain up to 7 tonnes/ha, while the national average yield was about 2 tonnes/ha reflecting the existence of up to 350% yield gap in Ethiopia. The average wheat yield in Ethiopia increased from 1.21 tonnes/ha in 1981–2000 to 1.94 tonnes/ha in 2001–2019. The wheat yield was 2.97 tonnes in 2019, but there was still a large yield gap, about 261%. The considerable rise in wheat yield and domestic production did not support Ethiopia to reverse the increasing trend in wheat import. The average wheat import has significantly increased from 0.47 million metric tonnes in 1981–2000 to 1.20 million metric tonnes in 2001–2019. The big yield gap implies that Ethiopia has a huge potential to increase wheat production and decrease the share of wheat import in the domestic wheat supply by narrowing this wheat yield gap.
The main causes for differences in wheat productivity were wheat policies, and poor input market coordination (Hei et al., Citation2017; Shikur et al., Citation2020), absence of systematic linkages among wheat producers, wheat-producing factories and cooperative (Biggeri et al., Citation2018) and low rates of technical knowledge usages (World Bank, Citation2008). Wheat production and productivity are constrained by diseases, pests and climate variation (Tadesse, Bishawand et al., Citation2018), limited access to information, technical knowledge and agricultural technologies (Anteneh & Asrat, Citation2020). Weak coordination hinders wheat producers to achieve satisfactory quantity, and quality of wheat production (Biggeri et al., Citation2018). Failures in input coordination, such as information asymmetry and opportunistic behavior reduced wheat yield by 57% (Shikur et al., Citation2020). As a result, these multiple constraints resulted in the low adoption of wheat technologies.
The wheat policy creates substantial differences in wheat production and productivity in Egypt, Ethiopia and South Africa. Egypt’s wheat reform increased wheat production and productivity by doubling wheat areas and increasing wheat yield by 48% from 1986 to 1996. The reforms ensured a high relative wheat price and profitability, as well as promoted the adoption of heat, drought, and salinity tolerant wheat varieties. It has created a more liberal policy environment, allowing wheat producers to make crop planting decisions based on market forces, and subsidizing them to use modern technology and irrigation water for wheat production. It has also made local wheat markets more accessible to traders. Egyptian wheat procurement policy has enabled farmers now to earn prices that are somewhat comparable to wheat prices at or above world levels, resulting in improved social welfare for rural communities (Wally, Citation2017). The introduction of higher-yielding wheat varieties, as well as the greater profitability of wheat in comparison to competing crops, considerably increased local wheat production. Whereas, prior to 1986, the Egyptian government adopted a wheat quota that forced farmers to sell wheat for the government at fixed prices. Wheat producer prices were significantly taxed prior to the reforms.
In South Africa, the government had regulated the wheat markets along the wheat value chain to enhance domestic wheat producers’ competitiveness in terms of price in local and international wheat markets by the Wheat Board. Before 2002, the now-defunct Wheat Board was in charge of all market transactions, including wheat sales, pricing, distribution, storage, and bread and flour production. This wheat policy had a positive implication for the South African wheat productivity. The wheat area and annual wheat production fell significantly as a result of the wheat marketing board’s liberalization of the market and elimination of the set pricing structure. Unlike in the past, farmers in South Africa are no longer subsidized due to deregulation after 2002 (De Wet & Liebenberg, Citation2018). The government decreased the wheat import duty from USD 59.3 per tonne to USD 32.7 per tonne in 2017. The 45% reduction in wheat import duty was prompted by current worldwide market price hikes.
In Ethiopia, the wheat market was liberalized in favor of market-based resource allocation systems in 1991 due to the implementation of the Structural Adjustment Program. Fertilizer markets were liberalized to make it easier for fertilizers to be transferred from producers to farmers. Fertilizer prices were deregulated at both the wholesale and retail levels by the government. Input subsidies were eliminated in order to lower the government’s budget deficit. Due to the government’s continuing intervention in commodity and financial markets from 2000 to 2007, liberal input and product prices did not lead to a competitive market. Private fertilizer traders were forced to exit the fertilizer market in the year 2000. In 2005, Ethiopia’s government granted the Agricultural Input Supply Enterprise monopoly and monopsony powers over fertilizer procurement and delivery. Pesticides and herbicides were imported and supplied by this company as well as private firms.
In December 2006, the government attempted to lower wheat prices by prohibiting the export of wheat, allowing the import of wheat and distributing subsidized wheat to wheat processing factories (Habte et al., Citation2020). The overvalued exchange rate also keeps the price of imported wheat relatively low, making it more difficult for domestic producers to compete with wheat imports. Input market failures fail to deliver the proper quality and quantity of inputs to wheat producers at the right time, that has a direct negative impact on wheat productivity and production as well as a negative indirect impact on productivity and production of wheat processing industries (Habte et al., Citation2016). Because the cooperative failed to supply appropriate input, particularly pesticide and herbicide, input sellers acted opportunistically and employed asymmetric information of input quality at small shops and the spot market, resulting in a drop in wheat productivity (Habte et al., Citation2020). Due to a lack of appropriate wheat policy, market incentives and wheat technologies, over 80% of Ethiopia’s wheat is consumed on the farm.
Since 2003, the Ethiopian government has employed a wheat processing industrial policy to create backward and forward linkages between upstream and downstream actors in the wheat value chains (Shikur et al., Citation2020). Policy interventions in the wheat market facilitate the linkage between wheat producers and wheat processing factories and increases producers “market access and the bargaining powers of farmers. In the wheat value chain, the interventions have enabled wheat producers to produce high-quality wheat that will meet the expectations of wheat processing factories (Biggeri et al., Citation2018). The implementation of third-party quality certification has a significant and positive effect on agricultural productivity by improving market coordination (Shikur, Citation2021b). As indicated by Yu et al. (Citation2011), market coordination has a positive and significant effect on wheat yield and production, implying that favorable policy interventions increase wheat yield and production. Bernard et al. (Citation2017) asserted that third-party quality certification has a significant effect on farmers” prices, quality agricultural input utilization, and price transmission. Wheat prices have a favorable effect on wheat output and productivity, but a negative effect on wheat imports (Shikur et al., Citation2020; Thobani, Citation1979).
In order to double wheat yield in Ethiopia, certified seeds, agronomic techniques training, row planting, lower seed rating, fertilizers (e.g., Urea and DAP) and a guaranteed output market as packages were given to wheat producers by the government. However, the effect of the intervention on wheat yield among wheat producers was largely unknown due to the incomplete utilization of packages by many farmers. Even though interventions address many constraints encountered by wheat producers simultaneously; farmers who adopted complete packages could only increase wheat yield by about 14 % (Tadesse, Bernard et al., Citation2018). They concluded that without input support, the marketing aid intervention did not effect on wheat yields. The empirical results in Ethiopia showed that low-quality pesticides and herbicides utilization had decreased wheat yield by 57% which was ignored in packages of this intervention (Shikur, Citation2020). This review shows that differences in wheat production and productivity are derived from wheat policy differences. Therefore, in order to fill this scientific gap, it is important to investigate the effects of technical advancement and increased market coordination on wheat yield and production. As a result; the study’s scientific contribution to literature is the investigation of the wheat policy’s effect on wheat production and productivity.
Therefore, the effects of the chosen wheat policy initiatives are simulated in three scenarios. Scenario 1 considers the influence of increased technical changes, which are simulated by a 5% increase in efficiency or technology over time (i.e., the study assumes a 5% gain in efficiency divided by time change), ceteris paribus. Technical efficiency (change in wheat yield over time), which has been used as a proxy variable for technical change, reflects the technical change. The government may provide subsidies per unit of a variable input or yield per hectare (such as a new method of producing or superior production) that has the largest effect on wheat productivity and production (Colman & Young, Citation1998).
In scenario 2, a 3.5% increase in wheat production is simulated, based on the premise that favorable regulatory procedures will boost wheat production by 3.5% over time, lowering farmers’ usage of expired or adulterated pesticides and herbicides. To solve asymmetric information in wheat input markets, this study uses investment subsidies (e.g., subsidies for investments in technologies such as enhanced agricultural technology, laboratory tests, and/or third-party verification) and credit facilities as proxies for incentives. The analysis assumes that the federal and state governments will provide investment subsidies and soft credit (e.g., low-cost credit for the purchase of laboratory tests and inputs) to encourage cooperatives and private businesses to invest in laboratory testing and/or third-party verification services. By offering these services, market coordination difficulties (i.e., asymmetric information and opportunistic behavior) in wheat input and output markets could be alleviated (Shikur, Citation2021b; Wimmer & Chezum, Citation2003).
In scenario 3, the effects of the two policy interventions are combined and simulated if they are implemented at the same time. When all other conditions are held constant, the two policy initiatives are expected to enhance wheat productivity by around 5.7% over time. In Ethiopia, governmental actions are especially simulated to decrease huge yield gaps and enhance production. These interventions aim to reduce the gaps between wheat demand and production, reduce the price of wheat, decrease the share of wheat import in the total domestic production and increase the wheat processing industries’ capacity utilization.
3. Research methodology
3.1. Data
The data used in this study came from the FAOSTAT databases. Specifically, wheat yield, wheat output, wheat producer prices, per capita income, and population growth rate came from the FAOSTAT data sets. A historical baseline was used to evaluate the effects of wheat policy initiatives on wheat yield and production. The model is calibrated using annual data from 1993 to 2019, but because the wheat yield and wheat production equations have a lagged dependent variable, the year 1993 is excluded from the baseline data.
Since 2003, a wheat food processing industrial policy has been implemented using instruments such as investment incentives and export incentives to strengthen links between wheat industries, increase wheat product exports at the national level, and improve the wheat food processing industry’s working capacity (Habte et al., Citation2016). Wheat processing industrial policy was included in the models as a dummy variable to examine the impact of wheat processing industrial policy on wheat yield and production, which began in 2003 as part of the development strategy (Habte, Citation2017; Shikur, Citation2021a). Before 2003, the dummy variable had a value of 0, and it had a value of 1 after 2003. Wheat processing industrial policy entered the Vector error correction model (VECM) as the dummy variable as well as an exogenous variable because it is not stochastic.
Household wheat demand is primarily influenced by prices, size of population and per capita income (Shikur, Citation2021a). The demand for wheat is estimated as a function of price, per capita income, and population growth in this study. Wheat demand is written in Equationequation 1(1)
(1) as:
Where Qdt is the total wheat demand in each period, Pt is the price of wheat in each period, popgt is the population growth rate in each period, Yt/POPt is the income per capita of the country in each period, subscript t represents the year/period in Equationequation 1(1)
(1) .
3.2. Johansen and Juselius co-integration test
The Johansen co-integration test is a better approach to check the presence of a long-run relationship as compared with other approaches (Hallam & Zanoli, Citation1993). The Maximum Eigenvalue test and Trace test are useful tools to decide the number of long-run co-integration vectors (Johansen & Juselius, Citation1990). The Trace test executes a joint test, while the Maximum Eigenvalue test performs separate tests for the individual Eigenvalues. The result of the Trace statistic is more widely chosen than the Maximum Eigenvalue statistic test. If the Maximum Eigenvalue test and the Trace test approve the existence of the long-run equilibrium relationships between time-series data, the Vector Error Correction Model (VECM) can be used to evaluate the presence of wheat production and productivity responses in the short-run. The Maximum Eigenvalue statistic tests the null hypothesis of rank(r) co-integrating relations against the alternative of rank (r + 1) co-integrating relations for r = 0, 1, 2 … k-1. This test statistics is computed as:
Where denotes the estimated Maximum Eigenvalue, T denotes the sample size.
Trace statistics determine the null hypothesis of r co-integrating long-run relationships against the alternative of n co-integrating long-run relationships, where n is the number of variables in the system for r = 0, 1, 2 … k-1. It can be expressed as:
3.3. Vector error correction model
Vector error correction model (VECM) is used to estimate the effects of wheat policy and wheat processing industrial policy on wheat production and productivity which are considered one of the most powerful approaches as approved by Braulke (Citation1982). The VECM with co-integrating long-run relationships is a more influential approach to estimating wheat yield and production responses than that of the Nerlovian model as evidenced by Theil (Citation2002) and Mackay et al (1999). Firstly, VECM resolves the problem of the traditional Nerlovian model and estimates distinct short-run and long-run relationships (Hallam & Zanoli, Citation1993). Secondly, it overcomes restrictions on the short-run behavior of variables and captures the forward-looking behavior of producers optimizing their production in dynamic situations. Adjustment of wheat production response induced by deviations from the long-run equilibrium is assumed to be a continuous and linear function of the magnitude of the deviation from long-run equilibrium. Thus, even very small deviations from the long-run equilibrium will always lead to an adjustment process in wheat production. If time-series data are co-integrated, one can apply VECM to evaluate the short-run properties of the co-integrated series. The VECM provides a more functional theoretical framework to examine the wheat production response. A long-run relationship is established in Equationequation (3)(3)
(3) , then a single equation VECM for wheat yield and production responses that incorporate feedback from the long-run can be formulated. The VECM is then represented as:
Where Qt is the quantity of wheat production in period t; Yt denotes the quantity of wheat yield in the period t, SQit refers to the quantity of simulated wheat production in the period t, SYit represents the quantity of simulated wheat yield in period t. Qt-1 is the lagged wheat production in period t, Yt-1 is the lagged wheat yield at time t and Et is a vector of exogenous factors (demand, price, industrial policy) influencing wheat production and yield (i.e. shift factors) in the period t. Pit represents exogenous variables such as technical change and improved market coordination, ,
, and
are short-run coefficients,
is coefficient of industrial policy, n-1 is the optimal lag orders,
is the speed of adjustment parameter with a negative sign, because it measures the speed at which dependent variable returns to equilibrium after a change in independent variables,
, the error correction term is obtained from residuals of the regression of long-run Equationequations (4
(4)
(4) –Equation5
(5)
(5) ), The term error-correction describes the last period’s deviation from a long-run equilibrium that affects its short-run dynamics in the dependent variable. The short-run change in wheat production is a linear function of the deviation from the long-run equilibrium. The error correction model (ECM) depends on the behavioral assumption that two or more time-series data should have long-run equilibrium relationships that determine both short-run and long-run behavior. The sign ∆ denotes the difference operator; Dt is a vector of impulse response dummy that includes industrial policy.
3.4. Tobit model specifications
The Tobit model has been widely used in recent years for time series analysis. In Tobit analysis, the dependent variable is assumed to have a mixed distribution with a probability at zero and a continuous distribution for values greater than zero in this scenario. When the latent dependent variable’s value is missing (i.e., latent) and the non-zero values represent the observed dependent variable. Government choices whether to adopt a wheat policy with the price support and stabilization policies or not, decisions have a significant effect on agricultural production and productivity. If the government’s yes or no decision to implement the wheat policy affects wheat producers’ wheat production and productivity since the policy has significant effects on the adoption of quality and quantity of wheat technologies, thereby affecting aggregate wheat production and productivity. The following relationship can be used to express the stochastic model that underpins Tobit:
Where Qit is the quantity of wheat production and wheat yield in period t, Et is a vector of factors (demand, and wheat policy interventions) influencing wheat production and yield in period t. Policy interventions represent exogenous variables such as technical change and improved market coordination. β is a vector of unknown coefficients, N is the number of observations, and ɛt is an independently distributed error term assumed to be normal with zero mean and constant variance. Thus, the model assumes that there is an underlying, stochastic index equal to (Etβ + ɛt) which is observed only when it is positive, and hence qualifies as an unobserved, latent variable.
4. Results
4.1. Trend analysis of baseline and simulated wheat yields and production
showed the responses of wheat yield and production to the proposed policy interventions as absolute and percentage changes in endogenous variables from their baselines. That is, the impact of each scenario was calculated by comparing the values of endogenous variables after simulation with the simulated values for the base period. depicted the effects of improved input market coordination, and the improvement in technological changes (scenario 1) resulted in higher wheat yield and production. Keeping all other parameters unchanged, an improvement in technological modifications (scenario 1) would result in a 66.45% increase in wheat production, or around 1.49 million metric tonnes (MMT). This would result in a 61.92% increase in wheat output and a 1.40 tonnes/ha increase in wheat yield. Improvements in coordination failure (scenario 2) would boost wheat yield and production by 39.60% and 44.05%, respectively, on average. This would have a favorable impact on annual wheat production and consumption per capita. The simultaneous execution of the two initiatives () would increase wheat production by 1.80 MMT, on average. The simultaneous execution of the changes would raise wheat production by an average of 80.44%. Joint policy measures would account for about 77.67% of the increase in wheat yield. Simulating the effects of changes in technical progress and input market coordination could provide significant yield and production responses in wheat, as these services ensure high-quality inputs and the appropriate rates of technical knowledge application for wheat growers.
Table 2. Impacts of policy interventions on wheat yield and production
Despite the fact that wheat production has been increasing for the past two decades, it has not kept pace with rising demand due to inappropriate agricultural policy, and low technology adoption. showed the patterns in wheat yield and production through time for the baseline and each scenario. The differences in consequences among the policy interventions began to show more clearly in the first year (1993), and the impacts from a reduction in coordination failures remained relatively moderate throughout the simulation periods. Policy implementations have a long-term impact on wheat yield and production. Figures showed that implementing both interventions at the same time (scenario 3) have the greatest effect on wheat yield and production compared to other policy options (i.e., scenario 1 and scenario 2). The policy may not work effectively and efficiently if policy does not reward continuous incentives and profitability in the short-run. The farmers also have bad experiences and wrong attitudes to policy interventions and projects or programs; they might not adopt the recommendations/all components of agricultural technologies. For instance, the result from a randomized control trial indicated that farmers who adopted complete packages could only increase wheat yield by about 14 %. Although these interventions addressed many constraints encountered by wheat producers simultaneously, low-quality pesticides and herbicides utilization were not considered in packages of projects that had significant and negative effects on wheat yield (Shikur, Citation2020).
Figure 1. Wheat demand and baseline and simulated wheat production.
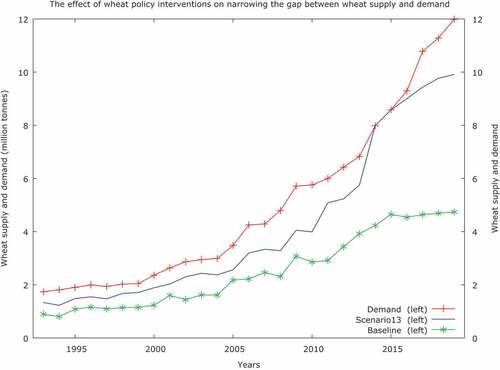
The wheat demand in has been trending higher, implying that it has increased from time to time due to the expansion of industries, population growth, and the dietary content of wheat products. As result, domestic wheat supply was insufficient to meet rising wheat demand over time. Ethiopia’s government has bought wheat from other countries to bridge the gap between wheat supply and demand. If government implements policy interventions gap in wheat and supply will be reduced by increasing wheat production that causes change in the wheat supply curve upward. For the years 1993 to 2019, as indicated in , the wheat policy has closed the gap between wheat supply and demand. showed that baseline wheat output was relatively low and consistent from 1993 to 2003, but after 2003, wheat production increased due to the implementation of the wheat processing policy.
Figure 2. Baseline and simulated wheat production.
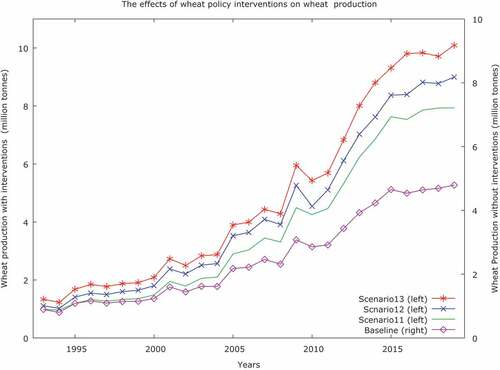
Figure 3. Baseline and simulated wheat yield.
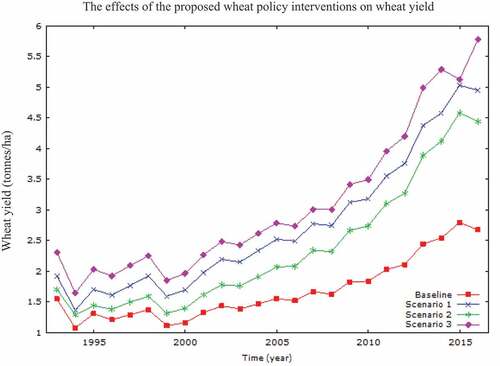
Wheat yield was disrupted and pushed upward as a result of policy actions (). These interventions were strongly linked to wheat yield, showing that policy interventions boosted wheat productivity.
4.2. Results of stationarity tests and Johansen co-integration test
The unit root test was carried out to check the existence of stationary before doing co-integration tests. The unit root test was conducted for each variable from 1993 to 2019. showed that all variables were non-stationary in their levels whereas all variables were stationary in their first differences.
Table 3. Augmented Dickey-Fuller test for the following variables with constant, and constant and trend
The Johansen test was used to determine whether the equations have long-run relationships in any VAR system. The results of the Johansen co-integration test confirmed the existence of the long-run relationships for all equations (). Identifying restrictions were assessed using the Likelihood ratio (LR) test of restrictions in order to determine the unique co-integrating vector that represents the numerous long-run relationships. Given the small sample sizes that the study dealt with the LR tests for co-integration based on asymptotic results and statistical inferences in finite samples may not be suitable (Cheung & Lai, Citation1993). The robustness of LR tests for finite samples is affected by sample size, the number of variables in the system as well as lag length (Reinsel & Ahn, Citation1988).
Table 4. Results of Johansen co-integration test
4.3. Results of long-run production response model and vector error correction model
The regression for the long-run has one lag, unrestricted intercepts and no trends in the VAR. This is obtained through the general to a specific approach. The price and demand elasticities of wheat yield and production are less than unit. The values of demand and price elasticities suggested that wheat yield and production were inelastic to changes in the demand and price incentive in the long-run.
Wheat yield and production are elastic due to policy interventions in the long run (i.e., elasticity values of wheat yield and output are greater than 1.00 unit; ). Wheat processing industrial policy has a significant and positive effect on wheat yield and production. The results imply that wheat policy is important to increase wheat production and productivity by increasing the level of adoption of wheat technologies that shift from inelasticities to elasticities of wheat yield and production due to changes in the demand and price incentive in the long-run. Similarly, Egypt’s wheat reform enhanced wheat production and productivity by doubling wheat areas and increasing wheat yield by 48% (Wally, Citation2017).
Table 5. Identified long-run relationships
The coefficients of lagged wheat yield and production in are −0.56 and −0.17, respectively, indicating that a 10% rise in lagged wheat yield and production would result in a 5.6% and 1.7% declines in wheat yield. Wheat demand has a negative and insignificant impact on wheat yield because subsidizing imported wheat has adverse effects on wheat productivity in the short run. Ethiopia’s government has sold subsidized imported wheat to wheat processing factories in order to fulfill growing wheat demand, which has an adverse effect on wheat production and productivity (Thobani, Citation1979; World Bank, Citation2018). Demand continues to surpass supply; and wheat self-sufficiency remains an issue as driven by rapid population growth with low agricultural technology adoption. According to the findings, wheat production did respond considerably and positively to producer price, as demonstrated by Riethmuller and Roe (Citation1986). demonstrated that a 10% increase in wheat producer price resulted in a 0.6% increase in wheat production and a 2.4% increase in wheat yield. Wheat yield was not significantly affected by wheat price. This finding was in line with the work of Krueger et al. (Citation1988). He claimed that agricultural productivity was unresponsive to incentives since the majority of farmers did not adopt agricultural technologies. Low-quality wheat seeds and low-quality chemicals could be the main causes of the insignificant effect. As a result, producers were unable to convert modern agricultural inputs into high wheat yield (Habte et al., Citation2020).
Table 6. Wheat yield and production responses
Although wheat processing companies buy subsidized imported wheat from the government, the wheat processing industrial policy increases the wheat demand and wheat prices, thereby requiring more farm technology to increase both wheat production and yield (Habte et al., Citation2016). Wheat processing industrial policy is one of the key drivers of wheat production and productivity by boosting the number of new and growing wheat processing industries (Habte et al., Citation2020). The right sign (i.e., negative) of the coefficient of the error correction term for wheat yield indicated that adjustments were being made to restore the long-run equilibrium. The coefficient of the error correction term for wheat output had the right sign (i.e., negative) and was significant at the 5% level, indicating that short-run wheat production was moving toward long-run equilibrium which was stable. The degree of correction of divergences from the long-run equilibrium was measured by the coefficient of the error correction term (−0.05). The numerical magnitude of the error correction term’s coefficient indicated that the adjustment to the long-run equilibrium was delayed.
The results in indicated that wheat yield and production responses were significantly and positively affected by the policy interventions at the 1% level of significance. The increases in the yield and production of wheat tended to be influenced more by technical changes and market coordination. Coefficients for technical change and improved market coordination in wheat yield and production were positive and significant, suggesting that favorable policy interventions increased wheat yield and production as evidenced by Lee and Helmberger (1985). Contrary to this finding, the effect of the intervention on wheat yield among wheat producers in Ethiopia was largely unknown due to the incomplete utilization of packages by many farmers. The finding of Yu et al. (Citation2011) was inconsistent with this finding. Particularly, they justified that agricultural support policies did not have a significant effect on wheat yield due to poor policy implementation.
Table 7. Impacts of policy interventions on wheat yield and production
The test of the endogenous variable, such as integrated wheat policy was perfectly collinear with both technical change and market coordination. Demand, technical change and market coordination were noncollinear variables. Therefore, the empirical analysis was extended further to test the effect of each wheat policy intervention on wheat production and productivity separately. Each wheat policy intervention was verified in the matrix to overcome the multicollinearity effect.
The results indicated that wheat yield and production responded significantly and positively to simultaneous implementation of the 2 interventions at the 1% level of significance. The improved market coordination improves the adoption of wheat technologies by delivering qualities and adequate quantities of pesticides, herbicides, fertilizers and improved wheat varieties. It reduces risks and uncertainty of input quality and quantity that have a negative effect on wheat production (Shikur, Citation2020). The asymmetric information on input quality has a negative effect on wheat production and productivity as well as profitability (Shikur, Citation2020; Shikur, Citation2021b).
4.4. Results of the Tobit model
The empirical analysis was extended further to test the effect of each wheat policy intervention on wheat production and productivity separately. Each wheat policy intervention is verified in the matrix to overcome the multicollinearity effect. displayed the Tobit model results showed the effect of each wheat policy intervention on wheat production and productivity.
Table 8. The effect of wheat policy interventions on wheat production
Table 9. The effect of wheat policy interventions on wheat productivity
The study observed differences in the magnitude of estimated coefficients between the results of the Tobit model and the VEC model were explained by different mechanisms. By and large, the estimates of coefficients for each wheat policy are reasonable and economically meaningful as the qualitative nature of the results are fairly the same over the models. Importantly, the sign of the estimated coefficients is consistent across the models (i.e., Tobit and VEC models). More specifically, the estimated coefficients for technical change, market coordination, and integrated wheat policy intervention are positive, thereby confirming that the implementation of wheat policy interventions would significantly increase wheat production and productivity. In terms of magnitude, the results showed that implementation of each wheat policy was expected to increase wheat production by 6.03, 9.36 and 8.56%, on average attributed respectively technical change, market coordination, and integrated wheat policy intervention. The results reported in showed that controlling for demand did not change the paper’s main findings. Since wheat policy interventions are a means to encourage the adoption of land-augmenting bio-chemical technology and strengthen the market coordination it can lead to an increase in productivity and thereby both reduce poverty and meet the growing demand for food.
This result suggests that the policy initiative aims to increase the productivity and profitability of wheat farms which are the key pathway out of poverty for many rural households (Collier & Dercon, Citation2014). The positive relationship between wheat productivity and wheat policy was in tandem with the findings of Lee and Helmberger (1985) and Walley (2017).
Going straight to the effect of market coordination, the estimated results showed that they were significantly and positively correlated with wheat productivity as reported in all models. Similarly, agricultural policies had increased crop productivity yields by sixfold in the last 40 years in East Asia, contributing to considerable reductions in poverty in China and other East Asian countries. Whereas, agricultural policies had failed to double crop productivity in Sub-Saharan Africa, resulting in lesser poverty reductions. Since insufficient or non-existent price support and stabilization programs to manage agricultural price uncertainty, which resulted in low crop productivity growth and increased dependency on food imports. In Ethiopia, the lack of price support measures resulted in low social welfare for producers (Shikur, Citation2020). Policies increase agricultural technology adoption and aggregate rural income. Negative effects can occur from the adoption of wheat technologies that undermine ecological services, for example, where pesticides deplete the natural enemies of crop pests. Adoption of wheat technologies increases income inequality among farmers as evidenced by several empirical literatures on the Green Revolutions. They revealed a significant bias favoring larger and wealthier farmers owing to their ability to optimize the diverse input combinations beyond the means of smaller and poorer ones.
5. Conclusions and policy implications
The empirical results provide important implications for policymakers who can use the findings of this study in their policies to increase tariffs for wheat import, stop selling subsidized imported wheat to wheat processing factories and scale up the adoption of modern technologies and provide and facilitate market coordination services. The result implies that a reduction in wheat imports, and improvement in input and output market coordination will lead to considerable increases in wheat productivity. Wheat processing industrial policy has a large and positive impact on wheat production and productivity, according to the findings. According to the findings of the study, the government should implement an effective wheat processing industrial policy in order to boost wheat production and productivity. Wheat processing industrial policy and wheat policy should be designed to complement one another in order to increase productivity in both sectors by connecting wheat producers to wheat processing enterprises.
At the 1% level of significance, the results showed that adoption of the technical technologies increased wheat yield and production significantly and positively. This study implies that wheat policy concerning technical changes could address wheat production constraints by easily accessing subsidized quality and adequate quantities of pesticides, herbicides, fertilizers, and wheat varieties. Input support policy also significantly accelerates wheat technology adoption resulting in positive implications for both wheat producers and consumers’ welfare. Therefore, it would be worthwhile for the Ethiopian government to put efforts to improve wheat yield further to level up with African and world averages by applying input support policy, and subsidizing/incentivizing wheat producers who adopt higher yield variety or full packages or who obtain higher wheat yield using technology. Market incentives play an important role in realizing the economic potential created by modern technology because they influence the producer’s technique choice. The results imply that wheat policy is important to increase wheat production and productivity by increasing the level of adoption of wheat technologies that shift from inelasticities to elasticities of wheat yield and production due to changes in the demand and price incentive in the long-run.
The wheat policy with respect to improved market coordination significantly increases wheat production and productivity by reducing weak wheat input market coordination that hinders wheat producers to achieve satisfactory quantity, and quality wheat technologies. This wheat policy could also address low wheat productivity which may be derived from wheat diseases and pests. The wheat policy could enable wheat producers to use high-quality pesticides and herbicides that effectively damage diseases and weeds, thereby increasing wheat production and productivity. Therefore, the government should implement regulations such as standardization, certification, labeling, guaranteeing and the third party to limit the opportunistic behaviors of sellers, and improve the farmers’ access to the quality of wheat output, seeds, pesticides and herbicides in wheat markets that have a positive and significant impact on wheat productivity and production. The wheat sector is made up of several interconnected sectors, which implies that failure in one sector leads to failure in another. If upstream actors fail to deliver the proper quality and quantity of inputs to wheat producers at the right time, they will be unable to deliver the quality and quantity of wheat requested in the downstream sector. This means that insufficient input supply in the input market has a direct negative impact on wheat productivity and supply, as well as a negative indirect impact on wheat product supply.
At the 1% level of significance, the results showed that simultaneous adoption of the two treatments significantly and positively increased wheat yield and production. If the two policy interventions are implemented at the same time, the gap between demand and production of wheat would be narrowed more than those realized from observed current practices; the increase in wheat production would be large enough to offset at least half of the annual wheat deficit estimated in this study, and the increase in wheat production would also decrease the shortage of wheat production faced by wheat processing industries. These findings suggest that by increasing wheat production, the two policy actions would improve producer and consumer welfare. The policy interventions may be applied in Ethiopia to optimize wheat productivity which is the most crucial way to reduce the growing dependency on wheat import and can be achieved through the use of new production techniques, and improved input and output market coordination.
Acknowledgements
The author would like to extend his deepest gratitude to two anonymous referees for their valuable comments and suggestions. My thanks also go to other people who helped me with this study.
Disclosure statement
No potential conflict of interest was reported by the author(s).
Additional information
Funding
Notes on contributors

Zewdie Habte Shikur
Zewdie Habte Shikur is a PhD Assistant Professor in the Department of Agricultural Economics. He is a senior lecturer and researcher at Wolaita Sodo University in Ethiopia. His primary research interests are in agricultural policies, transportation policies, industrial policies, trade, value chain analysis, transaction cost economics, economic growth, and financial development.
References
- Abdelmageed, K., Chang, X., Wang, D., Wang, Y., Yang, Y., Zhao, G., & Tao, Z. (2019). Evolution of varieties and development of production technology in Egypt wheat”, A review. Journal of Integrative Agriculture, 18(3), 483–20. https://doi.org/10.1016/S2095-3119(18)62053-2
- Admassie, A. (2015). “The political economy of food price policy in Ethiopia”. Oxford University Press Scholarship Online.
- Alemu, Z. G., Oosthuizen, L. K., & Van Schalkwyk, H. D. (2002). Agricultural development policies of Ethiopia since 1957. South Afr J Econ Hist, 17(1–2), 1–24. https://doi.org/10.1080/10113430209511142
- Alemu, D. (2010) The political economy of Ethiopian cereal seed systems: State control, market liberalisation and decentralisation. Working Paper 017, Brighton: Future Agricultures Consortium.
- Anteneh, A., & Asrat, D. (2020). Wheat production and marketing in Ethiopia. Review Study, Cogent Food & Agriculture, 6(1), 1778893. https://doi.org/10.1080/23311932.2020.1778893
- Bergh, K., Chew, A., Gugertyand, M. K., & Anderson, L. (2012)“Wheat value chain in Ethiopia: Study conducted for the agricultural policy team of the Bill & Melinda Gates foundation. EPAR Brief No. 204. University of Washington, Evans School Policy Analysis and Research (EPAR).
- Bernard, T., de Janvry, A., Mbaye, S., & Sadoulet, E. (2017). “Expected product market reforms and technology adoption by Senegalese onion producers. American Journal of Agricultural Economics, 99(4), 1096–1115.
- Biggeri, M., Burchi, F., Ciani, F., & Herrmann, R. (2018). Linking small-scale farmers to the durum wheat value chain in Ethiopia: Assessing the effects on production and wellbeing. Food Policy, 79, 77–91. https://doi.org/10.1016/j.foodpol.2018.06.00
- Braulke, M. (1982). A note on the Nerlove model of agricultural supply response. International Economic Review, 28(1), 241–246. https://doi.org/10.2307/2526474
- Byerlee, D., Spielman, D., Alemu, D., & Gautam, M. (August 2006) Policies to promote cereal intensification in Ethiopia: Help or hindrance? In: Paper presented at the international association of agricultural economics (IAAE) meeting, Gold Coast, Qld, International Food Policy Research Institute.
- Cheung, Y. W., & Lai, K. S. (1993). Finite-sample sizes of Johansen’s likelihood ratio tests for cointegration. Oxford Bulletin of Economics and Statistics, 55(3), 313–328. https://doi.org/10.1111/j.1468-0084.1993.mp55003003.x
- Collier, P., & Dercon, S. (2014). African agriculture in 50 years: Smallholders in a rapidly changing world? World Development, 63(2014), 92–101. https://doi.org/10.1016/j.worlddev.2013.10.001
- Colman, D., & Young, T. (1998). Principles of agricultural economics: Markets and prices in less developed countries. Cambridge University Press.
- CSA (Central Statistical Agency of Ethiopia). (2014). Agricultural sample survey report on area and production of major crops. In Statistical bulletin(532). Vol. VI.
- De Wet, F., & Liebenberg, I. (2018). Food security, wheat production and policy in South Africa: Reflections on food sustainability and challenges for a market economy. The Journal for Transdisciplinary Research in Southern Africa, 14(1), a407. https://doi.org/10.4102/td.v14i1.407
- FAO. (2014). Food balance sheets.
- Habte, Z., Legesse, B., Haji, J., & Jaleta, M. (2016). Supply analysis in wheat industries of Ethiopia. In Proceedings of African Association of Agricultural Economists (AAAE), 2016 Fifth International Conference, September 23-26, 2016, Addis Ababa, Ethiopia, African Association of Agricultural Economists.
- Habte, Z. (2017). Sector linkages and industrial policy effects on regional wheat value chain actors’ outputs and consumption in Ethiopia. Journal of Poverty, Investment and Development, 39(2017), 35–41.
- Habte, Z., Legesse, B., Haji, J., & Jaleta, M. (2020). Determinants of supply in the wheat value chain of Ethiopia. Eastern Africa Social Science Research Review, 36(1), 19–36. https://doi.org/10.1353/eas.2020.0002
- Hallam, D., & Zanoli, R. (1993). Error correction models of agricultural supply response. European Review of Agricultural Economics, 20(2), 151–66. https://doi.org/10.1093/ERAE/20.2.151
- Hei, N., Shimelis, H. A., & Laing, M. (2017). Appraisal of farmers wheat production constraints and breeding priorities in rust prone agro-ecologies of Ethiopia. African Journal of Agricultural Research, 12(12), 944–952. https://doi.org/10.5897/AJAR2016.11518
- Johansen, S., & Juselius, K. (1990). Maximum likelihood estimation and inference on co-integration with application to the demand for money. Oxford Bulletin of Economics and Statistics, 52(2), 169–210. https://doi.org/10.1111/j.1468-0084.1990.mp52002003.x
- Khairo, S. A., Battese, G. E., & Mullen, J. D. (2005). Agriculture, food insecurity and agricultural policy in Ethiopia. Outlook Agric, 34(2), 77–82. https://doi.org/10.5367/0000000054224300
- Krueger, A. O., Schiff, M., & Valdés, A. (1988). Agricultural incentives in developing countries: measuring effects of sectoral and economy wide policies. World Bank Economic Review, 2(3), 255–271. https://doi.org/10.1093/wber/2.3.255
- Rahmeto, D. (2008). Agriculture policy review. In T. Tesfaye (Ed.), Digest of Ethiopia’s national policies, strategies and programs (pp. 129–152). FSS.
- Reinsel, G. C., & Ahn, S. K. (1988) “Asymptotic properties of the likelihood ratio test for co-integration in the non-stationarity vector autoregression model,” Technical Report, Department of Statistics, University of Wisconsin.
- Riethmuller, P., & Roe, T. (1986). Government intervention in commodity markets: The Case of Japanese rice and wheat policy. Journal of Policy Modeling, 8(3), 327–349. https://doi.org/10.1016/0161-8938(86)90017-7
- Shikur, Z. H. (2020). Agricultural policies, agricultural production and rural households’ welfare in Ethiopia. Economic Structures, 9(2020), 50. https://doi.org/10.1186/s40008-020-00228-y
- Shikur, Z. H., Legesse, B., Haji, J., & Jelata, M. (2020). Governance structures and incentives in the wheat value chain in Ethiopia. African Journal of Agricultural and Resource Economics, African Association of Agricultural Economists, 15(2), 157–176. https://doi.org/10.17306/J.JARD.2021.01396
- Shikur, Z. H. (2021a). Potato and tomato supply and yield responses to policy in Ethiopia. African Journal of Economic Review, 9(4), 45–63. https://doi.org/10.22004/ag.econ.315814
- Shikur, Z. (2021b). Governance structures in wheat supply chains and their impacts on productivity and profitability of wheat producers in Ethiopia. Journal of Agribusiness and Rural Development, 60(2), 203–212. https://doi.org/10.17306/J.JARD.2021.01396
- Tadesse, G. A., Bernard, T., & Minot, N. (2018). The impact of the use of new technologies on farmers’ wheat yield in Ethiopia: Evidence from a randomized control trial. Agricultural Economics, 49(2018), 409–421. https://doi.org/10.1111/agec.12425
- Tadesse, W., Bishawand, Z., & Assefa, S. (2018). Wheat production and breeding in Sub-Saharan Africa challenges and opportunities in the face of climate change. International Journal of Climate Change Strategies and Management, 11(5), 696–715. https://doi.org/10.1108/IJCCSM-02-2018-0015
- Theil, R. (2002) “Price incentives, non-price factors and agricultural production in Sub-Saharan Africa: A co-integration analysis,” Working Paper No. 1112, Kiel Institute for World Economics.
- Thobani, M. (1979). The effect of a change in wheat prices on incomes. The Pakistan Development Review, 18(4), 283–312. https://doi.org/10.30541/v18i4pp.283-312
- Wally, A. (2017). Egypt’s local wheat procurement policy increase farmers profits. United States Department of Agriculture (USDA), Foreign Agricultural Service. Global Agricultural Information Service.
- Wimmer, B. S., & Chezum, B. (2003). An empirical examination of quality certification in a ‘lemons’ market. Economic Inquiry, 41(2), 279–291. https://doi.org/10.1093/ei/cbg007
- World Bank. (2008) “World development report: agriculture for development.”
- World Bank. (2018) . Cereal market performance in Ethiopia: Policy implications for improving investments in maize and wheat value chains (English).
- Yu, B., Liu, F., & You, L. (2011). Dynamic agricultural supply response under economic transformation: A case study of Henan,China. American Journal of Agricultural Economics, 94(2), 370–376. https://doi.org/10.1093/ajae/aar114