
 ?Mathematical formulae have been encoded as MathML and are displayed in this HTML version using MathJax in order to improve their display. Uncheck the box to turn MathJax off. This feature requires Javascript. Click on a formula to zoom.
Abstract
In recent years, a vast literature has appeared on the relationship between fiscal policy and long-run economic growth. With the aim to give an overview of the recent discussion and establish a point of departure for future research, this study used time series techniques and rigor empirical model to investigate the link between various components of fiscal policy on Ethiopia’s economic growth on annual data for 35 years. It employed the autoregressive distributed lag estimation technique. Results from the bound tests showed that there was a long-run relationship between the variables. Disaggregating government expenditure into productive and unproductive and tax revenue into distortionary and non-distortionary, this study found unproductive expenditure and non-distortionary tax revenue to be neutral to growth as predicted by economic theory. Moreover, productive expenditure has a positive effect on growth while there was evidence of distortionary effects on growth of distortionary taxes. These results give the right signal topolicymakers in Ethiopia in formulating expenditure and tax policies to ensure unproductive expenditures are reduced while at the same time boosting public investment. Furthermore, there is need to encourage private investment in the country.
1. Introduction
Fiscal policy is the instrument by which a government regulates its level of spending to control and affect a nation’s economy. Fiscal policy is commonly understood to be related with growth, or more precisely, it is held that correct fiscal measures in specific conditions can be used to stimulate economic growth and development (Khosravi & Karimi, Citation2010). Proponents of government intervention in economic activity maintain that such intervention can facilitate long term growth. They mention the government’s role in maintaining efficiency in resource allocation, regulation of markets, stabilization of the economy, and harmonization of social conflicts as some of the ways in which government could spur economic growth. In the context of endogenous growth, government's role in boosting the accumulation of knowledge, research, and development, productive public investment, human capital development, law, and order can achieve growth both in the short-term and long-run (Osuala and Jones (Citation2014), Success et al. (Citation2012), Okafor (Citation2012), and Rena (Citation2011)). Opponents of government intervention hold the view that government actions are naturally inflexible and inefficient and therefore stifle rather than promote growth. It appears then that as to whether the government’s fiscal policy fuels or retards growth remains an empirical question. Despite that, the current empirical findings are varied, with some researchers finding the relationship between fiscal policy and growth either positive, negative, or indeterminate.
Nations device wide range of strategies directed towardsachieving distinctive national goals. The economic reform agenda of the current government of Ethiopia is one such step. Over the last decade, the average annual gross domestic product (GDP) growth has been 10.6%, which is, double the average in the rest of Sub Saharan Africa. The general government budget deficit extended only marginally (by 0.2 percentage point) to an approximation of 2.8 percent of GDP. At the same time, government enterprises persisted to borrow heavily to finance their accelerated investment plans. As a result, their financing needs increased to 7.4 percent of GDP, while public and publicly-guaranteed debt reached an estimated 50 percent of GDP in June 2015 (IMF, Citation2016). The rise in need for the public investment and neglect of this issue over the last generation has left Ethiopia with a critical infrastructure deficit. The result of such declining and insufficient investments has been a worsening infrastructure deficit and mounting investment needs. According to the overall competitiveness index in the 2013 to 2014 Global Competitiveness Report Ethiopia ranked just 124th among 148 countries in terms of infrastructure (World Economic Forum, Citation2013). In recent years the increment in public infrastructure in Ethiopia is quite impressive.
While on the other side, endogenous growth model by Barro (Citation1990), Lucas (Citation1988) and King and Rebelo (Citation1990) showed that physical and human capital do impact economic growth but fiscal policy instruments such as distortionary taxation and productive expenditure affect both the output level and its steady state growth rate. Series of studies like Barro and Sala-I-Martin (Citation1992), Barro & Sala-i-Martin (Citation2004); (Barro & Sala-I-Martin, Citation1995), Jones et al. (Citation1993), Easterly and Rebelo (Citation1993), and (Stokey and Rebelo, Citation1995) have investigated the endogenous growth model and also discussed the condition under which fiscal policy variables can influence economic growth.
Public investments makes substantial contributions in terms of economic growth, productivity improvement, employment, trade competitiveness, environmental sustainability and people’s safety (Zhang etal., Citation2011; Agenor, Citation2007; Heintz et al, Citation2009; Rioja, Citation2001). Thus far, very few studies have assessed the impact of fiscal policy on economic growth in Ethiopia. For instance, a research by Mohammed and Asfaw (Citation2014) in Ethiopia titled as government spending for economic growth in Ethiopia Co-integration error correction model using a time series data for the period 1975–2011. The finding of this research showed that expenditure on health and total capital expenditure is both positive and statistically significant in explain the growth of Ethiopian economy. However, Expenditure on agriculture, education, health, transport and communication, urban development and housing, and total recurrent expenditure are statistically insignificant. He used expenditure on education, health, agriculture, transport and housing as sectorial and he also used capital and recurrent expenditures as explanatory which may also incorporate the above sectors and has double counting and this may be the cause of his insignificant finding of expenditure on growth for most of his explanatory variables.
Furthermore, study by Reda (Citation2021) on Impact of government Sectoral Spending on Economic growth in Ethiopia found that education sector expenditure has both short-run and long-run statistically positive-significant effect on growth while health sector spending have negative insignificant relation. A study done by Teshome in Ethiopia on “The Impact of Government spending on Economic Growth” in 2006 using Johanson Maximum Likelihood Estimation found that expenditure on human capital have long-run significant positive impact and government spending displays a negative but insignificant impact on growth of real GDP, which according to the researcher reveals the inefficiency and poor quality nature of public investment. His study also indicates in the short run, all components of government expenditure do not have significant meaning in explaining economic growth. The descriptive and qualitative analysis of the study investigates that the limited revenue buoyancy, unreliable source of financing, imprudent fiscal policy (particularly in the Derg regime) and capacity deficiency have limited the role of government expenditure, as fiscal instrument, in stimulating economic growth.
Most of the studies have either analyzed the impact of government expenditure or taxation or aggregate public investment on economic growth. This confirmed that previous studies in Ethiopia focused on investigating the impacts of aggregate fiscal policy instruments without categorizing into components of fiscal policy variables.
Furthermore, this study attempts to fill the gap of empirical studies in Ethiopia on the area of fiscal policy on following aspects; this study introduces disaggregated effects of various fiscal policy instruments on Ethiopia’s economic growth. The purpose of this study is to contribute to the literature by investigating the impacts of fiscal policy on economic growth in Ethiopia. This study considered the effects that various form of public expenditure and taxation has on Ethiopian economic growth. Nature of tax regime can spur or deter economic growth as it is suggested by economic theory. A regime that causes distortions to private agents’ investment incentives can impede investment and growth. Analogously, if the regime is such that it leads to internalization of externalities by private agents, it may induce efficiency in resource allocation and thus foster investment and growth. The same applies with the nature of government expenditure: excessive spending on consumption at the expense of investment is likely to deter growth and vice versa. Barro (Citation1990) and Kneller et al. (Citation1999) offer a theoretical foundation for, as well as empirical confirmation of, the favorable effect of productive government expenditure and the harmful effect of taxation. This study predicts theoretical model based on these two papers. Government expenditure is disaggregated into productive and unproductive while tax revenue is decomposed into distortionary and non-distortionary categories. A prediction of endogenous growth models is going to be tested with respect to the effect of instruments of fiscal policy on economic growth in Ethiopia. Specifically, test is conducted on the theoretical hypothesis that unproductive expenditure and non -distortionary taxes have neutral effects on long run growth and therefore can be eliminated from the growth model without loss of useful information and eliminating these variables improves the precision of parameter estimates of the remaining variables. Then applying the condensed model to estimate and analyze the effects of fiscal policy on growth in Ethiopia. In empirical investigation of the theoretical model for 22 OECD countries, Kneller et al. (Citation1999) used longitudinal data estimation technique to prove Barro’s (Citation1990) theoretical model. This study employs time series techniques on annual time series data for Ethiopia.
This study is organized as follows: Section 2 presents a discussion on trends of public finance in Ethiopia. In Section 3, the theoretical issues and econometric models are discussed, while the description of variables and empirical techniques is given in Section 4. Section 5 presents and discussion of the results of the, while Section 6 gives conclusion of the study.
2. Trends in public finance in Ethiopia
Total government showed continuous rise in last decades in which at some cases an increase more than two-fold, from ETB 163 billion in 2012/13 to about ETB 334 billion in 2016/17, indicating an annual average growth rate of 17 per cent. The largest share of the public spending has been going to public investments, predominantly envisioned to support inclusive and equitable development. This reveals the government’s strong commitment to boost and advance Ethiopia’s social and economic infrastructure and build the nation’s productive capacity. In terms of allocation of expenditure across the broad categories, on average, the largest share of the national expenditure between 2002/03 and 2019/20 was allocated to finance economic development, followed by social services, and finally administrative and general services. Ethiopia’s general government total expenditure was 18.5 per cent of GDP in 2016/17 MoFED (Citation2014). The fiscal deficit of 2.0 percent of GDP after 2012/13 was kept at a low level due to government’s careful fiscal management. Ethiopia’s public finance management can be characterized as having been prudent: it has kept the budget deficit low, while scaling up expenditures on critical sectors of the economy, particularly infrastructure and pro-poor sectors. Public resource mobilization and investment have increased significantly over the past years. Resource mobilization has been largely domestic-focused and supported by measures taken to improve the tax administration MoF (2019).
below clearly indicates that there is a surplus of government expenditure over revenue, which results in huge budget deficit. As MoFED (Citation2013) represented, shows that the budget deficit has also remained substantial even after the introduction of various reform programs during 1992/93. In clear and simple words, total revenue and expenditure are growing. On the other hand, the increase in latter is much higher than that of the former one and this has created the budget deficit to be widened over time. By and large fiscal situation of Ethiopia is influenced by its ability to mobilized revenues, whether conditions, external factors (donors‟ response). The deficit shows the country’s reliance on external resources (Tadesse, Citation2011).
Figure 1. Government revenue expenditure and budget deficit (in millions of birr) and as share of GDP.
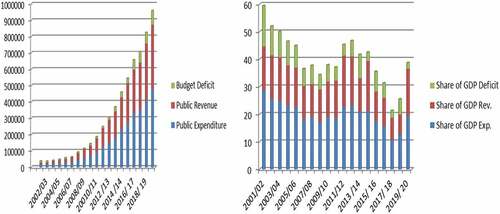
It is clearly observed in figures below reveals that both government revenue and expenditure show rising trends. Even though there is an increasing trend in government revenue, the size of budget deficit has been growing. This rise is attributed to diverse factors like narrow tax base, misuse of resources (Corruption) with respect to revenue collection, lengthy but ineffective bureaucracy of public administration which gave rise to expenditure, etc.
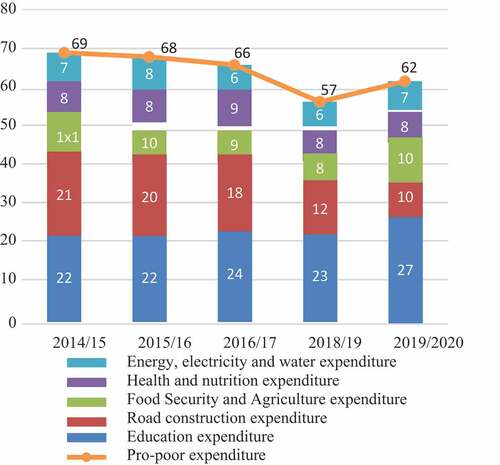
As it is shown in above government’s a firm determination to educational development is mirrored in expenditure allocated to the sector, which has improved increasingly since 2019/20 to reach 27 per cent of total government expenditure in 2019/20.Agriculture and food security as well as road construction each took 10 per cent of national expenditure at the same years. This trends of public expenditure confirm that productive component of fiscal policy i.e government expenditure is higher which has positive implications in raising economic growth and contribute to economic prosperity.
Figure 2. Productive expenditure.
3. Theoretical consideration and model
The empirical framework for this study involves model to assess the impact of fiscal policy on economic growth in Ethiopia. The study includes two additional variables (growth of productive and non-productive expenditures) in order to investigate their impacts on the economic growth. It is essential to identify their relationship since both types of expenditures contributes to the level of budget deficit. The productive consumption expenditures include components listed by Ministry of Finance as part of recurrent expenditures such as; agriculture and rural development; trade and industry; transport; education; health as well as housing. For the moment, the non-productive expenditures are denoting here lump-sum payment paid by the government such as subsidies. Again, theoretical classification of fiscal policy instruments includes the distortionary taxation which includes current taxes on income, wealth, capital taxes, actual social contributions and additionally non-distortionary taxation which is taxes on production and imports.
According to endogenous growth theory, both the level and growth rate of per capita output can be affected by fiscal policy variables. An exhaustive demonstrations of the mechanism through which fiscal policy affects growth can be found in, amongst others, Barro (Citation1990) and Barro and Sala-I-Martin (Citation1992, Citation1995). These authors apply a Cobb-Douglas-type production function with government provided goods and services (g) as an input to indicate the positive effect of productive government spending and the adverse effects associated with distortionary taxes. Then the resulting production function, in per capita terms, can be given as follows;
Where output is per capita,
is per capita private capital and A is a residual commonly known as total factor productivity. Assuming government balances its budget in each period by increasing a proportionate tax on output at rate (
) and lump-sum taxes (L), the government budget constraint can be expressed as,
Where is the number of firms in the economy and
is government consumption, which is supposed to be unproductive. In theory, a proportionate tax on output influences private incentives to invest, but a lump sum tax does not. In relation to a stated utility function, Barro (Citation1990) and Barro and Sala-I-Martin (Citation1992) develop the long run growth rate (
) in this model as,
Where and μ represent parameters in the expected utility function. From (3), it is clear that the growth rate is a decreasing function of distortionary tax rate
and increasing function of productive government expenditure
. It is also obvious that rate of growth is not affected by both non-distortionary taxes
and unproductive government expenditure
. The above condition supposes the government balances its budget each period, an assumption that is implausible to hold in reality especially in the less developed countries. This study uses theoretical model developed by Kneller et al. (Citation1999) and Bleaney et al. (Citation2000) in which they take a more realistic insight by supposing a non-balancing government budget constraint in some periods. Considering this into account, by rearranging (3) to get the following expression.
Where denotes government budget deficit/surplus in a given period. As
is productive, its expected sign is positive, but
is negative as it distorts incentives of private agents. Both
and
are hypothesized to have zero effects on growth. Similarly, the effect of
is expected to be zero as long as Ricardian equivalence holds, but may be non-zero otherwise Bleaney et al., Citation2000.Furthermore growth is identified by equation as of Kneller et al. (Citation1999) by taking into account both fiscal (xit) and non-fiscal (zit) variables so that the growth equation becomes,
Where yt is the growth rate of output per capita, x is the vector of fiscal variables, z is the vector of nonfiscal variables, and is white noise error term. In theory, if the budget constraint is fully specified, then
because expenditures must balance revenues. To correct this problem, there is a need to omit at least one element of x (say xm) to avoid perfect collinearity (Kneller et al., Citation1999). As expected, the omitted element must be that which theory put forward has neutral effect on growth, for to select any other would introduce substantial bias in parameter estimates. Consequently, rearranging (5) in the following form.
From (6), it is possible to omit xmt to get our final growth equation given below.
The growth equation denoted by (7), as specified in Kneller et al. (Citation1999), constitutes the model to be estimated. Specified in this way, the analysis of the coefficients of fiscal variables should be seen in terms of implied financing. That is, test is conducted on the null hypothesis that (γj- γm) = 0 instead of the conventional null that γj = 0. Accordingly, the investigation of the coefficient of fiscal variables is the “effect of a unit change in the significant variable offset by a unit change in the element omitted from the regression” (Kneller et al., Citation1999: 175). If the null is rejected, more precise parameter estimates can be obtained if the neutral elements are eliminated from the model (i.e. (i.e. γm = 0 (γj- γm) = 0 = γj.
4. Methodology and data
4.1. Estimation technique
Here empirical analysis of fiscal policy and growth is formulated by an autoregressive distributed lag (ADL) model. An ADL model is chosen over a static one is motivated by the requisite to capture the entire dynamic responses in the dependent variable brought about by changes in its own lags and the simultaneous and lagged values of the other explanatory variables. In addition, an ADL model is more applicable to small samples like in this study which is 35 years 1985–2019. Beginning by directly estimating a static long run equation may fail to capture any instantaneous, short run, and long run responses in the system thus generating inaccurate coefficient estimates Banerjee et al (Citation1993), Wojciech and Derek (Citation1997), and Wojciech and Derek (Citation1997). Estimating the model in this method gives valid t-statistics even when some of the right hand variables are endogenous (Enders, Citation1995). This study conducted The ARDL method in two steps (Pesaran & Shin, Citation1997) such that in the first step, Test of no cointegration hypothesis is done. The method applies the F-test, even if the asymptotic distribution of the F-statistic in this setting is non-standard irrespective of whether the variables are I(0) or I(1). The critical values as given by Pesaran and Shin (Citation1997) would have been used, but this study used those provided by Narayan (Citation2004), due to their suitability for small samples (Boakye, Citation2008). Two sets of values are tabulated. First it is assumed that all the variables are I(1) and the second that they are I(0). This group permits for the fact that variables may be stationary, integrated of order one, or even fractionally integrated. In this case, when the estimated F-statistic is above the upper value of this band, the null hypothesis will be rejected, showing cointegration between the variables irrespective of whether they are I(1) or I(0). If the F-statistic found below the band, then the null hypothesis of no cointegration cannot be rejected. A value inside the band implies the test is indecisive.
The second step involves estimation using the ARDL method for the long and short-run parameters. In this procedure, cointegration relationship was estimated by OLS once the lag order of the model was identified. Thus, once cointegration was established, the conditional ARDL (p, q1, q2, q3, q4, q5, q6, q7, q8) long-run model for Yt in equation estimated as:
The long run ARDL (p, q1, q2, q3, q4, q5, q6, q7, q8) model for Yt:
Where p, q1, q2, q3, q4, q5, q6, q7, q8 are the lag lengths for each of the variables.
Again, the short run error correction model specified as:
Where are the short-run dynamic coefficients of the model’s convergence to equilibrium, and π is the speed of adjustment to long-run equilibrium following a shock to the system.
4.2. Data description
The non-Fiscal variables included in the estimation of Fiscal Policy and Economic growth are Real GDP, labor force, School enrollment, AID Nominal receipts from abroad in the form of grants (share of GDP) and its expected impact is positive or negative depending on its usage by the government and on existence or otherwise of other supporting policies. The explanation of the data is presented in below.
Table 1. Diagnostic test for fiscal policy and economic growth model
5. Results and discussion
5.1. Stability and diagnostic test
Diagnostic check is undertaken in order to determine consistency of the estimated long-run model which essential to know the standard property of the model. Hence, this study conducted the model stability and diagnostic checking which comprised of Serial correlation test (Brush & Godfray LM test), Functional form (Ramsey’s RESET) test, Normality (Jaque-Bera test), and Heteroscedasticity test. Additionally, stability of the long run estimates is tested by applying the cumulative sum of recursive residuals (CUSUM) and the cumulative sum of squares of recursive residuals (CUSUMSQ) test. These tests are suggested by Pesaran et al. (Citation2001). In decision to accept or reject the null hypothesis, the p-values related to the test statistics are taken into consideration. The model passed all the diagnostic tests against serial correlation (Durbin Watson test and Breusch-Godfrey test), heteroscedasticity (White Heteroskedasticity Test), and normality of errors (Jarque-Bera test). The Ramsey RESET test also shows that the model is well specified.
indicates that the long-run ARDL model estimated in this study passes all the diagnostic tests. This is due to the p-value associated with both the LM version and the F version of the statistic was unable to reject the null hypothesis specified for each test. Again, detecting the stability of the model for long run and short run relationship is reported by using the cumulative sum of recursive residuals (CUSUM) and the cumulative sum of squares of recursive residuals (CUSUMSQ) tests. Between two critical lines if the cumulative sum goes outside the bound (i.e. never returns back), the test shows serious parameter instability.
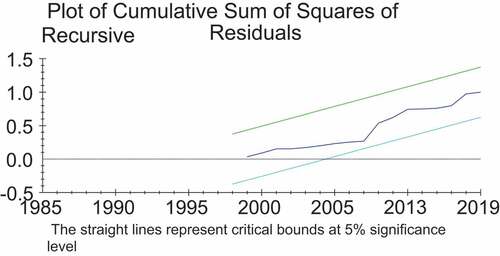
show the plots of both the CUSUM and CUSUMSQ for the models. It can be seen from the figures that the plot of CUSUM stays within the critical 5 per cent bound for all equations, and CUSUMSQ statistics does not exceed the critical boundaries that confirms the long-run relationships between the economic growth and the variables. It also shows that the stability of coefficient plots lie within the 5 per cent critical bound, thus providing evidence that the parameters of the model do not suffer from any structural instability over the period of study. On the similar way, figures critical limits are not crossed with the plot of CUSUM test. On the same way, the lower and upper critical limits are not crossed by the CUSUMSQ test. This has an implication that there are stable long run estimates and no structural break.
Figure 3. Test for stability of parameters for fiscal policy and economic growth.
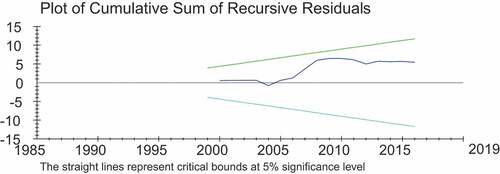
Figure 4. CUSCUMSQ fiscal policy and economic growth.
5.2. Long run ARDL Bounds tests for Co-integration
In order to empirically analyze the long-run relationships and short run dynamic interactions among the variables of interest, this study apply the autoregressive distributed lag (ARDL) cointegration technique as a general. The bounds test is mainly based on the joint F-statistic which its asymptotic distribution is non-standard under the null hypothesis of no cointegration. The long run relationship among the variables exists if the calculated value of F-statistic is greater than the upper critical bound test, and if the calculated value of F- statistic is smaller than the lower critical bound, the long run relationship does not exist, if calculated value of F-statistic comes in between the range of LCB and UCB then the long run relationship is inconclusive (Mintz, Citation1991; Shahid Hassan & Kalim, Citation2012). For the fiscal policy and growth equation, results in below shows that the calculated F-statistic (7.2418) was higher than the upper bound critical value at 1 per cent level of significance (4.26). Thus, the null hypothesis of no long-run relationship between the above variable was rejected irrespective of the order of their integration implying that there was a long-run relationship between the variables.
Table 2. Bound test for fiscal policy and economic growth model
As it is depicted in , the calculated F statistics is 7.24 which are higher than both the Pesaran et al. (Citation2001) and Narayan (Citation2004) upper bound critical values at 1% level of significance. This indicates that the null hypothesis of no long-run relationship is rejected; rather accept the alternative hypothesis (there is long-run relationship) based on the Pesaran et al. (Citation2001) and Narayan (Citation2004) critical values at 1% level of significance. Therefore, there is co-integration relationship among the variables in long run for both models.
5.3. Long run ARDL model estimation
Using an ARDL model, the study began by estimating an overall model (including all relevant variables and lags) and then systematically testing downwards for their significance and other diagnostics such that in the final model, only the most relevant variables remained Banerjee et al (Citation1993), Inder (Citation1993), and Wojciech and Derek (Citation1997). In line with this assertion the remaining variables in the ARDL model are: private investment, non-tax revenue, government investment which is proxied by capital expenditure, distortionary tax, aid, secondary school enrolment and labor force excluding fiscal variables i.e unproductive recurrent expenditure and non-distortionary tax.
After confirming the existence of long-run co-integration relationship among the variables, the next step is running the appropriate ARDL model to find out the long run coefficients, which is reported in below. Because of many variables in the model and the limited sample size in this study, the number of lags contained into the ARDL dynamic equations was restricted to only one period. Results for each specification are discussed in the following sections.
The estimated coefficients of the long-run relationship are significant for government investment, private investment, productive government consumption, aid, school enrollment and labor but not significant for non-tax revenue and distortionary tax. The government investment proxied by the government capital spending is significant and has positive contribution to growth GDP. The table reveals that an increase in capital spending by government by one percent leads to approximately 0.02 percentage increase in GDP in Ethiopia. Similarly, Barro (Citation1989) and Easterly and Rebelo (Citation1993) in their respective cross-country studies, they found a positive and significant relationship between government investment and output. Thus results of this study are consistent with most studies on the topic and in line with theoretical prediction of significantly positive relationship between public investment and economic growth. This gives an implication that Ethiopian economy will likely perform better as more resources are diverted from consumption to investment spending. Non-tax revenues were found to be negatively correlated with per capita output while it is statistically insignificant.
A result in reveals that, private investment influences economic growth positively and statistically significant. This calls for investment incentives that would enhance the growth of private investment necessary to steer the economy to the desired growth levels. Similarly, Ellahi and Kiani (Citation2011) found a positive and significant relationship between private investment and economic growth in the case of Pakistan.
Table 3. Estimated long-run coefficients using ARDL approach; ARDL (1,1,0,1,0,1,0,1,0) selected based on akaike information criterion
Contrary to the expectation that Foreign aid (grants) have a positive relationship with per capita output, the finding of this study shows negative relationship. This may be due to either fungibility of aid or tied to donors’ desires in Ethiopia as it will have adverse effect on economic growth by discouraging private investment.
In specification of model of fiscal policy and economic growth in this study, aid is considered as better mechanism of financing the rising government spending than an alternative source of revenue. From this study empirical result shows that aid coefficient is negative with magnitude of −.005. This finding is consistent with most of the general findings of studies on aid and growth in Africa. Another possible explanation is that the variable could be causing distortionary effects e.g., through Dutch disease or discouraging savings Younger (Citation1992) and Elbadawi (Citation1999). Policy implications derived from this is that in order for aid to promote investment and growth in Ethiopia, it must be channeled towards prioritized development projects and programs.
The labor turned out to be insignificant determinants of long run growth in Ethiopia, in this study. Consistent with finding of Kneller et al. (Citation1999) productive government expenditure increases growth in Ethiopia in the long run as the coefficient of PGC is positive and significant with magnitude of .013. This implies that productive consumption expenditure and government investment have a role in determining growth of real per capita income in Ethiopia.
Moreover, economic growth is negatively and significantly affected by distortionary taxation which is in line with economic theory and empirical evidence but statistically insignificant. An increase in distortionary taxation reduces the incentive for private investment by lowering its rate of return and hence leads to reduction in economic growth. As it is argued by Diamond et al. (Citation2003), tax rate has an impact on the investment demand function by varying after-tax return on capital and the supply function of investment by enhancing incentives to save more.
The proxy for human capital development, school enrolment, is one of the most important determinants of long run growth in Ethiopia. It is positive and highly significant, with an output elasticity of .46. This result shows consistency with growth theories and education has a spillover effect across economy in addition to its contribution to improvement of individual skill.
5.4. Short run error correction model
The error correction term (ECT) is derived from the corresponding long run model whose coefficients are obtained by normalizing the equation. The error correction term shows the speed of adjustment to reinstate equilibrium in the dynamic model. The ECM coefficient shows how quickly variables converge to equilibrium and it should have a statistically significant coefficient with a negative sign. According to Bannerjee et al. (Citation1998), the highly significant error correction term additionally endorses the existence of a stable long-run relationship.
As it is revealed in below ECM coefficient for fiscal policy and economic growth model, estimated at −.73091 which is significant and has expected negative sign leading to relatively high speed of adjustment to equilibrium. Again, the coefficient of the error term (ECM-1) in this model shows that as result of shock to steady relationship, the deviation from long run equilibrium level of real GDP in the current period is corrected by 73% in the next period.
Table 4. Error correction representation for selected ARDL model; ARDL (1,1,0,1,0,1,0,1,0) selected based on akaike information criterion
Results from table reveal that same as the long run result, private investment, government investment, school enrollment, productive government expenditure, and labor force have positive impact on Ethiopian economic growth and the first three variables are statistically significant in short run while others not. As a result a one percent increases in government capital spending has an output elasticity of .014 in the short run. In the short run, however, productive government expenditure does not appear to be a significant factor influencing growth in Ethiopia. The reason for this is perhaps long gestation periods required for the beneficial returns of government consumption expenditure.
Furthermore, private investment is still with positive coefficient, which indicates the positive relationship between private investment and Ethiopian economic growth. Again like in the long run, the aid variable significantly affects economic growth at 5 percent significance level. Even though, the sign still remains is negative. Again like the long run effect, the non-tax revenue variable is found to have a negative relationship with economic growth in the short run.
6. Conclusion
The study sought to examine the effect of fiscal policy and economic growth in Ethiopia and investigate the effect of components of fiscal policy instruments on economic growth. In the estimation procedure an autoregressive distributed lag model was used as it yields even in presence of endogenous variables, its estimation result gives precise estimates of long-run parameters and valid t-statistics. The test is possible even if the underlying regression is purely I(0), purely I(1) or a mixture of the two types.
In this study investigation was conducted on the impact of fiscal policy and related variables on growth in Ethiopia. Hence, elimination of components of consumption expenditure and revenue that do not contribute to growth was done and removed them from growth model without loss of informational value and robustness of the model. The findings showed that fiscal policy instruments are highly relevant in the discussion of Ethiopian economic performance. Overall, the study found evidence that strongly support prediction of endogenous growth model. Main findings of this study are the following: A bound test confirmed that a long run equilibrium relationship holds among the variables. Non-productive expenditures and non-distortionary taxes found to have neutral impact on economic growth in long run as well as in short run. Economic growth is affected by productive expenditures positively and significantly. Distortionary taxes affect economic growth negatively and found to be statistically insignificant. School enrollment Variable which is included in the model as a proxy for human capital is found a source of per capita GDP.
Authors’ contributions
The author contributes to the drafting of all sections of the paper. This paper is also part of a Msc thesis of Solomon Tilahun Mengistu, Department of Economics, Addis Ababa University, Ethiopia
Availability of data and materials
Data and material would be made available upon request.
Acknowledgements
This paper represents the personal opinions of individual staff member and is not meant to represent the position or opinions of the Policy Studies Institute or its members, nor the official position of any staff members. Any errors or omissions are the fault of the author.
Disclosure statement
No potential conflict of interest was reported by the author(s).
Additional information
Funding
References
- Agenor, P.-R., & Moreno-Dodson, B. (2006). Public infrastructure and growth: New channels and policy implications. World Bank Policy Research Working Paper 4064 (November), Washington, DC.
- Agenor, P.-R. (2007). Fiscal policy and endogenous growth with public infrastructure. Oxford Economic Papers, 60(1), 57–15. https://doi.org/10.1093/oep/gpm018
- Ball, L., & Mankiw, N. G. (1995). What do budget deficits do? Harvard Institute of Economic Research Working Papers, 1740, 95–119.
- Banerjee, A., Dolado, J. J., Galbraith, J. W., & Hendry, D. F. (1993). Cointegration, error-Correction, and the econometric analysis of non-stationary data: advanced texts in econometrics. Oxford University Press.
- Banerjee, A., Juan, D., & Ricardo, M. (1998). Error-Correction mechanism tests for cointegration in a single-equation framework. Journal of Time Series Analysis, 19, 615–625.
- Barro, R. J. (1989), ‘Economic growth in a cross section of countries’, NBER Working Paper, Working Paper N0. 3120.
- Barro, R. J. (1990). Government spending in a simple model of endogenous growth. Journal of Political Economy, 98(2), 103–125. https://doi.org/10.1086/261726
- Barro, R. J., & Sala-I-Martin, X. (1992). Public finance in models of economic growth. The Review of Economic Studies, 59(4), 645–661. https://doi.org/10.2307/2297991
- Barro, R. J., & Sala-I-Martin, X. (1995). Economic growth. McGraw-Hill.
- Barro, R. J., & Sala-i-Martin, X. (2004). Economic growth. MIT Press.
- Baum, A., Checherita-Westphal, C., & Rother, P. (2012): Debt and growth. new evidence for the euro area. ECB Working Paper. No. 1450. July2012
- Bleaney, M., Gemmel, N., & Kneller, R. (2000), ‘Testing the endogenous growth model: Public expenditure, taxation and growth over the long-run’, DiscussionPaper No. 00/25, University of Nottingham.
- Boakye, P. F. (2008). Foreign Aid and Economic Growth in Ghana (1970-2005). ( Unpublished Masters dissertation), University of Science and Technology,
- De Castro, F. (2004). The macroeconomic effects of fiscal policy in Spain”, Banco de Espana, Working Paper Series, http//www.bde.es
- Diamond, John, W., Moomau, & Pamela, H. (2003, September). Issues in analyzing the macroeconomic effects of tax policy. National Tax Journal, National Tax Association;National Tax Journal, 56(3), 447–462.
- Easterly, W., & Rebelo, S. (1993). Fiscal policy and economic growth: An empirical investigation. Journal of Monetary Economics, 32(3), 417–458. https://doi.org/10.1016/0304-3932(93)90025-B
- Elbadawi, I. A. (1999). External aid: Help or hindrance to export orientation in Africa? Journal of African Economies, 8(4), 578–616. https://doi.org/10.1093/jae/8.4.578
- Ellahi, N., & Kiani, A. (2011). Investigating public investment-growth nexus for Pakistan. In International conference on E-business, management and economics, IPEDR (Vol. 25, pp. 239–244).
- Enders, W. (1995). Applied Econometric Times Series. John Wiley & Sons, Inc.
- Heintz, J., Pollin, R., & Garrett-Peltier, H. (2009). How infrastructure investments support the US economy: Employment, productivity and growth. Political Economy Research Institute (PERI), University of Massachusetts Amherst.
- Inder, B. (1993). Estimating long-run relationships in economics: A comparison of different approaches. Journal of Econometrics, 57(1–3), 53–68. https://doi.org/10.1016/0304-4076(93)90058-D
- International Monetary Fund. (2016). IMF Executive Board Concludes 2016 Article IV Consultation with the Federal Democratic Republic of Ethiopia .
- Jones, D. M., Macken, W. J., & Murray, A. C. (1993). Disruption of visual short-term memory by changing-state auditory stimuli: The role of segmentation. Memory & Cognition, 21(3), 318–328.
- Khosravi, A., & Karimi, M. S. (2010). To investigate the relationship between monetary policy,fiscal policy and economic growth in Iran:AutoregressiveDistributedLagApproachto cointegration. American Journal of Applied Sciences, 7(3), 420–424. https://doi.org/10.3844/ajassp.2010.415.419
- King, R. G., & Rebelo, S. (1990). Public policy and economic growth: Developing neoclassical implications. The Journal of Political Economy, 98(5, Part 2), S126–S150.
- Kneller, R., Bleaney, M. F., & Gemmell, N. (1999). Fiscal policy and growth: Evidence from OECD countries. Journal of Public Economics, 74(2), 171–190. https://doi.org/10.1016/S0047-2727(99)00022-5
- Lensink, R., & Morrissey, O. (2000). Aid instability as a measure of uncertainty and the positive impact of aid on growth. Journal of Development Studies, 36(3), 31–49. https://doi.org/10.1080/00220380008422627
- Lucas, R. (1988). ”On the Mechanics of Economic Development.”J. Monetary Econ, 3–42.
- Mintz, J. (1991). The Role of Wealth Taxation in the Overall Tax System. Canadian Public Policy, 171, 237–247. doi:
- MoFED (2013). Annual progress report for F.Y. 2011/12 growth and transformation plan. Addis Ababa.
- MoFED (2014). Growth and transformation plan annual progress report for F.Y. 2012/13. Addis Ababa.
- Muhammed, A., & Asfaw, M. (2014). Government Spending for Economic Growth in Ethiopia. Journal of Economics and Sustainable Development, 5(9), 66–74.
- Narayan, P. K. (2004). Fiji’s tourism demand: The ARDL approach to cointegration. Tourism Economics, 10(2), 193–206. https://doi.org/10.5367/000000004323142425
- Okafor, R. G. (2012). tax revenue generation and Nigerian economic development. European Journal of Business and Management, 4(19), 49–57.
- Osuala, A., & Jones, E. (2014). Empirical analysis of the impact of fiscal policy on economic growth of Nigeria. International Journal of Economics and Finance, 6(6). https://doi.org/10.5539/ijef.v6n6p203
- Pesaran, & Shin. 1997. An autoregressive distributed lag modeling approach to cointegration analysis. Working Paper 9514.
- Pesaran, M. H., Shin, Y., & Smith, R. J. (2001). Bounds testing approaches to the analysis of level relationships. Journal of Applied Econometrics, 16(3), 289–326. https://doi.org/10.1002/jae.616
- Reda, W. A. (2021). Public Expenditure and Economic Growth in Ethiopia. International Journal of Public Administration and Management Research, 7(1), 1–14.
- Rena, R. (2011). The impact of public and private investments on the Namibian economy- An Empirical Analysis. Review of Economic and Business Studies, (7), 59–78.
- Rioja, F. K. (2001). Growth, welfare, and public infrastructure: A general equilibrium analysis of Latin American economies. Journal of Economic Development, 26(2), 119–130.
- Shahid Hassan, M., & Kalim, R. (2012). The triangular causality among education, health and economic growth: A time series analysis of Pakistan.
- Stokey, N. L., & Rebelo, S. (1995). Growth effects of flat-rate taxes. The Journal of Political Economy, 103(3), 519–550.
- Success, M. J., Success, E. B., & Ifurueze, M. S. K. (2012). Impact of petroleum profit tax on economic development of Nigeria. British Journal of Economics and Management Sciences, 5(2), 60–70.
- Tadesse, T. (2011). Foreign Aid and Economic Growth in Ethiopia: A Cointegration Analysis. Economic Research Guardian, 1(2), 88–108.
- Wojciech, W. C., & Derek, F. D. (1997). ”New directions in econometric practice (Second ed.). number 1139. Books, Edward Elgar Publishing.
- World Economic Forum (2013). The Global Competitiveness Report 2013-2014.
- Younger, S. (1992). Aid and the Dutch disease: Macroeconomic management when everybody loves you. World Development, 20(11), 1587–1597. https://doi.org/10.1016/0305-750X(92)90016-O
- Zhang, Y., Wang, X., & Chen, K. (2011). Public infrastructure investment and Inclusive growth in China.