
 ?Mathematical formulae have been encoded as MathML and are displayed in this HTML version using MathJax in order to improve their display. Uncheck the box to turn MathJax off. This feature requires Javascript. Click on a formula to zoom.
Abstract
This paper evaluates the effectiveness of the COVID-19 temporarily led restriction on short selling by the Stock Exchange of Thailand (SET). We investigate the causal effect of short selling restriction on return, volatility and market quality from 2 September 2019 to 30 September 2020. Exploiting this short selling restriction as a natural experiment, we conduct difference-in-difference analyses and find that the uptick restriction on short selling worsens market quality with higher spread, lower market depth, and order imbalance. In addition, we find an increase in volatility during the restriction and a negative return surrounding the announcement date. This implies that the restriction increases the trading costs and price impact and fails to tame the volatile market and reduce returns.
JEL:
1. Introduction
In just a matter of weeks towards the end of 2019, a contagious virus, later known as COVID-19, has spread worldwide. This causes enormous disasters on the economies and the well-being of the world population. Stock markets are not an exception. In early 2020, stock markets around the world went into free-fall with unprecedented volatility. Like previous crises, short sellers are blamed for exacerbating volatility, causing the market to be spiraling down. To cope with an imminent collapse in the stock market, regulators in developed and emerging markets around the world, impose some sorts of short selling restrictions or total bans. As such, it is important to evaluate the effectiveness of measures imposed by regulators. This paper explores the causal effect of COVID-19 temporarily led restriction on short selling on return, volatility and market quality.
Goodell (Citation2020) provides a good summary of the impact of natural disasters on economies and highlights the severity of the COVID-19 on financial sectors, calling for future research. To date, there are voluminous papers related to the COVID-19 and stock market. Approximately 25% of the existing papers on the COVID-19 and stock market cover papers on COVID-19 and short selling restrictions, mostly in European Union and international stock markets. For instance, Kizys et al. (Citation2021) examine herding behavior in international stock markets during the COVID-19 pandemic and document that short-selling restrictions in European Union during the outbreak reduce herding behavior. Siciliano and Ventoruzzo (Citation2020), Corte et al. (Citation2020), and Bessler and Vendrasco (Citation2021) investigate the effect of a temporarily short selling ban in the main European stock markets and find the ban is ineffective and does not lead to consequences the regulators intended to promote. We contribute to the literatures of short-sale restriction by exploring the effectiveness in the settings of the Stock Exchange of Thailand. We believe that we are the first to study the effect of short sale ban under the exogenous shock from Covid-19 crisis in an emerging market.
Short selling restriction is one of the most popular tools often used by regulators around the world in an attempt to promote stability in a stock market during the unprecedented financial turmoil. Past studies document that the implementation of short selling restrictions does not deliver a desirable result; instead, it leads to lower market quality and slower price discovery process (see, Beber & Pagano, Citation2013; Boehmer et al., Citation2013; Marsh & Payne, Citation2012; Battalio & Schultz, Citation2011; Cakici et al., Citation2018; Grundy et al., Citation2012; Crane et al., Citation2019). However, Jones (Citation2012) supports the idea that the presence of short-sale restrictions brings positivity to price movement as short selling restriction in the NYSE market makes it more difficult to short sell stocks, leading to positive abnormal returns. Furthermore, Diether et al. (Citation2009) show that short selling restrictions do not affect daily return and volatility. Existing studies such as Hodgson et al. (Citation2018), Chen et al. (Citation2019), and Henry (Citation2019) also demonstrate that short sellers have an important role in financial markets by facilitating price discovery. Li et al. (Citation2018) study the effects of short selling in China when short selling is made eligible in March 2010. They show that short selling helps improve price efficiency and liquidity of the market. Bohl et al. (Citation2012) examine the short selling bans in Taiwan and find that short selling restriction increases the volatility. Nevertheless, some studies show adverse effects of short selling. Ni and Zhu (Citation2016) find that stocks eligible for short selling may have higher crash risk and destabilize the market. Ni and Yin (Citation2020) also investigate the short selling in China and find that firm performances are lower from the removal of short-sale bans. Meng et al. (Citation2020) show that financial constraints deteriorate and external financing cost rises. Given the mixed evidence of the short selling restrictions, we shed new light by evaluating the causal effect of short selling restrictions on return, volatility and market quality in the Thai stock market during the COVID-19 pandemic.
Based on a daily sample of more than 35,000 observations of 152 stocks during the period of 2 September 2019 to 30 September 2020, our empirical evidence shows that the temporary short selling restriction by SET appears to be an ineffective tool during the COVID-19 chaos. That is, we find that short selling restriction reduces returns surrounding the announcement date, increases trading costs and fails to bring volatility down. Our difference-in-difference analyses likely indicate causal effect of short selling restriction on return, volatility and market quality. Finally, our findings are robust to endogeneity problems.
We contribute to existing literature at least threefold. First, we document the causal relationship between short selling restriction, return, volatility and market quality by exploiting the temporarily short selling restriction as an exogenous shock. This could shed some light on the usefulness of short selling restriction imposed by the regulators. Goodell (Citation2020) states that “it seems very likely that when we have a contagion disease next time, there can be a global financial market reaction. The COVID-19 will shape future investigations of tail risk and financial markets”. Although the cause of each crisis might not be the same, the tools or policies frequently adopted by many regulators intend to have a quick fix of bringing down volatility and stopping the market from a further tumble. To this end, regulators often make the short selling activities more difficult or even impossible. Second, a few studies investigate the effectiveness of short selling restrictions during the COVID-19 pandemic in the emerging market, although the emerging market with its high growth has been increasingly attracting attention from global investors as lucrative investment alternatives. For example, the Australians invest in the Thai stock market was reported at A$4.7 billion at the end of 2019 by the department of foreign affairs and trade, Australia. This highlights the need to understand the emerging market for asset allocation, especially under the extreme condition. The SET provides a unique environment to study the effectiveness of short-selling restriction imposed by the regulator. It operates under the pure limit order driven mechanism without market makers and uses the minimum tick-size rules where the minimum price increment depends on the stock price, while some developed markets, such as NYSE and NASDAQ, use the decimalization system. In addition, more than half of the trading activity of the SET is derived from the retail participants (Phansatan et al., Citation2012). Finally, we conduct our analyses using the difference-in-difference approach by exploiting the temporary restriction on short selling as a natural experiment. While not impossible, reverse causality and endogeneity are unlikely to be of concern.
The remainder of this paper is organized as follows. Section 2 provides a brief background on the SET and related literature. Section 3 describes the data and method. Section 4 documents empirical results. Section 5 concludes.
2. Background and review of related literature
2.1. Institutional background of the Stock Exchange of Thailand
The Stock Exchange of Thailand (SET) operates under a pure limit order driven market. Traders can participate by submitting a buy or sell order into the market. A trade will occur when an incoming order hits the outstanding bid or asks prices on the opposite side. The market or marketable limit buy (sell) order with the price equal to or higher (lower) than the outstanding offer (bid) price will be matched immediately. For brevity, we refer to both market orders and marketable limit orders as the market orders thereafter. The limit order with the price equal to or lower (higher) than the outstanding bid (offer) price will be accumulated at the corresponding price level. The impatient traders who demand liquidity tend to use market orders, while the patient traders tend to use limit orders to supply liquidity.Footnote1
In 2001, the SET introduced short selling rules by allowing investors to short sell stocks.Footnote2 However, the rules placed by the SET are different from those set by the U.S. regulator in at least two aspects. First, the U.S. Securities and Exchange Commission (SEC) allows all securities to be shorted. Short sellers may differentiate among firms with higher risk exposure and others based on their private information. In the subprime crisis 2008, financial firms with more subprime mortgages were associated with a larger amount of short selling (Hasan et al., Citation2015). However, the Thai regulator initially allows a certain set of securities to be sold short.Footnote3 In the Thai stock market, securities eligible for short selling are ordinary shares, included in the SET100 index, with sufficient liquidity and market size; the exchange traded funds (ETF) of the index or securities; depository receipts (D.R.) of the ordinary shares. However, this study focuses only on the common shares and excludes all other types of securities, such as ETF and D.R.
Second, the U.S. regulator specified short-sale restrictions since 1938, then relaxed to any price tick rule in 2007 but reverted to an alternative uptick rule in 2010. The exception period is from September to October 2008, when short-sale is not allowed on financial stocks. Specifically, the SEC uses the uptick test for the NYSE and the bid price test for Nasdaq. The alternative uptick rule (Rule 201) imposes short selling restrictions on a stock that triggered a circuit breaker by experiencing at least a 10% price decline in 1 day. Short selling is allowed if the security trades above the current national best bid in such circumstances. The short selling rules in Thailand are less complicated than those in the U.S. The SET imposes the zero-uptick rule, with the price not lower than the last trading price. It obviously prevents traders from submitting market sell orders. Only the limit sell orders at the ask are possible even though the last trade occurs at the bid.
The unprecedented situation of the COVID-19 outbreak in 2020 has sparked the sell-off and heightened volatility in all stock exchanges around the world, including the Stock Exchange of Thailand (SET), one of the emerging markets. Almost all stocks listed in the SET were sold off and the Thai stock market hit its lowest point on 13 March 2020. The circuit breaker was triggered on 12 and 13 March 2020. To curb the excessive trading and investor panic, the SET imposes the temporary uptick rule on 13 March 2020. Short-sellers are once again the culprit to be blamed for exacerbating the financial turmoil. By 1 October 2020, this temporary short selling restriction was lifted. This period of temporary short selling restrictions can be viewed as an exogenous event, allowing us to conduct the natural experiment to evaluate the effectiveness of this temporary restriction imposed by the SET.
2.2. Review of related literature
Two popular theories explaining how short sellers influence stock markets are disagreement and stock price informativeness hypotheses. Disagreement theory argues that short selling activities distribute negative opinions to the market and hence cause downward pressure on stock price (see, Miller, Citation1977; Harrison & Kreps, Citation1978; Hong & Stein, Citation2007). According to disagreement theory, short selling constraints truncate negative opinion, resulting in an optimistic view about the stock price. Hence, short selling restrictions could positively impact the stock price. On the other hand, the stock price informativeness hypothesis views short sellers as informed trades who facilitate the price discovery process. The threats of short sellers as another group of informed traders could discipline managers through reduced agency cost (De Angelis et al., Citation2017), lower financial misconduct (Karpoff & Lou, Citation2010), and misreporting (Fang et al., Citation2016; Massa et al., Citation2015). Policies to place some restrictions on the short selling activities must consider the tradeoff between positive and negative impacts of short sellers in the market. Short selling restrictions or bans could potentially reduce the effect of negative opinions but also increase market inefficiency (i.e. increase market uncertainty and trading costs). Existing evidence on the effectiveness of the short-selling restrictions or bans on stock markets is mixed. Most papers exploit the regulatory change as an event whether the short-sale ban is imposed on or lifted from certain groups of securities or the market-wide.
Few papers supporting short selling restrictions include Diamond and Verrecchia (Citation1987), Jones and Lamont (Citation2002), Jones (Citation2012), Crane et al. (Citation2019), and Geraci et al. (Citation2018). According to Diamond and Verrecchia (Citation1987) framework, rational agents are able to incorporate information on a lift or imposition of short selling bans; hence, short selling should not affect stock price. Jones and Lamont (Citation2002) support the idea that the presence of short-sale restrictions brings positivity to price movement as short selling restriction in the NYSE market makes it more difficult to short sell stocks, leading to positive abnormal returns. Similarly, Jones (Citation2012) studies the short sale restriction in the U.S. market during the 1930s when the regulator attempted to reduce the impact of short-selling on the market and reports short interest seems to subside when the uptick rule was imposed on the U.S. market. Furthermore, he finds lower volume-weighted quoted spreads and relative spreads, implying liquidity improvement after the uptick rule is put in place. However, the improvement seems to be the overall improvement with no particular association with stock characteristics. Crane et al. (Citation2019) and Geraci et al. (Citation2018) confirm Diamond and Verrecchia (Citation1987) framework and document that short-selling has no influence on stock prices or returns during regular periods. Studies in China show that short selling may lead to negative outcomes. Ni and Zhu (Citation2016) find that stocks eligible for short selling may have higher crash risk and destabilize the market. Ni and Yin (Citation2020) find that firm performances are lower from the removal of short-sale bans. Meng et al. (Citation2020) show that financial constraints deteriorate and external financing cost rises.
On the other hand, many papers documenting the negative effect of short selling constraints or bans include Diether et al. (Citation2009), Autore et al. (Citation2011), Battalio et al. (Citation2012), Boehmer et al. (Citation2013), Hu et al. (Citation2020), and Deng et al. (Citation2020) and many more. Diether et al. (Citation2009) and Deng et al. (Citation2020) focus on the change in the short selling rule in the U.S. in 2005, when the U.S. regulation revokes the uptick rule in the NYSE (Rule 440B) and bid price test in NASDAQ (Rule 3350). The short-sale restriction was applied to 986 pilot stocks selected from the Russell 3000 index to represent a broad range of markets. Diether et al. (Citation2009) study the effect on the market quality of the pilot stocks compared to the control group on whether they experience higher volatility, order flow asymmetry and lower liquidity. They find that when the short-sale restriction is lifted, there is no significant increase in the short-sale volume, but the short-seller may engage in more active trading strategies, such as order splitting and higher frequency (Diether et al., Citation2009). The study by Deng et al. (Citation2020) implies that short-sale constraints might lead to higher level of stock price crash risk, while findings by Hu et al. (Citation2020) infer that short selling constraint could potentially increase the cost of capital. McKenziea and and (Citation2012), Massa et al. (Citation2015), and Purnanandam and Seyhun (Citation2018) document that short-sellers improve the price informativeness. As such, short selling restriction could have a negative effect on the price discovery process.
In addition, Autore et al. (Citation2011), Battalio et al. (Citation2012), and Boehmer et al. (Citation2013) examined the short sale ban imposed by the SEC on U.S. financial stocks from 19 September to 8 October 2008 in response to the subprime crisis. They show that the ban may result in unexpected effects and cause the significant increase in bid-ask spread and price impact measure which imply higher trading cost and lower trading activity. The banned stocks experience greater impact than their matched sample. Other papers study and compare the effectiveness of short-selling across countries (Beber & Pagano, Citation2013; Frino et al., Citation2011). Although each market exploits different types of bans, they generally find that the regulation imposed tends to reduce market quality by widening the spreads, increasing volatility and reducing trading activity. More recently, Bessler and Vendrasco (Citation2021) study six European countries that introduced the short sale bans in March 2020 and find that the ban is ineffective.
It is obvious that the COVID-19 outbreak has presented an unprecedented impact to the financial markets around the world. A short sale ban is one of the regulatory tools used to prevent the extremely volatile market. However, the form and length of the ban varies country by country. Interestingly, the event clustered around 13–18 March 2020. Like many countries, the Thai stock market also faces extraordinary downward pressure on the stock price due to COVID-19 in early March 2020. To cope with the situation, the SET imposes the uptick rule. The uptick rule forces the sell orders to be placed at the offer or higher price only. If short selling restriction can tame the effect of negative opinion and encourage the positive disciplining effects of short sellers, the restriction put in place could have intended consequence that the regulators wish to have. This is an entirely empirical question that can vary from markets to markets. Hence, we investigate how the return, market quality and volatility will change when the short-sale becomes more difficult (e.g., moving from less restriction to more restriction) in the Thai stock market.
3. Data and methodologies
3.1. Sample
Two primary data sources are the SETSMART provided by the Stock Exchange of Thailand and the Tick History Data from Datascope. The SETSMART contains the daily trading variables including opening, highest, lowest, and closing price, number of transactions, number of shares traded, and market capitalization. More importantly, it provides the daily short-sale data such as number of shares, number of transactions, highest and lowest short-sale price (which may differ from the data of the regular transactions). To measure the bid-ask spread and depth, we obtain order book data from the DataScope. The buy and sell order flows including the trade direction can be inferred from the database. The transactions occurring outside of the continuous trading periods are eliminated. We eliminate the possible outliers in the sample, for example, observations with a spread lower than one tick, a one-sided quoted price and a zero or negative price for a non-trading day.
We use the data from 2 September 2019 to 30 September 2020 in our study. This covers the normal period before the Covid-19 outbreak occurred until the end of the temporary restriction of the short-sale rule employed by the Stock Exchange of Thailand (SET). The SET implemented the temporary uptick rule on 13 March 2020, originally until 30 June 2020, and later extended to 30 September 2020. The SET reverts to the zero uptick short-selling rules on 1 October 2020. We define the period between 18 March to 30 September 2020 as the post event, which consists of 130 trading days. To make it comparable, we define 2 September 2019 to 10 March 2020 as the pre-event period. Both periods contain 130 trading days. We omit 2 days around the event date to avoid the excessive trading behaviour during the circuit breaker and possible change in trading behaviour.
Since our study focuses only on the common stocks, we initially eliminate exchange traded funds (ETFs), real estate investment trust (REITs), depository receipts (D.R.s), and warrants from our sample. The literature that examines the change in short-selling rules exploits the difference in difference measures between a control group and the treatment one (Alexander and Peterson (Citation2008), Diether et al. (Citation2009), and Autore et al. (Citation2011)). We follow a similar method. Our sample for the difference-in-difference analysis includes treatment and control groups. For the treatment group, we include all eligible stocks on the SET that have short-selling transactions in both pre- and post-event periods. We further exclude any stocks with incomplete trading information and penny stocks from our sample. The final sample for the short sale transaction contains 76 stocks. We are aware that according to the regulation imposed by the SET, it does not randomly select the stocks for short sellers or open freely for the investors’ opinion. Eligible stocks for short selling were mainly the large stocks in the index; thus, the stocks in the treatment group tend to be more actively traded and larger than the control group by design. As such, to make our control group comparable to our treatment sample, we rely on the propensity score matching (PSM) based on price, market capitalization and turnover ratio without replacement to select the control stocks from all stocks with no short sale transaction. The samples in the control and treatment groups are reported in .
3.2. Market quality and volatility measures
We use various proxies for market quality as in Diether et al. (Citation2009). These include quoted spread, relative quoted spread, bid and ask depths, buy imbalance (BuyImb) and relative buy imbalance (RelBuyImb), respectively.Footnote4 The quoted spread in Baht is calculated as the time-weighted average differences between the ask and the bid prices for each stock. The relative quoted spread in percent is the quoted spread divided by the average of the bid and ask prices. Bid (ask) depth is the time-weighted average of the outstanding shares at the best bid (ask) price. The bid and ask depths imply the amount of the liquidity providers from the patient traders who place the limit orders (Ranaldo, Citation2004). To examine how the market orders are used by aggressive traders, we look at the BuyImb and RelBuyImb measures. The buy imbalance (measured in number of shares) and relative buy imbalance (measure in percent) are calculated as the buy volume minus sell volume (buy volume minus sell volume divided by total volume). Since these measures compare the buy order flows relative to the sell order flows, the negative value indicates that the market sell orders are greater than the market buy orders.
One of the main concerns of the regulator is the heightened volatility. We use the daily trade-based measures as follows: The high–low price volatility is calculated by highest minus lowest prices divided by the highest price on each day and each stock. The close-to-close (open-to-close) return volatility is computed as the squared absolute return of the logarithm of the closing price of day t divided by closing price of day t-1 (closing price of day t divided by opening price of the same day). The positive semi-variance is calculated as and the negative semi-variance is computed as
where N is the number of observations and Pt is a closing price on day t.
We also compute the volatility using the intraday measures. In a period of panic, speed has become vital and traders may jump in to sell (or short sell) their stocks. The daily measures may fail to detect the change in short-term volatility. We further use the high-frequency proxies to analyze the changes in volatility. We compute the standard deviation of the trade-to-trade return and the positive (negative) semi-variance in the same manner as the daily measure. Diether et al. (Citation2009) argue that the trade-based measure may have a problem with the bid-ask bounce. We also use the quoted-based measures to capture the volatility. The daily quoted range and the close-to-close (open-to-close) volatility are computed in the same manner as the trade-based measures but using the mid-quote prices instead of the actual trade price. For the intraday measures, we use the 5-, 10-, 15-, and 20-minute price changes for the high-frequency proxies. Likewise, the positive (negative) semi-variance is calculated as an average of positive (negative) returns with the same period as the standard deviation proxies.
3.3. Methods
The Covid-19 outbreak adversely affects the entire stock market, while the short-selling uptick rule should only affect a certain group of stocks in the market. Exploiting this temporary short selling restriction as an exogenous shock, we conduct a natural experiment to test our hypothesis on whether this uptick rule affects the market quality using the difference-in-difference method as follows:
where Yi,t is the proxy of market quality and volatility for stock i on day t. Posti,t is the dummy variable being 1 for observations occurring after 18 March 2020 and 0 before 10 March 2020. We exclude observations between 11 to 17 March 2020, when the market started to tumble, circuit breaker was triggered twice and the temporary uptick rule was later announced to fend off the panic. Shorti,t is a dummy variable setting to 1 for stocks in the treatment group and 0 otherwise. In order to mitigate any potential omitted bias in our analysis, we include the size, turnover and industry dummy variables. Sizei,t is firm size, measured as the natural logarithm of market capitalization. Turnoveri,t is the daily number of shares traded divided by outstanding shares. Dummy industry is also included to control for firm fixed effect. is our key interest as it captures the DID coefficient estimate. We estimate the above regression with cluster standard errors by both day and stocks to control for both cross-correlation and serial correlation.
In addition, we explore the market reaction to the short selling restriction surrounding the announcement date. Our analysis focuses on the pre- and post-event periods, which exclude certain days during the event periods. Since the announcement day is on 13 March 2020, we examine how the stock returns react around the event period using the pool regression of daily returns on the event dummy variable. We conduct the regression analysis as follows.
where Ri,t is a daily return from day -m to +n which m, n range from 1 to 5 days around the 13 March 2020 as day 0, Shorti is a dummy variable that equals one if the given stocks is in the treatment group, and zero otherwise, Eventt is a dummy variable that equals one if the returns of a given stocks is from between day—m to +n, inclusive. The regression cluster standard errors by both day and stock. We also control for firm size, turnover and industry dummy (not reported).
3.4. Descriptive statistics
reports the sample descriptive statistics. The average price for the treatment (control) group is 17.1 (14.5) Baht before the uptick rule and drops to 14.4 (13.6) Bath per share for the post-event period. This is not surprising since the Covid-19 outbreak causes market turmoil and price drop drastically. The maximum and minimum prices present the same patterns that the pre-event values are lower than those of the post-event. On the daily transaction, the treatment (control) group has on average 981 (330) transactions per day before the event and increases to 1,592 (525) transactions for the post-event period. Similarly, the daily volume of the treatment (control) group is 7.6 (3.4) million shares and jumps to 12.4 (4.5) million shares per day. This finding is consistent with Ortmann et al. (Citation2020) that trading activity increases as the COVID-19 unfolds. This seems to indicate that as the market drops and the short sale is restricted, more investors arrive at the market or become more active. This is similar to the finding of Jones (Citation2012) in that after the uptick rule was implemented the trading activity improved. The market capitalization of the treatment (control) group is 19,304 (12,823) million Baht before the event and 16,311 (10,666) million Baht subsequently.
Table 1. Descriptive statistics
We present the descriptive statistics of the variables used in the paper. For market quality proxies, we find that the quoted spread (relative spread) of the treatment group drops from 0.102 Baht (0.741%) to 0.087 Baht (0.731%). The quoted spread (relative spread) of the control group also drops from 0.260 Baht (1.824%) to 0.148 Baht (1.633%). On the one hand, the spread reduction indicates the expected outcome that market quality improves after the restriction is imposed. On the other hand, the reduction of the treatment group is relatively lower than that of the control group, which is not meant to be affected by this rule. The market depth on the bid and ask also has similar patterns. The bid depth of the treatment decreases from 355 to 338 thousand shares, while the ask depth increases from 287 to 297 thousand shares. This may indicate that traders tend to place more limit orders on the ask while reducing their limit orders on the bid. Note that this may be partly the results of the uptick rule as well because the short sellers are allowed to place their orders on the ask side only. On the contrary, the market depths on the bid (ask) side of the control group increase from 191 (152) to 264 (221) thousand shares. This implies that traders may revise their trading strategies from consuming liquidity by placing the market orders to provide liquidity by placing limit orders. We find an increase in all order imbalance measures. For the treatment group, the BuyImb (RelBuyImb) increases from −123 (−9.2%) to 160 (−4.9%), while the BuyImb (RelBuyImb) increases from −88 (−11.3%) to—67.3 (−6.2%) for the control group. It is interesting to see the reduction of market sell orders relative to the buy orders in both groups. Our results indicate that the market sell orders are reduced after the restriction, including the control group, which is not directly affected by the uptick rule.
Turning to volatility, we find that the daily volatility of the treatment group increases across the trade-based and quote-based measures. The daily price range, close-to-close return volatility and open-to-close return increases from 3.14%, 7.57%, and 5.92% to 4.21%, 12.77%, and 9.66%, respectively. A similar pattern for the control group is found. We also find that positive (negative) semi-variance increases from 6.86% (8.39%) to 15.68% (9.56%), while the positive (negative) semi-variance for the control group is 7.59% (9.79%) and the post event becomes 11.9% (8.0%). The post-event negative semi-variance is the exception where we find the decrease in volatility. Also, we find that the intraday volatility measures increase. For the treatment group, the standard deviation on the trade-to-trade return is 0.52% and increases to 0.60%. The positive (negative) semi-variance is 0.82% (0.80%) and jumps to 1.18% (0.94%), respectively. The standard deviation of the 5-, 10-, 15- and 20-minute mid-quote return ranging from 0.31% to 0.46% in the pre-event, and increases to 0.40% to 0.62% in the post-event. The control group also has the same direction. The control groups show the same direction of changes.
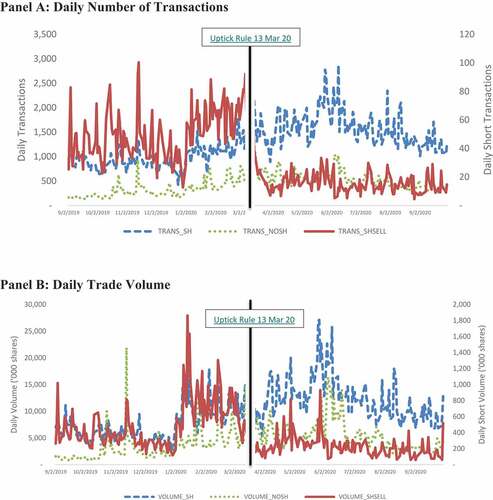
depicts the average daily trading activity per stock of both treatment and control groups, as well as the short selling activity from our sample over the period of 2 September 2019 to 30 September 2020. The blue dotted line is the trading activity of the treatment group, while the green dotted line is for the control group. The solid red line represents the trading activity of the short sellers (measured with the right-vertical axis). Consistent with , the treatment group (blue dotted line) seems to have greater trading activity throughout the period. The daily transactions for the treatment group range from 1,000 to the highest of 3,000 transactions per day, while the control group is about 500 to 1000 transactions. After the short sale is restricted, higher trading activity in both groups is observed. Generally speaking, the overall trading activity both in terms of number of transactions and volume traded are higher than before. From our dataset, the short-sale activity is a subset of the overall activity. However, the impact of the short-sale restriction is different. After short sale restriction is announced, the number of short sale transaction and volume traded drop significantly. Our findings show that prior to March 2020, the number of short sales and volume traded fluctuated in the same range prior to 2020. However, the short-selling increases during the early 2020. This is possible as some short sellers might have anticipated the market impact caused by the arrival of pandemic, originally reported in December 2019. Interestingly, these figures reveal an effect of uptick rule on short selling activity. In this regard, we may say that the regulator is successful in driving away the short sellers as their activity drop throughout the restriction period. However, short sellers play important roles in the market. Driving away short sellers may not necessarily be good for the market. The disagreement hypothesis predicts that suppressing negative opinions of short sellers could be beneficial, while the stock price informativeness hypothesis contrarily predicts short selling constraints could lead to poorer market quality. The regulators must therefore consider the tradeoffs between cost and benefit of short selling restrictions. Hence, in the next section, we formally test whether the short-sale restriction (in this case the uptick rule) improves stock return, trading costs and reduce market volatility.
Figure 1. Plot of daily trading activity panel A: daily number of transactions panel B: Daily trade volume.
4. Empirical results
4.1. The effect of short selling restriction on market quality
Following Diether et al. (Citation2009), we test whether the implementation of the uptick rule could deteriorate the market quality. reports our difference-in-difference results where our dependent variable is the market quality measures and our key independent variable is the interaction term between post and short dummy variables. The regression results for the quoted spread and relative spread are presented in columns 2 and 3. The Short and Post dummy variables are negative and significant at 1% level, indicating a drop in the quoted spread and relative spread in the treatment group and after the restriction is imposed. However, the interaction term between the Short and Post dummy variables indicates a positive effect. The quoted spread of the treatment stocks increases by 0.09 Baht (0.26%) at the 1% significant level relative to the control group. Based on the DID method, we interpret this as the spreads are widened when the uptick rule is enforced. In other words, although we observe the spread reduction as a result of the short-sale restriction, it is insufficient when compared with the control groups.
Table 2. Market quality measures and short selling uptick rules
Columns 4 and 5 show that the bid (ask) depths of the treatment group drop by 164 (126) thousand shares relative to the control group. Since the bid (ask) depths can be viewed as offering the standing limit buy (sell) orders for the sellers (buyers) to have their orders filled immediately. The thicker the depths, the more liquidity it becomes. Therefore, we interpret the negative and significant interaction term between the Short and Post dummy variables as the decrease in depth or liquidity when the uptick rule is imposed. We conjecture that the liquidity providers may reduce their risk of being picked off by lowering the volume of both bid and ask sides.
Lastly, the buy imbalance, measuring the difference between the buys and the sells in terms of number of shares and per cent is reported in columns 6 and 7. In column 6, our regression results show that the interaction term has a negative sign and is significant at 10% level. This implies that stocks in the treatment group still experience significant sell pressures. Column 7, however, indicates that the interaction term is not significantly different from zero. Hence, changes between the treatment and control are similar in terms of buy and sell imbalance in relative terms.
Overall, our findings regarding the spread, depths and order imbalance present consistent patterns. The sellers put price pressures by selling the shares more than the buyers buying shares, while the liquidity providers are less likely to use the limit order to offer standing orders in the market. Hence, it appears the cost of short selling restriction outweighs its benefit. Driving short sellers away from the market does not seem to be good for the market as it reduces market quality in the Thai stock market. Consistent with stock price informativeness hypothesis, short sellers in the Thai stock market appear to be informed traders and contribute to price discovery process, their absence increases trading cost or lower liquidity. Our findings are consistent with Autore et al (Citation2011), Frino et al. (Citation2011), Battalio et al. (Citation2012), Boehmer et al. (Citation2013), Beber and Pagano (Citation2013), Lee (Citation2016), Siciliano and Ventoruzzo (Citation2020), Hu et al. (Citation2020), and Deng et al. (Citation2020) to name a few.
4.2. The effect of short selling restriction on volatility
4.2.1. Daily market volatility
The market volatility can be observed in a normal situation and acceptable. Regulators are normally concerned with the excessive volatility since it may induce more risk to investors. The turmoil caused by the COVID-19 outbreak heightens the market volatility to a higher level than it would normally be. We measure whether the uptick rule can be an effective tool to reduce the market volatility.
According to , we find that the overall daily volatility measures increase even after the rule is implemented. Following Diether et al. (Citation2009), we examine the daily measures based on the quote and trade variables. reports the daily volatility. Panel A of presents the results from quote measures. Column 2 presents the DID regression with the daily quoted range volatility. Columns 3 and 4 present the results when the dependent variables are close-to-close and open-to-close return volatility, respectively. We find that the daily quote range for the short-selling stocks is 0.467% higher when compared to the control group. The close-to-close (open-to-close) volatility also significantly increases by 2.197% (2.1293%), respectively. The Post and Short dummy variables of the daily quote range are 0.273% and 0.244%, respectively. The same coefficients for the open-to-close volatility are −1.016% and −1.136% at the significant level of 1%. Overall, the interaction terms for all three dependent variables are positive and significant at 1% level.
Table 3. Daily volatility
Panel B of reports the results of trade-based measures. The overall results are consistent with the finding of the quote measures both in terms of sign and magnitude. The increase in daily quote range is 0.114% for the treatment group. The close-to-close (open-to-close) volatility also increases by 2.076% (0.997%). In addition, the positive (negative) semi-variance is at 1.659% (3.119%) and significant at 10% (5%) level. In general, the interaction terms for all dependent variables are positive and significant at 1–10% level. In addition to the main variables of interest, we also detect that volatility increases with the turnover and decreases with the firm size. We find that the trade-based measures are somewhat weaker than the quote-based measures.
4.2.2. Intraday market volatility
We conduct a volatility analysis based on the intraday data. For the quote measures, we use the sum of the squared of mid-quote return with the 5-, 10-, 15- and 20-minute interval. For the trade-based measure volatility, we compute the standard deviation of the trade-to-trade return and semi-variance for the positive and negative returns. reports the regression results. In panel A, we find that for all the quote-based measures, both the short-selling stocks and the control group experience higher volatility after the uptick rule is enforced. The longer the time horizon of measurement, the higher the volatility. We find the consistent results for the Short dummy variable with the negative and significant coefficients. The volatility ranges from −0.10% to −0.06%, which indicates that the stocks in the treatment group have lower volatility. Most importantly, the main variable of interest for DID analysis is the coefficients of the interaction term. The results have positive and significant results ranging from 0.085% to 0.104%. Consistent with the daily volatility measures, the volatility does not decrease as wished in the treatment group. panel B reports the trade-based measures. Our analysis shows the similar results. The coefficients of the Short dummy variable are negative and significant, and the interaction term is mostly positive and significant. The trade-to-trade volatility is measured by the standard deviation of the trade-to-trade return. Our trade-based measures using the high-frequency data are unable to detect any change between the pre and post periods as much as the daily measures. Diether et al. (Citation2009) argue that the findings tend to be noisy due to the bid-ask bounce. We believe that this problem is more severe in the Thai stock market where the fixed tick size is used since the trades tend to occur only at the best bid or ask only. The overall finding of intraday high-frequency volatility is consistent with the daily volatility measures. The size and turnover effects are the same as the daily volatility measures.
Table 4. High-frequency volatility
Overall, our results from volatility analyses contradict the findings of Diether et al. (Citation2009) and Crane et al. (Citation2019). Their findings suggest that the suspension of price tests has virtually no impact on the daily returns and volatility. If the intention of the uptick rule is to reduce the market volatility among the short-selling stocks, our findings show the opposite results. Based on the DID, although the volatility of the treatment group drops, it does not reduce as much as expected. Again, it appears the cost of short selling restriction outweighs its benefit. The stock price informativeness hypothesis predicts that short selling constraints could lead to slow price discovery and increase uncertainty (or volatility). As such, making it more difficult to short sales fails to tame market volatility in the Thai stock market. Our findings are consistent with Autore et al (Citation2011), Frino et al. (Citation2011), Battalio et al. (Citation2012), Boehmer et al. (Citation2013), Beber and Pagano (Citation2013), Lee (Citation2016), Siciliano and Ventoruzzo (Citation2020), and Hu et al. (Citation2020).
4.3. The effect of the short selling restriction on daily returns surrounding announcement days
reports the DID regression results for market reaction to short selling restriction announcement. Not surprisingly, during the event period market returns are negative across periods that we examine. The main variable of interest is β2 which represents the DID effect on the treatment stocks. The coefficients of the interactive term are mostly significant and negative, implying strong negative returns. During the event period, when we estimate the regression with the [−3, +3], [−2, +2], and [−1, +1] surrounding 13 March 2020, we find a significant negative coefficient at 1% level for the interactive terms. Except for the last model which uses the returns on day [+1, + 5] after the announcement date, we find no significant negative effect. Nevertheless, both the event and interactive term of Post x Event are statistically different from zero. Our finding is opposite to Diether et al. (Citation2009) who find no significant return in both NYSE and Nasdaq stocks around the announcement and event dates. Theoretical models (for example, Miller (Citation1977), Harrison and Kreps (Citation1978) and Duffie et al. (Citation2002)) predict that the short sale constraints cause the positive pressure on stock prices. The disagreement hypothesis suggests that short sellers reduce the excessive optimism in the stock price and drive it to fundamental value. However, based on our analysis, the short-sale restriction does not exert an immediate change in downward price pressure. When the market is under downward price pressure, the short-sale restriction may not be able to curb the excessive volatility, at least in the short run. Again, it appears that the benefit of a short selling restriction does not outweigh its cost. Our findings are consistent with Autore et al. (Citation2011), Frino et al. (Citation2011), Battalio et al. (Citation2012), Boehmer et al. (Citation2013), and Beber and Pagano (Citation2013).
Table 5. Return on the event days
5. Conclusion
Our paper studies the effectiveness of the uptick rule imposed by the Stock Exchange of Thailand during the COVID-19 pandemic situation. The uptick rule is one of the measures that regulators often use to cool off the market panic, especially when a crisis hits the market. Many studies find that the short selling restrictions or bans often deteriorate the market qualities with the lower trading activity, widening spreads, and do not reduce the volatility as expected. Similar to findings by Diether et al. (Citation2009), Autore et al (Citation2011), Battalio et al. (Citation2012), Boehmer et al. (Citation2013), Hu et al. (Citation2020), Deng et al. (Citation2020), Siciliano and Ventoruzzo (Citation2020), and Bessler and Vendrasco (Citation2021), we also find that when the uptick rule was implemented, return is negative, the quoted spread and relative spreads are widened, while volatility also increases. Our findings reinforce the important role of short sellers in the market. Consistent with the stock price informativeness hypothesis, we find that market where short selling becomes difficult has slower price discovery, higher uncertainty and trading costs. Short sellers appear to play important roles for both informed traders and liquidity providers in the Thai stock market. The decision by the Thai regulator to restrain short sellers from the market has an adverse effect on the market, rather than improving market conditions that the regulator expects to achieve.
Based on our empirical evidence and existing evidence (e.g., Beber & Pagano, Citation2013; Crane et al., Citation2019), short selling restrictions or total bans not only lack of effectiveness but also have negative impact on market quality. We therefore suggest financial regulators to carefully consider the trade-offs between costs and benefits of short selling restrictions. In addition, we believe that regulators in emerging markets should be particularly wary of short selling restrictions as stock markets in emerging countries are less developed, have a relatively larger number of small stocks, lower levels of fragmentation and fewer alternatives to short selling than those in developed countries.
As stated in Frino et al. (Citation2011), the financial crisis is unpredictable. If it arises again in the future, the market regulators will be called upon to intervene. The results from this study could be part of knowledge for making decisions.
Disclosure statement
No potential conflict of interest was reported by the author(s).
Additional information
Funding
Notes on contributors
Tanakorn Likitapiwat
Tanakorn Likitapiwat is Assistant Professor at Chulalongkorn Business School, Thailand. He earned a Ph.D. in Business Administration (Finance Major) from University of Memphis. His research interests include market microstructure, investment and behavioral finance.
Sirimon Treepongkaruna
Sirimon Treepongkaruna is Visiting Professor at Sasin School of Management and Professor of Finance at the University of Western Australia. She has over than 80 international and domestic publications. She serves as editorial board member for Accounting and Finance, Accounting Research Journal and Review of Applied Economics. Her research interest includes (1) applied financial economics and empirical finance, (2) issue in international finance (e.g., term structure of interest rates, inflation, bonds, credit risk and ratings), (3) asset pricing and (4) corporate governance.
Notes
1. For more detailed discussion on SET, please see, (Charoenwong et al., Citation2010) and (Phansatan et al., Citation2012)
3. It is extended in 2011 https://api.setscm.set.or.th/rulebook/api/rulebook/getDocumentFile/4405
4. We did not report the effective spread since the best bid and ask prices are binding at 1 tick. Trades in the SET normally occur at the bid (for a sell) or ask prices (for a buy) thus effective spreads are equal to the quoted spread.
References
- Alexander, G. J., & Peterson, M. A. (2008). The effect of price tests on trader behavior and market quality: An analysis of reg SHO. Journal of Financial Market, 11(1), 84–23. https://doi.org/10.1016/j.finmar.2007.06.002
- Autore, D. M., Billingsley, R. S., & Kovacs, T. (2011). The 2008 short sale ban: Liquidity, dispersion of opinion, and the cross-section of returns of U.S. financial stocks. Journal of Banking and Finance, 35(9), 2252–2266. https://doi.org/10.1016/j.jbankfin.2011.01.026
- Battalio, R., & Schultz, P. (2011). Regulatory uncertainty and market liquidity: The 2008 short sale ban’s impact on equity option markets. Journal of Finance, 66(6), 2013–2053. https://doi.org/10.1111/j.1540-6261.2011.01700.x
- Battalio, R., Mehran, H., & Schultz, P. (2012). Market declines: What is accomplished by banning short-selling? Current Issues in Economic and Finance, 18(5), 52012. https://www.newyorkfed.org/medialibrary/media/research/current_issues/ci18-5.html
- Beber, A., & Pagano, M. (2013). Short-selling bans around the world: Evidence from the 2007–09 crisis. Journal of Finance, 68(1), 343–381. https://doi.org/10.1111/j.1540-6261.2012.01802.x
- Bessler, W., & Vendrasco, M. (2021). The 2020 European short-selling ban and the effects on market quality. Finance Research Letter, 42, 101886. https://doi.org/10.1016/j.frl.2020.101886
- Boehmer, E., Jones, C. M., & Zhang, X. (2013). Shackling short sellers: The 2008 shorting ban. The Review of Financial Studies, 26(6), 1363–1400. https://doi.org/10.1093/rfs/hht017
- Bohl, M. T., Essid, B., & Siklos, P. L. (2012). Do short selling restrictions destabilize stock markets? Lessons from Taiwan. The Quarterly Review of Economics and Finance, 52(2), 198–206. https://doi.org/10.1016/j.qref.2012.02.001
- Cakici, N., Goswami, G., & Tan, S. (2018). Equity options during the shorting ban of 2008. Journal of Risk and Financial Management, 11(2), 1–13. https://doi.org/10.3390/jrfm11020017
- Charoenwong, C., Ding, D. K., & Jenwittayaroje, N. (2010). Price movers on the stock exchange of Thailand: Evidence from a fully automated order‐driven market. Financial Review, 45(3), 761–783. https://doi.org/10.1111/j.1540-6288.2010.00270.x
- Chen, H., Chen, Y., Lin, B., & Wang, Y. (2019). Can short selling improve internal control? An empirical study based on the difference-in-differences model. Accounting and Finance, 58(5), 1233–1259. https://doi.org/10.1111/acfi.12456
- Corte, D. P., Kosowski, R., & Rapanos, N. P. (2020). Short-selling bans in Europe: Evidence from the COVID-19 pandemic. In Working paper. Imperial College Business School; Centre for Economic Policy Research (CEPR).
- Crane, A. D., Crotty, K., Michenaud, S., & Naranjo, P. (2019). The causal effects of short-selling bans: Evidence from eligibility thresholds. The Review of Asset Pricing Studies, 9(1), 137–170. https://doi.org/10.1093/rapstu/ray004
- De Angelis, D., Grullon, G., & Michenaud, S. (2017). The effects of short-selling threats on incentive contracts: Evidence from an experiment. The Review of Financial Studies, 30(5), 1627–1659. https://doi.org/10.1093/rfs/hhw105
- Deng, X., Gao, L., & Kim, J. B. (2020). Short-sale constraints and stock price crash risk: Causal evidence from a natural experiment. Journal of Corporate Finance, 60, 101498. https://doi.org/10.1016/j.jcorpfin.2019.101498
- Diamond, D. W., & Verrecchia, R. E. (1987). Constraints on short-selling and asset price adjustment to private information. Journal of Financial Economics, 18(2), 277–311. https://doi.org/10.1016/0304-405X(87)90042-0
- Diether, K. B., Lee, K. H., & Werner, I. M. (2009). It’s SHO time! Short-sale price tests and market quality. Journal of Finance, 64(1), 37–73. https://doi.org/10.1111/j.1540-6261.2008.01428.x
- Duffie, D., Gârleanu, N., and Pedersen, L. H. (2002) Securities lending, shorting, and pricing. Journal of Financial Economics, 66 (2–3) 307–339 https://doi.org/10.1016/S0304-405X(02)00226-X
- Duffie, D., Gârleanu, N., & Pedersen, L. H. (2002). Securities lending, shorting, and pricing. Journal of Financial Economics, 66(2–3), 307–339.
- Fang, V. W., Huang, A. H., & Karpoff, J. M. (2016). Short selling and earnings management: A controlled experiment. Journal of Finance, 71(3), 1251–1294. https://doi.org/10.1111/jofi.12369
- Frino, A., Lecce, S., & Lepone, A. (2011). Short-sales constraints and market quality: Evidence from the 2008 short-sales bans. International Review of Financial Analysis, 20(4), 225–236. https://doi.org/10.1016/j.irfa.2011.04.001
- Geraci, M. V., Garbaravičius, T., & Veredas, D. (2018). Short selling in extreme events. Journal of Financial Stability, 39, 90–103. https://doi.org/10.1016/j.jfs.2018.09.004
- Goodell, J. W. (2020). COVID-19 and finance: Agendas for future research. Finance Research Letters, 35, 101512. https://doi.org/10.1016/j.frl.2020.101512
- Grundy, B. D., Lim, B., & Verwijmeren, P. (2012). Do option markets undo restrictions on short sales? Evidence from the 2008 short-sale ban. Journal of Financial Economics, 106(2), 331–348. https://doi.org/10.1016/j.jfineco.2012.05.013
- Harrison, J. M., & Kreps, D. (1978). Speculative investor behavior in a stock market with heterogeneous expectations. Quarterly Journal of Economics, 92(2), 323–336. https://doi.org/10.2307/1884166
- Hasan, I., Massoud, N., Saunders, A., & Song, K. (2015). Which financial stocks did short sellers target in the subprime crisis? Journal of Banking and Finance, 54(C), 87–103. https://doi.org/10.1016/j.jbankfin.2014.12.021
- Henry, T. R. (2019). Security price formation and informed trading with constrained short selling. Review of Quantitative Finance and Accounting, 53(1), 123–151. https://doi.org/10.1007/s11156-018-0745-2
- Hodgson, A., Lim, W. D., & Mi, L. (2018). Insider sales vs. short selling: Negative information trading in Australia. Pacific-Basin Finance Journal, 48(C), 72–83. https://doi.org/10.1016/j.pacfin.2017.12.009
- Hong, H., & Stein, J. C. (2007). Disagreement and the stock market. Journal of Economic Perspectives, 21(2), 109–128. .
- Hu, N., Lu, S., Ma, T., & Ye, J. (2020). Short-selling and cost of equity: Evidence from China. Accounting and Finance, 60(4), 3681–3707. https://doi.org/10.1111/acfi.12540
- Jones, C. M., & Lamont, O. A. (2002). Short-sale constraints and stock returns. Journal of Financial Economics, 66(2–3), 207–239. https://doi.org/10.1016/S0304-405X(02)00224-6
- Jones, C. M. (2012). Shorting restrictions: Revisiting the 1930s. Financial Review, 47(1), 1–35. https://doi.org/10.1111/j.1540-6288.2011.00319.x
- Karpoff, J. M., & Lou, X. (2010). Short sellers and financial misconduct. Journal of Finance, 65(5), 1879–1913. https://doi.org/10.1111/j.1540-6261.2010.01597.x
- Kizys, R., Tzouvanas, P., & Donadelli, M. (2021). From COVID-19 herd immunity to investor herding in international stock markets: The role of government and regulatory restrictions. International Review of Financial Analysis, 74, 101663. https://doi.org/10.1016/j.irfa.2021.101663
- Lee, E. (2016). Short selling and market mispricing. Review of Quantitative Finance and Accounting, 47(3), 797–833. https://doi.org/10.1007/s11156-015-0521-5
- Li, Z., Lin, B., Zhang, T., & Chen, C. (2018). Does short selling improve stock price efficiency and liquidity? Evidence from a natural experiment in China. The European Journal of Finance, 24(15), 1350–1368. https://doi.org/10.1080/1351847X.2017.1307772
- Marsh, I., & Payne, R. (2012). Banning short sales and market quality: The U.K.’s experience. Journal of Banking and Finance, 36(7), 1975–1986. https://doi.org/10.1016/j.jbankfin.2012.03.005
- Massa, M., Qian, W., Xu, W., & Zhang, H. (2015). Competition of the informed: Does the presence of short sellers affect insider selling? Journal of Financial Economics, 118(2), 268–288. https://doi.org/10.1016/j.jfineco.2015.08.004
- McKenziea, M., & and, O. T. H. (2012). The determinants of short selling: Evidence from the Hong Kong equity market. Accounting and Finance, 52(S1), 183–216. https://doi.org/10.1111/j.1467-629X.2011.00437.x
- Meng, Q., Li, X., Chan, K. C., & Gao, S. (2020). Does short selling affect a firm’s financial constraints? Journal of Corporate Finance, 60, 101531. https://doi.org/10.1016/j.jcorpfin.2019.101531
- Miller, E. M. (1977). Risk, uncertainty, and divergence of opinion. Journal of Finance, 32(4), 1151–1168. https://doi.org/10.1111/j.1540-6261.1977.tb03317.x
- Ni, X., & Zhu, W. (2016). Short-sales and stock price crash risk: Evidence from an emerging Market. Economics Letters, 144, 22–24. https://doi.org/10.1016/j.econlet.2016.04.029
- Ni, X., & Yin, S. (2020). The unintended real effects of short selling in an emerging market. Journal of Corporate Finance, 64, 101659. https://doi.org/10.1016/j.jcorpfin.2020.101659
- Nunn, S., & Kulam, A. 2021. Short-selling restrictions during COVID-19, program on financial stability: https://som.yale.edu/blog/short-selling-restrictions-during-covid-19
- Ortmann, R., Pelster, M., & Wengerek, S. T. (2020). COVID-19 and investor behavior. Finance Research Letters, 37, 101717. https://doi.org/10.1016/j.frl.2020.101717
- Phansatan, S., Powell, J. G., Tanthanongsakkun, S., & Treepongkaruna, S. (2012). Investor type trading behavior and trade performance: Evidence from the Thai stock market. Pacific-Basin Finance Journal 20(1), 1–23. https://doi.org/10.1016/j.pacfin.2011.07.004
- Purnanandam, A., & Seyhun, H. N. (2018). Do short sellers trade on private information or false information? Journal of Financial and Quantitative Analysis, 53(3), 997–1023. https://doi.org/10.1017/S0022109017001223
- Ranaldo, A. (2004). Order aggressiveness in limit order book markets. Journal of Financial Markets, 7(1), 53–74. https://doi.org/10.1016/S1386-4181(02)00069-1
- Siciliano, G., & Ventoruzzo, M. 2020 . Banning Cassandra from the market? An empirical analysis of short-selling bans during the covid 19 crisis. European Corporate Governance Institute Law Working Paper No. 532/2020, Bocconi Legal Studies Research Paper No. 3657375.
Appendix
Table A1. Sample stocks and size (in million Baht) in the treatment group and control group