
 ?Mathematical formulae have been encoded as MathML and are displayed in this HTML version using MathJax in order to improve their display. Uncheck the box to turn MathJax off. This feature requires Javascript. Click on a formula to zoom.
Abstract
This study investigates the effect of GATS, a service-specific trade agreement, on the survival of service exports from Kenya to 176 countries between 1995 and 2019. Services are classified at a 1-digit level: travel, transport, computer and information, construction, financial, insurance, government, other business, and personal, cultural, and recreational services. The discrete-time probit model with random effects reveals that GATS reduces the survival of service exports by 0.78%. At the category level, GATS only increases the survival of construction and government services. GATS also reduces the survival of Kenya’s exports to Africa when geographical regions are considered. However, GATS boosts the survival of services when it is interacted with the quality of institutions and the Services Trade Restrictiveness Index (STRI). Accordingly, reducing regulations and general improvement of the quality of institutions can help countries reap the benefits of a service-specific trade agreement fully.
1. Introduction
Trade agreements are primarily meant to enhance market access by reducing entry barriers in foreign markets (Baier et al., Citation2014; Cyrus, Citation2021). As a result, countries ratify trade agreements to improve their export volumes and ultimately grow their economies (Ossa, Citation2015). Most agreements liberalizing goods are well defined. However, those under services are often limited and do not guarantee significant liberalization (Fiorini & Hoekman, Citation2018; Lee, Citation2019) because the sector is highly regulated (Borchert et al., Citation2014). However, liberalization of the services sector is fast becoming inevitable (Hoekman and Njinkeu, Citation2017), starting with the General Agreement on Trade in Services (GATS) that was enacted in 1995.
Like most developing countries, Kenya has pursued trade agreements to raise its exports and economic growth (ROK, Citation2017; Majune and Mwania, Citation2020). The tenacity of signing trade agreements has particularly increased after 1993 which is recognized as Kenya’s moment of complete economic liberalization (Wacziarg & Welch, Citation2008). For instance, it joined the World Trade Organization (WTO) in 1995, subsequently establishing 36 bilateral trade agreements (Majune and Mwania, 2020) and becoming one of the first countries to sign and ratify the African Continental Free Trade Area (Abrego et al., Citation2020).
Comparing the pursuit of trade agreements to export performance, we deduce from that Kenya’s total exports (goods and services) have performed dismally. Especially under the liberalization policy, whose growth is not so different from the prior period. The highest growth rate is 31.5% which occurred in 1993. Since then, it has seldom surpassed 10%. This is unexpected, given that the country aims at attaining middle-income status by 2030 (ROK, Citation2007, ROK, Citation2018). Hence, there is a need to review trade policy, which is done in two ways in this study.
Figure 1. Growth of services, goods, and total (goods and services) exports in Kenya, 1975–2019.
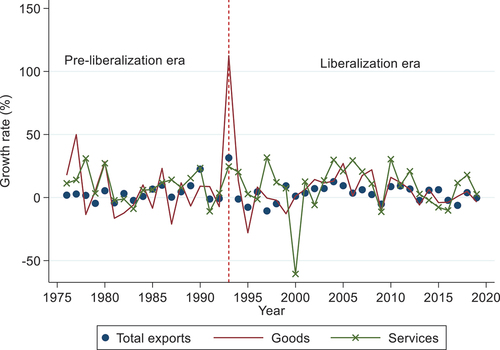
First, increasing attention on trade in services. According to , services have often grown faster than goods under the liberalization era. Kenya is also rated among the top five exporters of services in Africa (Ayoki, Citation2018). It has a comparative advantage in exporting services (Were & Odongo, Citation2019) and falls within a unique group of African countries whose share of services in total exports is above 30% (Hoffman et al., Citation2019). It also has a robust domestic services sector (Balistreri et al., Citation2015; Ngui & Kimuyu, Citation2018). These facts show Kenya’s potential in exporting services and they call for a shift in trade discourse that has mainly focused on goods.
Second, considering policies that improve the survival of service exports. Policies aligned to mainstream trade theory (absolute and comparative advantage, and Heckscher-Ohlin) primarily seek to have countries increase their market entry and participation in trade. Nevertheless, as proved by Besedeš and Prusa (Citation2006a), Besedeš & Prusa (Citation2006b) and Sabuhoro et al. (Citation2006), trade relationships are short-lived. Particularly in developing countries that create new trade relationships faster than developed countries but have slow export growth rates due to low survival rates (Besedeš & Prusa, Citation2011; Brenton et al., Citation2010). Conversely, high export growth rates of developed countries are credited to their high survival rates in their importing markets. Therefore, identifying factors that boost export survival may help policymakers of developing countries spur their long-term export growth rates, deepen existing trade relationships, and ultimately raise economic growth.
Export survival is the likelihood of consecutively exporting non-zero values of a product (service in our case) to a particular destination over some time (e.g., year). This concept has been studied in several countries from the perspective of goods: in the United States of America (Besedeš & Prusa, Citation2006a; Citation2006b), Germany (Nitsch, Citation2009), and developing countries (Carrère & Strauss-Kahn, Citation2017). It has been studied by Kinuthia (Citation2014), Chacha and Edwards (Citation2017), Majune et al. (Citation2020), and Türkcan et al. (Citation2022) in Kenya. A few studies have analyzed the export survival of services, often using firm-level data. For example, Ariu (Citation2016) in Belgium, Dzhumashev et al. (Citation2016) in India, Türkcan and Erkuş-Öztürk (Citation2020) in Turkey, and Farah et al. (Citation2021), Lupton et al. (Citation2021), and Getachew and Beamish (Citation2021) in Japan. Christen et al. (Citation2019) use Austrian firm-level data to study intensive and extensive margins in the service sector. The extensive margin captures changes in trade flows (value and quantity) arising from trading in new markets and new services/products, while the intensive margin tracks changes in the export flow of existing trade ties (Amador & Opromolla, Citation2013).Footnote1
The intensive margin is often related to export survival. The only difference is that the intensive margin evaluates the performance (value and volume) of existing export relationships at two points in time. In contrast, export survival measures the likelihood of these relationships remaining active in the intervening period (Besedeš & Prusa, Citation2011). Thus, in contrast to an intensive margin approach, which displays only the value and amount of exports, assessing export performance by survival shows the frailty (entry, exit, and churn) of business relationships.
In this study, we consider the role of GATS, which is a service-specific trade agreement, on the survival of services exported from Kenya. Services are analyzed at the one-digit level: travel; transport; computer and information; construction; financial; insurance; government services; other business services (OBS); and personal, cultural and recreational services. The study analyzes a discrete-time probit model with random effects on data ranging from 1995–2019.
The rest of this paper is organized as follows. Section 2 reviews the literature. Section 3 explains the empirical model, while section 4 describes data and presents preliminary results. Finally, section 5 is on empirical analysis and results, while section 6 concludes the study.
2. Literature review
2.1. Theoretical literature review
Canonical international trade theories, namely Absolute advantage theory, Comparative advantage theory, and Heckscher-Ohlin theory—mainly describe international trade and why and how it takes place. As explained by Geda (Citation2012), the Absolute advantage theory postulates that countries export commodities that they produce with less labour cost (possess absolute advantage) and import those whose labour cost is high (have absolute disadvantage). The Comparative advantage theory predicts that trade occurs between countries due to their respective opportunity costs (comparative production costs). Countries trade because of their differences in factor endowments according to the Heckscher-Ohlin theory. Nonetheless, these theories do not explain the survival and duration of trade. Instead, theoretical frameworks such as Search and Matching theory, the product cycle theory, and product switching theory are at the core of empirical debate on survival and duration of trade. Recently, Besedeš (Citation2013) and Besedeš et al. (Citation2016) have developed a model that relates trade liberalization with export survival.
Vernon’s (Citation1966) product cycle theory describes the stages in the evolution of a product. Initially, a developed country endowed with skilled labour and advanced technology, develops a product, then exports it to a less developed country. Over time, the product becomes widely accepted. Consequently, the less developed country learns and adopts the production technique. The less developed country has a lower cost of production (endowed with cheap labour, though less skilled) and so enjoys a comparative advantage in the production and export of the product. At this point, the developed country will react by developing a better version of the product or abandoning the product completely. This process is not instant but long-term, and may explain the disappearing and reappearing of a product. So, Vernon’s theory does not explain real life short-term trade relations (Besedeš & Prusa, Citation2006b; Hess & Persson, Citation2011).
The Search and Matching theory also explains export survival. Rauch and Watson (Citation2003) stipulate that a seller-buyer trade relationship goes through several stages. Buyers and sellers are not found in the same country but in different countries, thus searching and matching buyers with sellers is the first stage. When a buyer finds a seller, the latter begins to export their product, first in small quantities. The seller’s reliability determines whether the business relationship will grow deeper or halt. If the relationship stops, the buyer goes back to the re-matching stage, that is, finding another seller. According to Besedeš (Citation2008), if a buyer and a seller abandon a trade relationship soon, it is said to be brief. From the Search and Matching theory, the time that a trade relationship lasts is influenced by the cost of the search, level of information asymmetry, and the export volume at the beginning of the trade relationship.
Besedeš and Blyde (Citation2010) propose a product switching model stipulating that demand in foreign markets ensures export survival. Therefore, products (services) with negative demand in the foreign market are substituted. Those whose demand remains stable will continue to be traded. The product in question, the characteristics of the firm, and a product’s destination will determine whether a product is abandoned or added. Therefore, the duration of the trade relationship will depend on the possibility of introducing the product and the turn-over of the product in a foreign market.
Besedeš (Citation2013) and Besedeš et al. (Citation2016) model posits that liberalization of trade reduces the per-unit trade cost and effectively raises entry rates and enhances export survival. So, before a seller finds a dependable buyer-partner, the seller must be productive. The seller’s level of productivity, their set-up costs and per-unit trade costs influence the sellers’ likelihood of entering a foreign market. This model argues that the liberalization of trade cuts both set-up costs and per-unit trade costs. Resultantly, the trade relationships will increase and the duration of time they last will also increase. This model is closest to our study because trade liberalization can be through trade agreements.
2.2. Empirical literature review
Research on the export duration of services is scarce. The few existing articles are at firm-level and focus on the overall service sector in Belgium (Ariu, Citation2016), the information technology sector in India (Dzhumashev et al., Citation2016), the tourism sector in Turkey (Türkcan & Erkuş-Öztürk, Citation2020), and foreign subsidiaries in Japan (Farah et al., Citation2021; Getachew & Beamish, Citation2021; Lupton et al., Citation2021). Results of these studies generally suggest that the duration of exporting services is short but they are weak at explaining how service exports are affected by trade agreements.
Empirical evidence on the effect of trade agreements and export duration is majorly for goods. Besedeš and Blyde (Citation2010) is one of the seminal studies following this line of thought. The authors study the drivers of export survival in Latin America. They showed that countries that shared an FTA had a higher rate of export survival than those without. Evidence from Africa shows that intra-Africa trade cooperation enhances export survival (Kamuganga, Citation2012). However, the effect is more on deeper Economic Integration Agreements (EIAs) such as Monetary Unions (MUs), Common Markets (CMs), and Customs Unions (CUs) than shallow ones like Preferential Trade Areas (PTAs). Trading under the North American Free Trade Agreement (NAFTA) increased survival in Canada and the US but reduced it in Mexico (Besedeš, Citation2013). The author used two variables, NAFTA members and NAFTA in effect, to assess this effect. NAFTA in effect, an indicator of the duration of NAFTA membership by a country, reduced survival in all countries though insignificant in Canada.
Besedeš et al. (Citation2016), in a comprehensive study, derived the theoretical model linking export survival to liberalization and analysed the effect of EIAs in terms of their existence and trade relationships that start after an EIA has been implemented. The authors found that EIAs increased export survival, but the effect was positive for trade relationships that started before an EIA was formed. On the other hand, trade relationships that started after an EIA’s implementation were likely to die faster besides suffering a decline in their trade volumes.
Degiovanni et al. (Citation2017) advanced the study by Besedeš et al. (Citation2016) by focusing on Latin America. The latter study was based on 180 countries in the world. Degiovanni et al. (Citation2017) established that deeper EIAs increased export survival than shallow ones. Trade relationships that existed after a trade agreement was signed had a lower chance of ceasing, although it depended on the depth of an agreement. The effect of spells that existed before the creation of an agreement also differed by the depth of agreement. Using the methodology by Kohl et al. (Citation2016), the authors constructed an index of quality of trade agreements and established that high-quality agreements enhanced survival more than low-quality ones.
Oanh and Linh (Citation2019) introduced diversion effects of EIAs to this line of research. The authors used SITC 4-digit level data for 149 countries between 1962 and 2000. Two variables, exporter and importer outsider, were used to describe the diversion effect. Two variables, exporter and importer outsider, were used to describe the diversion effect. The exporter/importer outsider are relationships formed by exporters or importers with other partners other than the original partner. Hence, the effect of this new relationship on the hazard rate of the original relationship is the diversion effect. Probit results revealed that the exporter and importer outsider reduced export survival. Hence, new EIAs increased the failure rate of products exported/imported under existing EIAs and the effect was larger in manufacturing than in agricultural products.
At the country level, Türkcan and Saygılı (Citation2018) explored how EIAs affected Turkey’s export survival. The authors used four EIAs: Non-Reciprocal PTAs, PTAs, Free Trade Areas (FTAs), and CUs. Furthermore, they assessed the effect of each EIA by its existence, whether it was in effect between an importer and Turkey in a specific year, whether a trade relationship started after implementation of an EIA, and duration of an EIA was active. Similar to previous studies, it was found that EIAs increased the chance of a trade relationship surviving, particularly FTAs and PTAs. However, trade relationships that started after an agreement had been established were likely to die.
In the context of Kenya, Kinuthia (Citation2014) investigated the effect of EAC and COMESA agreements on the export survival of merchandise products. The author employed a Cox proportional hazard model on data spanning the period 1995–2010 and found that the two agreements had an insignificant effect on export duration in Kenya. Majune et al. (Citation2020) employed a logit model with random-effects, on data ranging from 1995 to 2016, to study the same question. The authors find that COMESA enhanced Kenya’s export survival, but the EAC agreement dampened it. AGOA, a non-reciprocal trade agreement, also improved Kenya’s export survival. At the micro-level, COMESA’s effect on export duration is positive but not significant, according to Chacha and Edwards (Citation2017), who analyzed customs transaction data from 2004–2013 using the Cox, and logit and probit fixed and random-effects models.
IOther factors that affect export survival are real GDP, shared border and language, exchange rate volatility, time-zone differences, distance, colonial history, and institutions. Since these are gravity variables, they can be obtained from survival studies (which are largely on goods; see, Araujo et al., Citation2016; Bista & Tomasik, Citation2017; Carrère & Strauss-Kahn, Citation2017; Huang, Citation2017; Kamuganga, Citation2012; Kinuthia, Citation2014) or bilateral service export studies (see, Fiorini & Hoekman, Citation2018; Guillin, Citation2013; Hellmanzik & Schmitz, Citation2016; Kimura & Lee, Citation2006; Mitra et al., Citation2018; Van der Marel & Shepherd, Citation2013).
3. Empirical model
Survival analysis is employed to establish factors that determine the duration of Kenya’s service exports. To understand survival analysis, we start by specifying the following life table estimator survival function:
where is a spell—the number of years a service is exported consecutively from Kenya to its trading partner. A spell lasts for a period
starting at
and ending at
(
for
).
which is the adjusted number of spells at risk of failure at the midpoint of the time interval, is presented as
where
is the number of relationships likely to fail at the beginning of the interval.
is the hazard rate which indicates the failure of a trade relationship (spell). Equation 1 only establishes the survival rate (hazard rate) of exporting a service from Kenya to another country. Hence, a discrete-time duration function needs to be specified to establish the effect of GATS and other covariates on the probability of exports surviving, as follows:
where measures Kenya’s
exports to country
at time
The model controls for fixed effects by including duration (
), spells (
) and time periods (
). F(.) is an appropriate distribution function ensuring that
ranges between 0 and 1 for all i, j, t. This study considered three commonly used distribution functions: logit, complementary log-log (clog-log) and probit. These functions fall within a class of discrete-time models proved by Hess and Persson (Citation2011, Citation2012) to be more suitable for duration analysis than the semi-parametric continuous-time Cox (Citation1972) proportional hazard model. The Continuous-time model suffers from unobserved heterogeneity (frailty), tied spells where relationships halt simultaneously, and the assumption of restrictive proportionality, which assumes that covariates have a uniform effect on the hazard rate over time.
Handling left and right censoring is a common problem in survival analysis. Left-censored export records are present in the first year of our data, but we do not know when they started. Conversely, right-censored records are active in the last year of our data, but we do not know when they will end. Failure to correct for left-censoring results in biased estimates (Hess & Persson, Citation2012). We address this bias by omitting the first year an export flow is recorded; we consider export flows from 1996 instead of 1995. Right censoring is less problematic in survival analysis (Brenton et al., Citation2010; Hess & Persson, Citation2012); therefore, we include trade records for 2019, the last year in our dataset, in our analysis. A dummy variable for multiple spells, which arise when an export relationship halts and then relapses during the study period, is included, in line with related studies (Besedeš & Prusa, Citation2006a; Fu et al., Citation2014; Majune et al., Citation2020).
is a vector containing product-specific characteristics—initial export value, lagged duration, and total export value—and Kenya-specific factors (Kenya’s GDP). The initial export value at the start of an export spell (the period a service is exported to a specific destination) and the lagged duration (the duration a previous spell lasted) are used to proxy for past experience. The total value of the exports of a service is also included to account for the effect of experience on export survival. Kenya’s GDP shows the effect of the domestic production capacity on survival.
s a vector containing destination-specific factors, namely, gravity factors (time zone differences, distance, common language, colony, and GATS), and macro-economic indicators (partner GDP, exchange rate, and financial development). Our variable of interest, GATS, is included to show the effect of service-specific integration on the survival of service exports. Other variables show how the survival of service exports from Kenya is affected by characteristics of the destination country.
is bilateral trade in goods. It shows the potential of a network effect from goods to services (Egger et al., Citation2017).
and
are vectors containing coefficients.
is the error term. More information about our variables is indicated in .
In general, a positive sign on the coefficient indicates an increase in the hazard rate but a negative sign means a decrease in the hazard rate.
4. Data and preliminary results
Data on bilateral services trade is gotten from the Extended Balance of Payments Services (EBOPS) of 2002 and 2010. EBOPS 2002 is hosted by the Organization for Economic Co-operation and Development (OECD) and it ranges from 1995–2012. EBOPS 2010 is hosted by the WTO and it ranges from 2013–2019. Therefore, we merge the two datasets to form one database for bilateral service trade ranging from 1995 to 2019. For the accuracy of data, we rely on import data reported by Kenya’s trade partner. This is often recommended, especially where the exporter is a developing country (Brenton et al., Citation2010; Carrère & Strauss-Kahn, Citation2017). Some recent studies have also applied EBOPS data: Xu and Kouwoaye (Citation2019), El-Sahli (Citation2020), and H. K. Nordås (Citation2018); H. Nordås (Citation2020), Fu et al. (Citation2020), Maurer (Citation2020), Visagie and Turok (Citation2021), and Tajoli et al. (Citation2021).
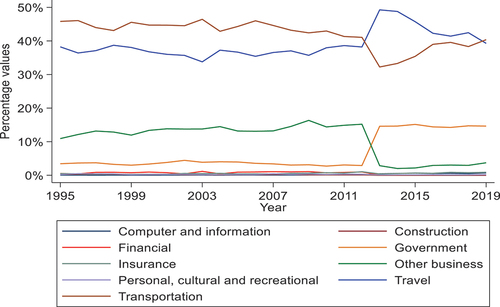
displays the trend of services that are exported from Kenya. Kenya by far mainly exports travel and transport services. The cumulative share of the two services ranged from 78% to 84% throughout our study period. Travel services dominated the country’s service exports between 1995 and 2012. However, they were surpassed by transportation services in 2013, whose ratio diminished to approximately 39% in 2019 and equivalent to travel services. Other business services were the third highest service export from Kenya until government services overtook them in 2013. Other business services are services such as legal, research, and development services. Government services are services offered by consulates and embassies, and military units and agencies. The remaining services accounted for about 2% of total service exports from Kenya.
Figure 2. Kenya’s service exports (1995–2019).
in the Appendix shows the top 10 trading partners of Kenya’s total and categories of services between 1995 and 2019. The USA was the primary recipient, accounting for 17% of Kenya’s total services exports, followed by the United Kingdom (UK), whose share was 14%. Other top ten importers were spread across Europe (Germany, France, Netherlands, Italy, and Switzerland) and Asia (Japan, India, and China). Cumulatively, about 59% of service exports from Kenya were to these top ten importers. The USA and the UK were also the leading importers of most services from Kenya except construction services. Intra-African trade is only strong for construction services where countries such as Mauritius and Ethiopia feature among the top ten destinations.
displays results of export survival in Kenya along with dynamics such as survival rate (after the first, tenth, fifteenth, and twenty-fifth year), the mean and median duration period in years, and the number of observations and spells for total and categories of services. We find that about 86% of service exports from Kenya survive beyond their first year of trading. Nearly 70% last for a decade and 68% exist to the 15th year. About 61% of services lasted for the entire period of our study (25 years). These rates are by far higher than those for goods whose first-year survival rate ranges between 48% and 39% (Chacha & Edwards, Citation2017; Majune et al., Citation2020). This is puzzling since services are expected to have a lower survival rate than goods (Ariu, Citation2016).
Table 1. Survival dynamics by total and categories of services in Kenya
Nonetheless, it could be influenced by the low level of disaggregation in our dataset compared to that of goods. Both Chacha and Edwards (Citation2017) and Majune et al. (Citation2020) use Harmonised System 6-digit product classification data, yet our data only classifies services at 1-digit. This means that 1-digit categories have fewer observations than the 6-digit and are likely to portray lower exit rates than the latter. The mean and median period of exporting services in Kenya is 16 years and 19 years, respectively.
The export survival of services by categories is displayed in the columns after total services in . We find that other business services have the highest survival rate across time. It is followed by transport, government and travel services respectively. Financial services have the highest survival rate of the remaining services, followed by insurance, personal, cultural, recreational, computer and information, and construction services. Computer and information, and construction services are the only categories whose survival rates fall below 50% during the analysis period. The hazard rate of computer and information service exports is 53% in the twenty-fifth year, while that of construction services is 90%. The mean duration of exporting services is highest in other business services (24 years) while computer and information, and construction services have the least duration period (9 years). The median duration of exporting services is shortest for construction services, 5 years, while services such as financial and travel have 25 years. Nonetheless, we have to reiterate that the survival rates and duration in years are higher than those of goods because our level of disaggregation is low. The mean and median export periods of goods in Kenya are 2.2 years and 1 year, respectively (Majune et al., Citation2020).
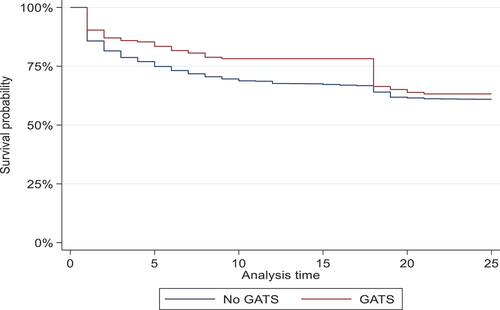
plots the Kaplan–Meier survival graph to show the survival rate of service exports by the presence of GATS. We find that trading with a partner who is a signatory of GATS boosts the survival of exports after the first year of trading by 91% as opposed to 86% if a partner is not a member of GATS. After the second year of trading, the survival rate is 87% and 82% for partners who are members of GATS and non-GATS members, respectively. The gap in survival between the two groups widens over time, especially between the fourth and sixteenth years of trading. The difference in survival in the twenty-fifth year is 3% in favor of GATS members. In general, trading under a service-specific trade agreement boosts export survival of services from Kenya.
Figure 3. Export survival by GATS.
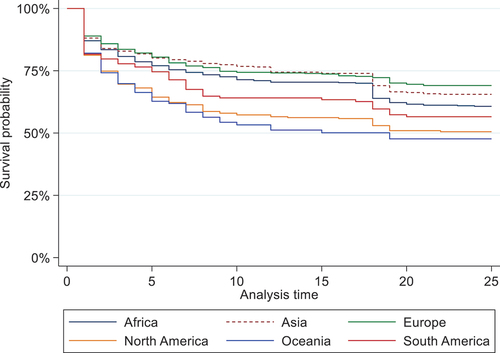
The survival of exports by geographical region is shown in . The highest first-year survival rate of service exports from Kenya is to Europe followed by Asia, Africa, Oceania, South America, and North America. The top rank of Europe and Asia affirms the findings of , whereby most top importers of Kenya’s services are from these regions: countries such as the UK, Germany, France, Japan, India, and China. also shows that export survival is highest in Europe, followed by Asia in the twenty-fifth year of trading. Africa, South America, North America, and Oceania follow in that order. Summary statistics of all variables are presented in in the Appendix.
Figure 4. Export survival by geographical region.
5. Empirical analysis and results
5.1. Baseline results
The first step of the analysis is identifying the appropriate discrete-time model for our study. displays regression results for logit, probit, and clog-log models. The dependent variable, the likelihood of a spell ending taking the value of 1 and 0 otherwise, is regressed on a set of country-specific (Kenyan and destination) variables along with other control variables. A positive sign on a coefficient indicates failure of an export relationship (increase in the hazard rate), while a negative coefficient signifies an increase in survival of an export relationship.
Table 2. Estimation results of the discrete-time hazard models with random effects
Frailty (importer–product random effects) is controlled in all the models. We find that the values and signs of the estimated coefficients (hazard rates) are qualitatively similar in all three specifications. However, we use the log-likelihood values to establish a suitable model. The log-likelihood values appear at the bottom of the table and the probit model has the largest value across the three models. This suggests that the probit model offers a better fit than the logit and clog-log models. The rho test statistic from is statistically significant, indicating that the probit random-effects model is appropriate for this study. Therefore, we interpret probit results for the rest of the paper.
displays the average marginal effects of the probit regression for total and nine categories of services. The first model indicates that GATS, a service-specific trade agreement, significantly reduces the survival of service exports from Kenya by 0.78%. This implies that trading with a country that is a signatory of GATS increases the chances of ceasing to export services to them. This result contradicts theoretical expectation (Besedeš, Citation2013; Besedeš et al., Citation2016) and empirical evidence by studies such as Degiovanni et al. (Citation2017) in Latin America.
Table 3. Probit regression marginal effects results by service
The result could suggest that GATS might be affected by the delay in negotiating services-related agreements that are often discussed after those of goods (Simo, Citation2020). This slows the speed of implementing agreements related to services. The result can also be attributed to the goods-trade network that has dominated the effect of trade agreements in services trade (Egger et al., Citation2017). Furthermore, restrictive domestic regulations overshadow the role of trade agreements for trade in services (Kern et al., Citation2019). This is the reason for introducing trade facilitation in section 5.2b.
As earlier indicated in , export survival varies by category of service. In this regard, results in reveal that GATS significantly increases the survival of construction and government services by 5.15% and 3.44%, respectively. Since the magnitude of the coefficients is larger for construction services, this result suggests that a service-specific trade agreement is likely to boost the sustainability of these services. We do not find evidence that GATS affects the survival of the remaining services.
Of the gravity variables, we find that distance, which often represents the cost of trading (Yotov et al., Citation2017), raises hazard rates of all services. The effect is statistically significant for total services and government services. A difference in time zones raises export survival of most services, mainly government services, with statistically significant coefficients. Using goods data, Bista and Tomasik (Citation2017) find that time zone differences boost the intensive margin of exports. As aforesaid, the intensive margin is closely related to export survival. However, the intensive margin evaluates the performance (i.e., value and volume) of existing export relationships at two points in time, while export survival measures the probability of these relationships remaining active in the intervening period (Besedeš & Prusa, Citation2011).
We also find that sharing a common language has no significant effect on the duration of service exports from Kenya but having a colonial relationship with a trading partner significantly improves the survival of construction. Kenya’s GDP portrays the country’s production capacity, while the importer’s GDP indicates the level of demand for Kenya’s services abroad (Yotov et al., Citation2017). The latter has the expected sign of reducing the failure rate of services exported from Kenya when demand in destination markets grows. This excludes transport services whose survival declines when the GDP of Kenya’s trading partners grows. The unexpected adverse effect of the importer’s GDP on export survival has also been established in goods by Hess and Persson (Citation2011). Growth in Kenya’s GDP boosts survival of total, computer and information services, and personal, cultural, and recreational services. Conversely, it reduces the survival rates of transport, construction, financial, and government services.
Financial development and exchange rate are the other macroeconomic factors of our independent variables. Financial development is an index that was constructed using the Principal Component Analysis (PCA) method. Following related studies (Sahoo & Dash, Citation2014, Citation2017), we developed the financial development indicator from domestic credit to the private sector by banks (% of GDP), broad money (% of GDP), domestic credit provided by the financial sector (% of GDP) and domestic credit to the private sector (% of GDP). These variables had a high correlation amongst themselves (at least 0.76), prompting us to conduct a PCA. As expected, the financial development of a destination country boosts the survival of most service exports from Kenya. Specifically, total, financial and personal, cultural, and recreational services whose coefficients are significant.
The coefficient of the percentage change in the real exchange rate in is statistically significant for most services and is correctly signed (an increase in the index indicates appreciation). This finding suggests that an appreciation of the importer’s currency decreases the survival of service exports from Kenya. Conversely, exporting goods improves the survival of total, construction, and insurance services from Kenya.
All product-specific variables have the expected impact on the survival of most services. In particular, the initial export value and lagged duration are found to be negatively associated with the hazard rate, which confirms our prediction that export relationships tend to last longer as exporters gain experience, knowledge, and trust over time (Besedeš & Prusa, Citation2006b; Hess & Persson, Citation2011; Rauch & Watson, Citation2003). The total value of the exports of a service is also included to account for the effect of experience on export duration. The variable is expected to boost survival (Hess & Persson, Citation2011; Stirbat et al., Citation2015). We find a negative relationship between the hazard rate and the total value of the exports for total and construction services. However, the effect is positive for insurance and personal, cultural, and recreational services, indicating that these variables do not benefit from experience.
5.2. Additional analysis
Additional duration analyses is performed in this section to establish whether our results change by geographical region and trade facilitation.
5.2.1. Export survival by geographical regions
displays results of the survival of overall services by geographical regions. GATS, which is our target variable, only affects trade within Africa. We find that the presence of GATS within Africa reduces the survival of Kenya’s service exports to the continent by 1.3%. This result could be of concern to policymakers engaged in the negotiations of the African Continental Free Trade Area (AfCFTA), which is meant to boost intra-Africa trade in goods and services (Abrego et al., Citation2020). Perhaps identifying factors that boost Kenya’s service trade could be of help. According to column one, Kenya’s service exports in Africa are boosted by the GDP of the importer, the presence of a colonial relationship with an African country, and product-specific characteristics (initial export value, lagged duration, and total export value). The elasticity is highest for trade with a country that shares a colonial relationship (1.27%). Initial export value has the biggest coefficient (0.47%) among product characteristics, suggesting that a sizeable initial export value reduces the degree of uncertainty in a trade relationship, thereby boosting its sustainability. Time Zone Differences increases the hazard rate of service that is exported in Africa from Kenya.
Table 4. Probit regression marginal effects results by geographical regions
Export survival of services from Kenya to Asia is boosted by GDP (for Kenya and Asian economies), level of financial development in Asia, and the total export value. Nonetheless, sharing a language and colonizer with an appreciation of the exchange rate dampens the survival of services from Kenya to Asia. Survival of services to Europe is boosted by merchandise trade, the initial export value, and the total export value. Results of these product-specific characteristics indicate the importance of experience in boosting trade in Europe. The exchange rate determines the survival of services in North America. A similar result was established by Majune et al. (Citation2020) for trade in goods to North America. Product-specific characteristics—initial and total export value—also determine the survival of services in North America. These Product-specific factors also determine the survival of services from Kenya to Oceanic countries.
5.2.2. Export survival by trade facilitation indicators
Trade facilitation—costs associated with infrastructural, policy and procedures that can be improved in order to ensure efficiency in trade across the borders—was also analysed to establish its effect on overall service survival in Kenya. This analysis was done by interacting GATS, our variable of interest, with the quality of institutions, STRI, mobile subscriptions, fixed telephone subscriptions, and the level of internet access. The first two factors represent soft indicators of trade facilitation while the latter variables denote its hard indicators.
The quality of institutions was computed using the PCA method, which produced a single index from all six factors of the World Governance Indicators (Kaufmann et al., Citation2011). The flow of services from Kenya to partner countries is expected to increase when the quality of institutions improves in the destination. Data on the quality of institutions was from the World Governance Indicators database. Data for mobile subscriptions, defined as mobile cellular subscriptions (per 100 people), was obtained from the World Development Indicators (WDI) database. Data for internet access, which represents the share of individuals using the internet in a country, was obtained from WDI. Data for fixed telephone subscriptions was also gotten from WDI.
Some service-specific studies have applied STRI—Benz et al. (Citation2020), Van der Marel and Shepherd (Citation2020), and H. Nordås (Citation2020)—to proxy for trade facilitation. It is expected that an increase in the index in the destination, which implies more restrictions, reduces the survival of Kenya’s service exports to the importer country. Nonetheless, only 54 countries had STRI records in our database, which massively reduced the number of observations in our data, as shown in . Since we only use total services in this analysis, we modified data in the following ways to obtain an indicator for STRI by trading partners. We first calculated a simple average of STRI across destinations for the years 2008–2011 and 2016. The 54 countries either had data for 2008–2011 or 2016. Since this was shorter than our period (1995–2019), we then calculated a single indicator (by country) to signify STRI. Hence, STRI is time-invariant in our study.
Table 5. Probit regression marginal effects results for trade facilitation indicators
Results in indicate that improving the quality of institutions and STRI under GATS significantly boosts the survival of services from Kenya by 0.43% and 7.2%, respectively. However, we find that all the hard indicators of trade facilitation—mobile subscriptions, fixed telephone subscriptions, and the level of internet access—do not significantly affect the survival of services exports in Kenya under GATS. Therefore, these results indicate that soft indicators of trade facilitation have a higher effect on the survival of service exports in Kenya, other than hard indicators, when a service-specific trade agreement like GATS is in operation.
6. Conclusion
Using trade data for the period 1995–2019, this study has analyzed the effect of GATS, a service-specific trade agreement, on the survival of service exports from Kenya to 176 countries. Services are classified at a 1-digit level: travel, transport, computer and information, construction, financial, insurance, government, other business, and personal, cultural, and recreational services.
Preliminary results reveal that about 86% of service exports from Kenya survive beyond the first year of trading. Nearly 70% last for a decade, 68% exist to the 15th year and about 61% of services are traded for the entire study period (25 years). The mean and median period of exporting services in Kenya is 16 years and 19 years respectively. When service categories were considered, we find that other business services have the highest survival rate across time. They are followed by transport, government and travel services respectively. Financial services have the highest survival rate of the remaining services followed by insurance, personal, cultural, and recreational, computer and information, and construction services.
Based on the probit model with random effects, we observe that GATS reduces the survival of service exports from Kenya by 0.78%. At the category level, GATS only increases the survival of construction and government services. GATS also reduces Kenya’s service export survival to Africa. However, GATS boosts the survival of services when it is interacted with the quality of institutions and STRI. Accordingly, reducing regulations and general improvement of the quality of institutions can help countries reap the benefits of a service-specific trade agreement fully. Other policies should target the simultaneous promotion of trade policies on goods and services, maintenance of a stable macroeconomy—especially GDP and exchange rate—and enhancing the capacity of firms to diversify their services and markets, and overall experience abroad.
A fundamental shortcoming of this study is the use of data that is less disaggregated. As aforesaid, the rate of survival of our services was greater than that of goods mainly because our services data is at 1-digit classification yet services are expected to have lower survival rates than goods (Ariu, Citation2016). Nonetheless, we note that getting a reliable data set on services is challenging, particularly in developing countries.
Disclosure statement
No potential conflict of interest was reported by the author(s).
Additional information
Funding
Notes
1. Different definitions of extensive and intensive margins exist depending on whether the analysis is at the micro or macro level (refer to Creusen et al. (Citation2011) for details).
References
- Abrego, L., de Zamaróczy, M., Gursoy, T., Issoufou, S., Nicholls, G. P., Perez-Saiz, H., & Rosas, J.-N. (2020). The African Continental free trade area: Potential economic impact and challenges. International Monetary Fund.
- Amador, J., & Opromolla, L. D. (2013). Product and destination mix in export markets. Review of World Economics, 149, 23–24. https://doi.org/10.1007/s10290-012-0136-z
- Araujo, L., Mion, G., & Ornelas, E. (2016). Institutions and export dynamics. Journal of International Economics, 98, 2–20. https://doi.org/10.1016/j.jinteco.2015.08.004
- Ariu, A. (2016). Services versus goods trade: A firm-level comparison. Review of World Economy, 152(1), 19–41. https://doi.org/10.1007/s10290-015-0230-0
- Ayoki, M. (2018). Recent trends in Africa’s services trade (working paper 61). Kampala: Institute of Policy Research and Analysis.
- Baier, S., Bergstrand, J., & Feng, M. (2014). Economic integration agreements and the margins of international trade. Journal of International Economics, 93(2), 339–350. https://doi.org/10.1016/j.jinteco.2014.03.005
- Balistreri, E. J., Jensen, J., & Tarr, D. (2015). What determines whether preferential liberalization of barriers against foreign investors in services are beneficial or immizerising: Application to the case of Kenya. Economics: The Open-Access, Open-Assessment E-Journal, 9(42), 1–134. https://doi.org/10.5018/economics-ejournal.ja.2015-42
- Benz, S., Ferencz, J., & Nordås, H. (2020). Regulatory barriers to trade in services: A new database and composite indices. The World Economy, 43(11), 2860–2879. https://doi.org/10.1111/twec.13032
- Besedeš, T., & Prusa, T. (2006a). Ins, outs, and the duration of trade. Canadian Journal of Economics/Revue Canadienne D’économique, 39(1), 266–295. https://doi.org/10.1111/j.0008-4085.2006.00347.x
- Besedeš, T., & Prusa, T. J. (2006b). Product differentiation and duration of US import trade. Journal of International Economics, 70(2), 339–358. https://doi.org/10.1016/j.jinteco.2005.12.005
- Besedeš, T. (2008). A search cost perspective on formation and duration of trade. Review of International Economics, 16(5), 835–849. https://doi.org/10.1111/j.1467-9396.2008.00752.x
- Besedeš, T., & Blyde, J. (2010). What drives export survival? An analysis of export duration in latin America. Inter-American Development Bank, mimeo.
- Besedeš, T., & Prusa, T. J. (2011). The role of extensive and intensive margins and export growth. Journal of Development Economics, 96(2), 371–379. https://doi.org/10.1016/j.jdeveco.2010.08.013
- Besedeš, T. (2013). The role of NAFTA and returns to scale in export duration. CESifo Economic Studies, 59(2), 306–336. https://doi.org/10.1093/cesifo/ifs001
- Besedeš, T., Moreno-Cruz, J., & Nitsch, V. (2016). Trade Integration and the Fragility of Trade Relationships: Theory and Empirics (Georgia Tech Working Paper). Georgia Institute of Technology. https://business.und.edu/undergraduate/economics-and-finance/_files/docs/_spring_2017_papers/besedes-eia.pdf
- Bista, R., & Tomasik, R. (2017). Time zone effect and the margins of exports. The World Economy, 40(6), 1053–1067. https://doi.org/10.1111/twec.12415
- Borchert, I., Gootiiz, B., & Mattoo, A. (2014). Policy barriers to international trade in services: Evidence from a new database. The World Bank Economic Review, 28(1), 162–188. https://doi.org/10.1093/wber/lht017
- Brenton, P., Saborowski, C., & Uexkull, V. E. (2010). What explains the low survival rate of developing country export flows? The World Bank Economic Review, 24(3), 474–499. https://doi.org/10.1093/wber/lhq015
- Carrère, C., & Strauss-Kahn, V. (2017). Export survival and the dynamics of experience. Review of World Economics, 153(2), 271–300. https://doi.org/10.1007/s10290-017-0277-1
- Chacha, P. W., & Edwards, L. (2017). The growth dynamics of new export entrants in Kenya:A survival analysis (working paper 712). Economic Research Southern Africa.
- Christen, E., Pfaffermayr, M., & Wolfmayr, Y. (2019). Decomposing service exports adjustments along the intensive and extensive margin at the firm‐level. Review of International Economics, 27(1), 155–183. https://doi.org/10.1111/roie.12365
- Cox, D. R. (1972). Regression models and life-tables. Journal of the Royal Statistical Society. Series B (Methodological), 34(2), 187–220. https://doi.org/10.1111/j.2517-6161.1972.tb00899.x
- Creusen, H., Kox, H., Lejour, A., & Smeets, R. (2011). Exploring the margins of Dutch exports: A firm-level analysis. De Economist, 159(4), 413–434. https://doi.org/10.1007/s10645-011-9172-7
- Cyrus, T. (2021). Why do countries form regional trade agreements? A discrete-Time survival analysis. Open Economies Review, 32(2), 417–434. https://doi.org/10.1007/s11079-020-09603-5
- Degiovanni, P., Florensa, L., & Recalde, M. (2017). Latin American integration effects on trade relationships: Survival, growth and initial volume. Journal of Applied Economic Sciences, 7(53), 2129–2142. http://cesmaa.org/Docs/JAES%20Winter%20XII%207(53)2017_%20online.pdf#page=111
- Dzhumashev, R., Mishra, V., & Smyth, R. (2016). Exporting, R&D investment and firm survival in the Indian IT sector. Journal of Asian Economics, 42, 1–19. https://doi.org/10.1016/j.asieco.2015.10.002
- Egger, P., Francois, J., & Nelson, D. (2017). The role of goods‐trade networks for services‐trade volume. The World Economy, 40(3), 532–543. https://doi.org/10.1111/twec.12331
- El-Sahli, Z. (2020). Submarine cables, the internet backbone and the trade in services (Research Paper 2020/05). Nottingham: University of Nottingham.
- Farah, B., Elias, R., Chakravarty, D., & Beamish, P. (2021). Host country corporate income tax rate and foreign subsidiary survival. Journal of World Business, 56(2), 101186. https://doi.org/10.1016/j.jwb.2020.101186
- Fiorini, M., & Hoekman, B. (2018). Trade agreements, regulatory institutions and services liberalization. Global Policy, 9(4), 441–450. https://doi.org/10.1111/1758-5899.12583
- Fu, D., & Wu, Y. (2014). Export survival pattern and its determinants: An empirical study of Chinese manufacturing firms. Asian‐pacific Economic Literature, 28(1), 161–177.
- Fu, D., Chen, Y., & Zhang, Y. (2020). Linder hypothesis revisited: Does it hold for services trade? Economics Letters, 195, 109469. https://doi.org/10.1016/j.econlet.2020.109469
- Geda, A. (2012). Fundamentals of international economics for developing Countries: A focus on Africa. African Economic Research Consortium.
- Getachew, Y., & Beamish, P. (2021). Unbundling the effects of host-country institutions on foreign subsidiary survival: A case for subsidiary heterogeneity. Journal of World Business, 56(4), 101226. https://doi.org/10.1016/j.jwb.2021.101226
- Guillin, A. (2013). Trade in services and regional trade agreements: Do negotiations on services have to be specific? The World Economy, 36(11), 1406–1423. https://doi.org/10.1111/twec.12102
- Hellmanzik, C., & Schmitz, M. (2016). Gravity and international services trade: The impact of virtual proximity. European Economic Review, 77, 82–101. https://doi.org/10.1016/j.euroecorev.2015.03.014
- Hess, W., & Persson, M. (2011). Exploring the duration of EU imports. Review of World Economics, 147(4), 665–692. https://doi.org/10.1007/s10290-011-0106-x
- Hess, W., & Persson, M. (2012). The duration of trade revisited. Empirical Economics, 43(3), 1083–1107. https://doi.org/10.1007/s00181-011-0518-4
- Hoekman, B., & Njinkeu, D. (2017). Integrating Africa: Some trade policy research priorities and challenges. Journal of African Economies, 26(2), ii12–ii39. https://doi.org/10.1093/jae/ejx031
- Hoffman, B., Mckenna, M., & Sáez, S. (2019). Valuing Services Trade within Africa. In C. H. Hollweg & S. Sáez (Eds.), Services for trade competitiveness: country and regional assessments of services trade (pp. 159–177). The World Bank Group.
- Huang, X. (2017). Exchange rate movements and export market dynamics: Evidence from China. Economics: The Open-Access, Open-Assessment E-Journal, 11(23), 1–27. https://doi.org/10.5018/economics-ejournal.ja.2017-23
- Jenkins, S. (2005). Survival analysis (The Lecture Notes Manuscript). Institute for Social and Economic Research. University of Essex.
- Kamuganga, D. N. (2012). Does intra-Africa regional trade cooperation enhance Africa’s export survival? Geneva: Graduate Institute of International and Development Studies Working Paper, No. 16/2012.
- Kaufmann, D., Kraay, A., & Mastruzzi, M. (2011). The worldwide governance indicators: Methodology and analytical issues. Hague Journal on the Rule of Law, 3(2), 220–246. https://doi.org/10.1017/S1876404511200046
- Kern, M., Paetzold, J., & Winner, H. (2019). Cutting red tape for trade in services (WIFO Working Papers, No. 584). Vienna, Austria: Austrian Institute of Economic Research (WIFO - Österreichisches Institut für Wirtschaftsforschung).
- Kimura, F., & Lee, -H.-H. (2006). The gravity equation in international trade in services. Review of World Economics, 142(1), 92–121. https://doi.org/10.1007/s10290-006-0058-8
- Kinuthia, B. (2014). Export duration and determinants of exports survival in Kenya. Trade discourse in Kenya: Some topical issues volume 2. University of Nairobi Press.
- Kohl, T., Brakman, S., & Garretsen, H. (2016). Do trade agreements stimulate international trade differently? Evidence from 296 trade agreements. The World Economy, 39(1), 97–131. https://doi.org/10.1111/twec.12272
- Lee, W. (2019). Services liberalization and global value chain participation: New evidence for heterogeneous effects by income level and provisions. Review of International Economics, 27(3), 888–915. https://doi.org/10.1111/roie.12402
- Lupton, N., Behnam, D., & Jiménez, A. (2021). Taking advantage of institutional weakness? Political stability and foreign subsidiary survival in primary industries. Multinational Business Review, 29(4), 501–521. https://doi.org/10.1108/MBR-02-2020-0043
- Majune, S. K., Moyi, E., & Kamau, G. J. (2020). Explaining export duration in Kenya. South African Journal of Economics, 88(2), 204–224. https://doi.org/10.1111/saje.12243
- Majune, S. K., & Kimuli, M. D. (2020). Pragmatic history of economic thought: Explaining trade practices and policies in Kenya. Tanzanian Economic Review, 10(1), 123–138.
- Maurer, A. (2020). Overview on available trade statistics and tools to assess trade in services. Trade, Law and Development, 12(1), 109–130. https://heinonline.org/HOL/Page?handle=hein.journals/traladpt12&div=7&g_sent=1&casa_token=&collection=journals
- Mitra, D., Pham, C., & Bandyopadhyay, S. (2018). Terrorism and international air travel: A gravity approach. The World Economy, 41(11), 2852–2882. https://doi.org/10.1111/twec.12680
- Ngui, D., & Kimuyu, P. (2018). Prospects for information and communications technology-Enabled services in Kenya: The case of the mobile money transfer industry. In R. S. Newfarmer, J. Page, & F. Tarp (Eds.), Industries without smokestacks: Industrialization in Africa reconsidered (pp. 213–231). Oxford University Press.
- Nitsch, V. (2009). Die another day: Duration in German import trade. Review of World Economics, 145(1), 133–154. https://doi.org/10.1007/s10290-009-0008-3
- Nordås, H. K. (2018). What drives trade in services? Lessons from the Nordics. Applied Economics, 50(33), 3532–3545. https://doi.org/10.1080/00036846.2018.1430334
- Nordås, H. (2020). Telecommunications: The underlying transport means for services exports. Trade, Law and Development, 12(1), 158–187. https://heinonline.org/HOL/Page?handle=hein.journals/traladpt12&div=9&g_sent=1&casa_token=&collection=journals
- Oanh, N. T., & Linh, D. T. (2019). Diversion effect of economic integration agreements. VNU Journal of Science: Economics and Business, 35(5E), 28–41. https://doi.org/10.25073/2588-1108/vnueab.4291
- Ossa, R. (2015). Why trade matters after all. Journal of International Economics, 97(2), 266–277. https://doi.org/10.1016/j.jinteco.2015.07.002
- Rauch, J. E., & Watson, J. (2003). Starting small in an unfamiliar environment. International Journal of Industrial Organization, 21(7), 1021–1042. https://doi.org/10.1016/S0167-7187(03)00018-3
- ROK. (2007). Kenya Vision 2030. Nairobi, Kenya: Government Printers.
- ROK. (2017). National trade policy: Transforming Kenya into a competitive export-Led and efficient domestic economy. Government Printers.
- ROK. (2018). THIRD MEDIUM TERM PLAN (2018 – 2022): Transforming lives: Advancing socio-economic development through the “Big Four”. Republic of Kenya.
- Sabuhoro, J. B., Larue, B., & Gervais, Y. (2006). Factors determining the success or failure of Canadian establishments on foreign markets: A survival analysis approach. The International Trade Journal, 20(1), 33–73. https://doi.org/10.1080/08853900500467974
- Sahoo, P., & Dash, R. K. (2014). India’s surge in modern services exports: Empirics for policy. Journal of Policy Modeling, 36(6), 1082–1100. https://doi.org/10.1016/j.jpolmod.2014.10.006
- Sahoo, P., & Dash, R. K. (2017). What drives India’s surge in service exports? The World Economy, 40(2), 439–461. https://doi.org/10.1111/twec.12411
- Simo, R. Y. (2020). Trade in services in the African Continental free trade area: Prospects, challenges and WTO compatibility. Journal of International Economic Law, 23(1), 65–95. https://doi.org/10.1093/jiel/jgz031
- Stirbat, L., Record, R., & Nghardsaysone, K. (2015). The experience of survival: Determinants of export survival in lao PDR. World Development, 76, 82–94. https://doi.org/10.1016/j.worlddev.2015.06.007
- Tajoli, L., Airoldi, F., & Piccardi, C. (2021). The network of international trade in services. Applied Network Science, 6(68), 1–25. https://doi.org/10.1007/s41109-021-00407-1
- Türkcan, K., & Saygılı, H. (2018). Economic integration agreements and the survival of exports. Journal of Economic Integration, 33(1), 1046–1095. https://doi.org/10.11130/jei.2018.33.1.1046
- Türkcan, K., & Erkuş-Öztürk, H. (2020). The impact of economic and political crises on the survival of tourism-related firms: Evidence from Antalya. Tourism Economics, 26(7), 1152–1174. https://doi.org/10.1177/1354816619868614
- Türkcan, K., Majune, S., & Moyi, E. (2022). Export margins and survival: A firm‐level analysis using Kenyan data. South African Journal of Economics, 90(2), 149–174. https://doi.org/10.1111/saje.12314
- van der Marel, E., & Shepherd, B. (2013). Services trade, regulation and regional integration: Evidence from sectoral data. The World Economy, 36(11), 1393–1405. https://doi.org/10.1111/twec.12083
- van der Marel, E., & Shepherd, B. (2020). Trade facilitation in services: Concepts and empirical importance (Working Paper 9234). Washington, D.C.: World Bank.
- Vernon, R. (1966). International investment and international trade in the product cycle. The Quarterly Journal of Economics, 80(2), 190–207. https://doi.org/10.2307/1880689
- Visagie, J., & Turok, I. (2021). The contribution of services to international trade in Southern Africa. Development Southern Africa, 38(1), 21–38. https://doi.org/10.1080/0376835X.2020.1834351
- Wacziarg, R., & Welch, K. H. (2008). Trade liberalization and growth: New evidence. The World Bank Economic Review, 22(2), 187–231. https://doi.org/10.1093/wber/lhn007
- Were, M., & Odongo, M. (2019). Competitiveness and diversification of service exports in Sub-Saharan Africa: The case of the East African community (Working Paper 2019/89). Helsinki, Finland: UNU-WIDER.
- Xu, A., & Kouwoaye, A. R. (2019). How do natural disasters affect services trade? (WTO Staff Working Paper, No. ERSD-2019-12). Geneva: World Trade Organization.
- Yotov, Y., Piermartini, R., Monteiro, J.-A., & Larch, M. (2017). An advanced guide to trade policy analysis: The structural gravity model. UNCTAD and WTO.
Appendix
Table A1. Variable definition, measurement and source
Table A2. Leading destinations of service exports from Kenya, 1995 to 2019
Table A3. Summary statistics