
 ?Mathematical formulae have been encoded as MathML and are displayed in this HTML version using MathJax in order to improve their display. Uncheck the box to turn MathJax off. This feature requires Javascript. Click on a formula to zoom.
Abstract
Many developing countries, like Indonesia, struggle with tax evasion. It reduces government revenues, impeding government activities and a country’s economic development. In this study, we look at the topic of tax evasion in Indonesia from 1980 to 2019. Using the “modified-cash-deposit-ratio” technique, we estimate the scale of tax evasion in Indonesia. We specifically calculate the loss in tax revenue caused by Indonesia’s shadow economy. Using a variety of estimators, we then evaluate whether financial development can eliminate tax evasion. To estimate the long-run model for Indonesian tax evasion, we used Ordinary Least Squares with robust standard error (OLS-robust), Autoregressive Distributed Lag (ARDL), Dynamic OLS (DOLS), and Robust Least Squares-M-Estimation (RLE-ME). Our findings reveal that there is a non-linear long-run link between tax evasion and financial development in Indonesia, with an inverted U-shape curve indicating that a lower (higher) level of financial development corresponds to a higher (lower) level of tax evasion. An important policy implication is that the Indonesian government and the Central Bank of Indonesia should embark on programmes to increase financial inclusion, provide easy access to credit arrangements and financial facilities, and implement information technology-based financial systems capable of transmitting data to tax authorities.
Public interest statement
Tax evasion has important economic implications. It reduces government revenues, impedes government activities, and disrupts economic development. In many developing countries like Indonesia, the level of financial sector development tends to have a negative relationship with tax evasion. Using tax evasion data from 1980 to 2019, our study finds that a lower (higher) level of financial development corresponds to a higher (lower) level of tax evasion.
This finding suggests that economic authorities should participate in financial sector development to minimize tax evasion. The Indonesian government and central bank should facilitate programs to increase financial inclusion, provide easy access to credit and financial facilities, and implement an information technology system that strengthens the government tax database.
1. Introduction
Many governments face difficulties in combating tax evasion. The government faces significant economic consequences as a result of the loss of tax revenue (Cerqueti & Coppier, Citation2011), as it is unable to offer public services and other facilities that would have benefited society (Johnson et al., Citation2000). Substantial amounts of tax evasion imply that a country has a big shadow economy (Fuest & Riedel, Citation2009). Many enterprises in the shadow economy aim to remain tiny in order to avoid paying taxes, while some are able to decrease their tax burden through the use of attorneys, accountants, and bribery or other forms of corruption (Lopez, Citation2017). According to Quintin (Citation2008), industrialised countries have a more effective judicial system and more regulatory enforcement than developing ones, which explains why the shadow economy is relatively small in wealthy countries. According to Franzoni (Citation1998), the loss of tax revenue jeopardises the government’s ability to cover essential expenses and carry out its tasks.
In truth, tax evasion is a prevalent practise throughout the world. Worldwide tax evasion totaled USD3.1 trillion in 2011, accounting for around 5.1 percent of global GDP, according to The Tax Justice Network (Citation2011). In terms of tax evasion, Indonesia ranks second among the ASEAN-5 countries, after Thailand, with USD 17.8 billion (USD 25.8 billion). According to the paper, the loss from tax evasion activity arises as a result of shadow economic operations that exist in all economies as well as tax haven activity. Tax haven countries are those that have low or no tax rates on certain types of income, a lack of transparency, bank secrecy, a lack of information exchange, and no economic activity required for a business to achieve legal existence (Gravelle, Citation2015). According to Zucman (Citation2013), bank deposits in Switzerland account for almost one-third of the global stock of household offshore wealth, with a portion of this wealth escaping home country taxation (offshore tax evasion). According to Johannesen (Citation2014), the vast majority of this money is owned by the very wealthiest households and largely escapes taxation. Banks in tax haven countries with stringent bank secrecy requirements often do not declare the investment income received by their clients to the tax authorities, allowing them to avoid paying taxes.
Several academics have evaluated the possible revenue losses to the government as a result of Indonesia’s shadow economy. According to Nizar and Purnomo (Citation2011), the Indonesian shadow economy accounted for around 6% of GDP from 2000 to 2009, but the tax loss was less than 1% of GDP. Tatariyanto (Citation2014) calculated the size of Indonesia’s shadow economy using two unique approaches. Using the tax audit approach, the extent of the shadow economy ranged from 0.7 percent to 3.4 percent of GDP from 1996 to 2008. According to the “multiple indicators and multiple causes” (MIMIC) technique, the extent of Indonesia’s shadow economy ranged from 15.1 percent to 30.5 percent of GDP from 2000 to 2008. On average, prospective tax losses are estimated to be 3.8 percent of GDP. According to Azwar and Mulyawan (Citation2017), between 2011 and 2015, the shadow economy accounted for 22.1 percent of GDP, with a potential tax loss of 1.9 percent of GDP. According to Ramadhan (Citation2019), the size of Indonesia’s shadow economy was around 7.6 percent of GDP from 2000 to 2007, with a potential tax loss of 0.95 percent of GDP. He went on to explain that a 4% reduction in the shadow economy would have reduced tax potential losses by 6% in 2016 and 3% in 2017. Indupurnahayu and Walujadi (Citation2019) found that the size of the shadow economy in Indonesia averaged 5.44 percent from 1990 to 2018, with the maximum being 21.75 percent in 1998, while tax losses averaged 0.7 percent of GDP during the same time.
According to studies, Indonesians avoid paying taxes or deposit their income in tax haven countries due to the country’s complicated tax system and incompetent tax administration (Alm, Citation2019; OECD, Citation2012). According to an OECD (Citation2012) study, Indonesia’s high share of agriculture, low openness to trade, higher size of shadow economy, tax evasion, and narrow tax bases have all contributed to the country’s low tax revenue or tax ratio. The Indonesian government has made significant attempts to improve its tax system in order to enhance tax collection while decreasing tax evasion. According to a more recent analysis by Basri et al. (Citation2021), the major corporate tax administration reform was successful in increasing tax income by double. The establishment of “Medium Size Taxpayer Offices” across the country, with a high staff-to-taxpayer ratio, improves both enforcement and customer service, and so enhances tax collection. On the contrary, Eka (Citation2019) discovered that the tax administration reform manages to increase individual taxpayer compliance but not sufficiently to increase tax revenue; whereas the tax administration reform did not increase corporate tax compliance and has no impact on tax revenue for corporate taxpayers.
Tax amnesty is another approach that the Indonesian government has used to raise tax income (OECD, Citation2019). In reality, throughout the 1980s, tax amnesties were a popular technique for increasing tax income in the United States (Andreoni et al., Citation1998). The purpose of the tax amnesty is to allow tax evaders to become compliant, resulting in less tax evasion. Tax amnesty was enacted in Indonesia in 1964, 1984, 2008, and 2016. (Hajawiyah et al., Citation2021; Pohan et al., Citation2019; Rahayu, Citation2018; Sabnita, Citation2019; Sari & Mulyati, Citation2018). However, these studies have shown that tax amnesty programmes have not been very successful at boosting the tax-ratio, despite the fact that they have increased tax income in some cases in the short run.
This paper serves two main purposes. First, we assess the magnitude of tax evasion in Indonesia and identify factors influencing tax evasion from 1980 to 2019. Second, because none of the preceding studies address the influence of financial development on tax evasion, the novelty of our study is to investigate the role of financial sector development in reducing tax evasion in Indonesia. To estimate the long-run model on tax evasion, we used the Autoregressive Distributed Lag model, the OLS with robust standard error, the Dynamic OLS, and the Robust Least Squares (M-estimation) methods in this study. Our main finding supports the idea that financial development can help to reduce tax avoidance in Indonesia.
The following is the rest of the presentation. Section 2 examines into previous research on tax evasion in Indonesia. Section 3 describes our model as well as the estimation methods. Section 4 delves into the estimation results. The fifth section concludes.
2. Related literature
Allingham and Sandmo were the first to investigate tax evasion behaviour (1972). Based on Becker’s (Citation1968) earlier work on the economics of crime, Allingham and Sandmo (Citation1972) suggested that taxpayers would choose to conduct tax evasion if the advantages outweighed the costs of dodging taxes. A taxpayer has two options under Allingham and Sandmo’s (Citation1972) tax evasion model: evade or not avoid tax. His judgment on tax evasion will be dependent on the penalty imposed on him if he is detected dodging taxes. He will face a fine or penalty if he is audited or probed by the tax authorities. If the tax rate is higher than the penalty rate, as a rational economic agent who seeks to maximise his expected utility, tax evasion will increase. This means that if detection is certain and fines are substantial, few people will avoid taxes, resulting in increased tax compliance. According to the hypothesis, tax evasion can be decreased by either increasing the penalties connected with it or increasing the cost of administrative expenses on enforcement, which increases the likelihood that the tax evader would be caught. The impact of the tax rate on tax evasion is uncertain because of the competing effects of income and substitution effects.
Allingham and Sandmo’s (Citation1972) seminal work on tax evasion has spurred numerous of the tax evasion studies. Yitzhaki (Citation1974), for example, extended the work of Allingham and Sandmo (Citation1972) by addressing tax evasion as a problem in an optimum portfolio choice model, assuming that the taxpayer has an absolute risk aversion that decreases with income. His model predicts that if a taxpayer is caught, the penalty will be a constant multiple of the amount of tax evaded (rather than total income in the Allingham-Sandmo model), and because the taxpayer will be worse off as a result of the possibility of paying a higher penalty, the taxpayer will take less risk and thus evade less at higher tax rates (Gerxhani & Wintrobe, Citation2021).
The fiscal exchange theory or the public choice theory, on the other hand, argue that people will avoid taxes if the quantity of taxes paid is not transformed into high-quality public goods and services (Cowell & Gordon, Citation1988). The people’s elected government is expected to provide adequate public infrastructure, such as roads, schools, hospitals, and universities, among other things. Increased government spending with taxpayer money should be transformed into these public goods and services to the satisfaction of citizens. The perception of a link between taxation and the provision of public goods and services would point to a fair and trustworthy government (Alm et al., Citation1992; Fjeldstad, Citation2001; Moore, Citation2004). Tax morale will be high in a fair and trusted government, tax compliance will grow, and tax evasion will be decreased (Cowell, Citation1990; Hanousek & Palda, Citation2004, Citation2005; Torgler, Citation2005).
Several studies have indicated that a variety of reasons can explain why people dodge taxes. Richardson (Citation2006) postulates that age, education, employment in the services sector, fairness, and tax morale all influence tax evasion in 45 nations studied. Crane and Nourzad (Citation1986) discovered that inflation, marginal tax rate, probability of detection, penalty rate, wage-to-income ratio, and real income all influence tax evasion behaviour in the United States. Caballe and Panades (Citation2004) also support the role of inflation in encouraging tax avoidance.
Feld and Frey (Citation2006) and Kirchgassner (Citation2010) argue that the probability of discovery, penalty rate, marginal tax rate, tax procedures, democracy, income, age, kind of employment, language, and population are major factors of tax noncompliance in in Switzerland. Kafkalas et al. (Citation2014) discovered that, in addition to income and tax rate, government effectiveness (quality of government) and tax monitoring expenses influence tax evasion in OECD nations. Cebula (Citation1998) and Cebula and Foley (Citation2010), on the other hand, found that the income tax rate, unemployment rate, interest rate, audit and penalty rate all have an impact on tax compliance in the United States.
According to Sunani (Citation2016), tax avoidance is the norm in Indonesia. Everyone is avoiding paying taxes; this tax culture needs to be corrected (Damayanti, Citation2012). Increased tax morale, trust, and attitude toward tax compliance among the general public will eventually lessen the shadow economy and tax evasion. A taxpayer is more likely to pay taxes if he or she believes that other taxpayers will pay the tax and that the government will utilise the tax proceeds appropriately for public goods financing (Torgler, Citation2005).
Kristianto et al. (Citation2021) found that enterprises are unwilling to pay taxes due to the cumbersome bureaucratic process of obtaining a company authorization and a taxpayer identification number. Some of the reasons given are: (i) they lack knowledge and information about the needs and benefits of working legally; (ii) they believe that because their operations are formal, they are constantly watched; and (iii) they lack expertise, do not trust, and do not want to deal with the complexity of legal arrangements by tax authorities. Tax evaders, in fact, prefer to pay the penalty illegally because their situation is adequately handled.
Using a sample of 14,105 individual taxpayers obtained from audit data from the Directorate General of Taxes Indonesia for the years 2001–2012, Estri and Djamaludin (Citation2019) suggest that tax rate, taxable income brackets, gender, age, marital status, and type of business sector all play a role in tax evasion. It was also discovered that women, young employees, married taxpayers, and enterprises in the industrial sector evade taxes at a higher rate.
2.1. Tax evasion and the financial sector
Another line of research has looked into the influence of the financial sector as a predictor of tax evasion. Individuals and firms have easy access to the credit market in industrialised economies with a high level of financial development, according to Bose et al. (Citation2012). Borrowers must, however, disclose their income and/or assets, which can be used as collateral or to assess their creditworthiness, although they will be exposed to tax responsibility if they do so. Because the value supplied by financial intermediation is significant (Gordon & Li, Citation2009), there is less motivation to dodge tax and less need to participate in the shadow economy. On the other hand, for developing economies with low levels of financial development, access to the credit market is constrained due to a lack of loanable capital, asymmetric information, and high borrowing costs; borrowers have less motivation to declare income and/or assets. Tax evasion is rampant in such circumstances, as is the shadow economy. Their cross-sectional and panel analyses show that improvements in the banking sector’s expansion, as well as its depth and efficiency, contribute to a smaller shadow economy. The conclusion in Gatti and Honorati (Citation2008) lends credence to the claim that greater tax compliance is connected with greater access to the loan market.
Using a simple model of tax evasion and financial intermediation, Blackburn et al. (Citation2012) explain the relationship between shadow market activity and credit market development. Potential borrowers in imperfect financial markets (with asymmetric information) are needed to declare their income or wealth in order to obtain a loan to finance their venture. The quantity of wealth determines the amount of collateral required to secure a loan, as well as the terms and conditions of the loan contract made available to them. As a result, the less wealth stated, the less collateral available to finance the required loan, and the harsher the terms and conditions of the loan contract. According to Blackburn et al. (Citation2012), credit arrangements deteriorate with low levels of financial development. Thus, the benefit of wealth disclosure grows with the level of financial development, implying that tax dodging individuals and firms decline as the economy progresses from a low to a high level of financial development.
On the one hand, Bittencourt et al. (Citation2014) argue, using a conventional overlapping generation approach, that both a lower (higher) level of financial development and a greater (lower) level of inflation lead to a larger (smaller) shadow economy. Furthermore, societies with higher (lower) levels of financial development will have lower (higher) monitoring costs. Borrowers who choose to conceal their income from the bank will face increased borrowing charges and terms. These greater charges, along with a lower level of financial development, will incentivize borrowers to engage in tax evasion activities.
Beck et al. (Citation2014), on the other hand, investigate the influence of credit information sharing and bank branch penetration on tax evasion. They contend that banking outreach, i.e., improved information sharing and branch network growth, may have an impact on the advantages and costs of corporate tax evasion. Higher banking sector outreach raises the opportunity costs of tax evasion by increasing the likelihood and benefits of gaining access to formal finance, whereas more effective information sharing and wider branch penetration reduce information asymmetries and agency problems between lenders and borrowers, lowering the benefits of tax evasion. Their findings imply that a financial system that makes credit more accessible raises the opportunity costs of tax evasion. Thus, in an economy with increased branch penetration and better credit information sharing, corporate wrongdoing can be more easily recognised and disseminated among all other potential lenders, making future loans more difficult and expensive to obtain (Jappelli & Pagano, Citation2002). As a result, in countries with a better financial system or a high degree of financial growth, the opportunity costs of engaging in tax evasion should be higher.
3. Methodology
3.1. Model specifications
Following the preceding literature and data availability for some variables, and in order to preserve degree of freedom, we specify the factors of tax evasion for the Indonesian economy as follows in this study.
where ;
is the size of tax evasion measures by tax evasion to GDP ratio;
is the tax burden proxy using tax revenue to GDP ratio;
is financial development indicators—stated either as: (a) the ratio of domestic credit to the private sector to GDP (
), or (b) the money supply M2 to GDP ratio (
);
is the squared value of
;
is real GDP per capita; and
is urbanization measure by the ratio of urban population to total population.
Traditionally, the size of the shadow economy is used to measure the magnitude of tax evasion or revenue from tax losses caused by shadow economy activity. Nonetheless, because there is no precise method for determining the size of the shadow economy (Berger et al., Citation2014), we developed a proxy. To assess the size of the shadow economy, we utilised Pickhardt and Sarda’s (Citation2011, Citation2015) “modified-cash-deposit-ratio” (MCDR) technique. Fisher’s (Citation1911) quantity theory of money serves as the foundation for this strategy.
Pickhardt and Sarda (Citation2011; Citation2015 assumed that the currency in circulation in the base year (C0) represents all cash that agents chose to carry for future lawful transactions. If all new transactions in the official economy are made using demand deposits, then any cash holdings in excess of the cash amount in the base year are attributed to the shadow economy. The MCDR is the ratio of revenue from the shadow economy to official economic income. It is formulated as follow:
where is the currency in circulation at the end of year t;
is the currency in circulation at the end of the base year;
is the demand deposits at the end of year t; and
and
are respectively the sizes of the official and shadow economy.
is measured by the nominal GDP.
is the proportion of the shadow economy in the official economy. The estimated amount of tax evasion is obtained by multiplying tax revenue to
.
For the regressors in EquationEquation (1)(1)
(1) , we a priori expected that
and
. An increase in economic development (income) is expected to reduce shadow economy and therefore, tax evasion. A tax rate increase and rising urbanization are expected to increase tax evasion among the public. The expected sign for
and
is ambiguous. That said, we expected a non-linear relation between financial sector development and tax evasion as suggested by Blackburn et al. (Citation2012) and Bose et al. (Citation2012). In other words, we expected that financial sector development raises tax evasion when the level of financial sector sophistication is still low, until a point when further increase in financial sector development reduces tax evasion. Thus, we expected
and
, which show an inverted U-shaped curve. In a study by Bittencourt et al. (Citation2014), a strong negative relation was revealed between financial sector development and tax evasion in 150 countries during 1980 and 2009. However, they could not confirm a nonlinear relation between these two variables. Their finding shows that either
or
, which implies that financial sector development can lower tax evasion.
We anticipated a negative relationship between real GDP per capita and tax evasion. Pickhardt and Sarda (Citation2015) noted that the sign of real GDP is difficult to forecast because it is controlled by the structure as well as the stage of development of the shadow economy. Nonetheless, other research has found that real GDP has a detrimental impact on tax evasion (Bajada & Schneider, Citation2005; Gaspareniene et al., Citation2016; Pickhardt & Sarda, Citation2015; Schneider, Citation2008). A thriving economy creates a multitude of job opportunities and raises the level of living. People are drawn into the shadow economy during a recession to compensate for income losses in the formal sector.
The primary driver for people’s engagement in the shadow economy has been identified as the tax burden. Many people enter the shadow economy in order to avoid paying taxes. A tax rate increase is regarded as a hardship on the populace. The opportunity cost of tax evasion is lower if the rising tax burden enhances the marginal advantages of tax evasion more than the marginal costs (Allingham & Sandmo, Citation1972; Dell’Anno et al., Citation2007; Schneider, Citation2005). Several periods of tax rise in Indonesia in the 1970s and 1980s, as recounted in Panjaitan (Citation2007), expanded the shadow economy.
People moving from rural to urban regions cause urbanisation. They are looking for better work prospects and a higher level of living. However, metropolitan work prospects cannot keep up with the growing population (Harris & Todaro, Citation1970). People are forced to enter the shadow economy if the labour market cannot absorb the rising labour force. Tax evasion rises as the shadow economy expands. Many urban informal sectors in Indonesia are made up of street sellers and small entrepreneurs (Brata, Citation2008; Dahles, Citation1998; Suharto, Citation2002). The Asian Development Bank (ADB, Asian Development Bank (ADB), Citation2011) conducted a study on the shadow economy in the Yogyakarta and Banten provinces. The shadow economy contributed around 37% and 27% to the gross value added of Yogyakarta and Banten, respectively. The number of firms in Yogyakarta and Banten that are engaged in the shadow economy was substantial. In Yogyakarta, these firms contributed 89% of the gross value added in the agriculture sector, 69% in the manufacturing sector, 53% in the trade sector, and 53% in the other services sector. In Banten, the informal firms contributed about 87% of gross value added in the agriculture sector, 63% in the wholesale and retail trade sector, 55% in the hotels and restaurants sector, and 72% in the other services sector. Therefore, we have a prior expectation that the relationship between tax evasion and urbanization in Indonesia to be positive.
3.2. Method of estimations
In this study, we use the Autoregressive Distributed Lag (ARDL) modelling approach to cointegration provided by Pesaran et al. (Citation2001) to estimate the long-run tax evasion model in EquationEquation (1)(1)
(1) . The ARDL approach is used to build a long-run equilibrium relationship between tax evasion and its regressors, which include economic development (
), financial development (
,
), tax burden (
), and urbanization (
). The ARDL approach has various advantages over other cointegration approaches because, unlike other cointegration approaches, it may be utilised when variables are stationary at I(0), I(1), or a combination of both. When used with significant lags, ARDL is resistant to small sample size and endogeneity concerns. Furthermore, both the short and long run parameters can be estimated concurrently without sacrificing a significant degree of freedom. Based on these advantages of ARDL, we build the conditional error-correction model given below to describe the relationships of our variables, which can be used to test for cointegration using the bounds F-test for cointegration:
The following conditional error-correction (ECM) model is specified,
To test for cointegration or to estimate the long run relationship link among the variables, we estimate the joint F-test on the test the null hypothesis of no cointegration on the level variables in EquationEquation (3)(3)
(3) , which is
:
against the alternative hypothesis
:
. The presence of cointegration or otherwise is based on the outcome of the computed F-statistics test obtain via EquationEquation (3)
(3)
(3) . The computed F-statistics are then compared with the critical values tabulated by Narayan (Citation2005), namely the lower critical bound and the upper critical bound. If the estimated F-statistics is greater than the critical value of the upper bound, we can reject the null hypothesis of no cointegration, and accept the alternative hypothesis that cointegration exist. On the other hand, if the estimated F-statistics is lower than the lower bound, the null hypothesis cannot be rejected and therefore, cointegration does not exist. Conversely, if the F-statistics falls in between the upper and lower bound, the outcome is inconclusive.
According to Pesaran et al. (Citation2001), the long-run model as per EquationEquation (1)(1)
(1) can be derived from the following short-run ARDL model,
From EquationEquation (4)(4)
(4) , we can have the following long-run model as per EquationEquation (2)
(2)
(2) above,
with ,
,
,
,
, and
.
We can also examine the presence of cointegration from the short-term ECM model by using the residual of the long-term model, as follow:
where the is the residual from the long-term model (i.e., EquationEquations (1)
(1)
(1) or (5)) with one-period lag, which is stated as:
Lambda ( is an error-correction (
) parameter that measures the speed of adjustment of the variables towards the long-run equilibrium. If λ is significant and has a negative sign, and the value usually lies between 0 and −2 (Fromentin & Leon, Citation2019; Loayza & Rancière, Citation2006; Samargandi et al., Citation2015), then there is cointegration. In this case, the model shows long-run relations between
and its determinants (i.e.,
and
.
4. Sources of data
Data on currency in circulation and demand deposits were gathered for this study from several issues of the Asian Development Bank’s Key Indicators for Asia and the Pacific. Data on GDP, real GDP (2015 = 100) per capita, tax revenue, broad money supply (M2), domestic credit to private sector, urban population, and total population were compiled from the World Development Indicators, which are available online at the World Bank database (see http://data.worldbank.org/indicator). The tax burden (tax revenue), broad money supply (M2), and domestic credit to the private sector were expressed as ratios to GDP, whereas urban is the ratio of urban population to total population. The variables were converted into logarithms in all estimations. In this study, we employ the formula to transform the variables into logarithm (see, Busse & Hefeker, Citation2007). By employing this method, we maintain the sign of
. The period of the study is from 1980 to 2019.
5. The empirical results
The descriptive statistics for the dependent and independent variables in our analysis are shown in . More importantly, it demonstrates that most dependent and independent variables exhibit less variation in standard deviations, skewness, and kurtosis. All variables have positive skewness (except and
for having negative skewness), while
,
,
and
exhibit kurtosis with size larger than 3 (the inclusion of
,
,
and
will be explained later). These suggest that the tail on the right side of the distribution is longer or fatter. In other words, the kurtosis for these variables has a leptokurtic distribution. Nonetheless, with the exception of
, the Jarque-Bera test for series normality was not rejected. Given that several of the variables in our analysis exhibit extreme skewness, kurtosis, and a non-normal distribution, the most conventional way to avoid these issues is to logarithmically transform all variables (Ehrhardt-Martinez et al., Citation2002; Naidoo & Adamowicz, Citation2001).
Table 1. Descriptive statistics
Before estimating EquationEquation (1)(1)
(1) , we examined the order of integration of the variables in our model. We employ a unit root test developed by Ng and Perron (Citation2001), which has a consistent test size and minimum power loss. Their test is robust to the selection criteria for lag length. The
and
unit root test statistics were used, and the presence of a unit root is the null hypothesis. , Panel A shows the Ng-Perron unit root test results, whereas Panel B shows the Kwiatkowski et al. (KPSS, Citation1992) unit root test results for
. The null hypothesis is stationary versus the alternative, unit root, for the KPSS test. The unit root test findings clearly reveal that all variables are non-stationary in levels, however all variables show stationarity after first-differencing. In other words, all series are level I(1) variables.
Table 2. Results of unit root tests
After confirming that the variables’ levels are nonstationary, we used the bounds F-test to perform the cointegration test. Tables show the cointegration results obtained using the ARDL approach. In , we provide the cointegration results for EquationEquation (1)(1)
(1) , denoted as Model 1, with domestic credit to the private sector to GDP ratio as proxy for financial sector development; whereas in , denoted as Model 6, money supply M2 to GDP ratio was utilised as proxy for financial development. The Model 1 and Model 6 are our reference models.
Table 3. Results of bound F- and Johansen cointegration test for model with domestic credit () as proxy for financial development, (
,
)
Table 4. Results of bound F- and Johansen cointegration test for money M2 () as proxy for financial development, (
,
)
Panel A in Tables provides the summary findings of the ARDL EquationEquation (4)(4)
(4) for Model 1. We only report the ARDL optimal lag structure, adjusted
, and the LM test for serial correlation to save space. The long-run (shown in Panel B) and short-run (shown in Panel C) models can be obtained from the previously discussed estimated ARDL model. More importantly, the ARDL model passes the serial correlation test. The bound F-test for the long-run model proved that the null hypothesis of no cointegration can be rejected at the 1% level of significance. These findings suggest that our long-run tax evasion model is not spurious, and that the tax evasion model has a long-run relationship with its determinants—income, financial sector development, tax burden, and urbanization.
As demonstrated by Models 1 and 6, our main variable of interest—the role of financial development—our findings imply that the coefficients of linear () and quadratic terms (
) of financial development imply that at lower levels of financial development, tax evasion increases, but after reaching a certain optimal point, tax evasion decreases as financial development progresses further. The inverted U-shape relationship between tax evasion and financial development indicates a nonlinear relationship, which supports the contention proposed by Blackburn et al. (Citation2012). This study’s findings clearly show that financial development had a mitigating effect on tax evasion in Indonesia from 1980 to 2019.
Our findings, on the other hand, imply that an increase in economic development or income reduces tax evasion, as expected. Both the tax burden and the urbanisation variables appear to have a favourable relationship with tax evasion. It suggests that a rise in tax rates drives people into the shadow economy in order to avoid paying taxes. Increased urbanisation will also enlarge the shadow economy, limiting the amount of tax revenue that the government can collect. Meanwhile, results in Panel B show that only tax burden and urbanisation are significant at the 5% level.
We observed that the coefficient of the is statistically significant at the 1% level for the short-run model shown in Panel C in both Tables . In Model 1, none of the short-run variables are significant; however, in Model 6, lagged one-period changes in tax evasion, as well as current and lagged one-period changes in income, affect current changes in tax evasion in the short run.
6. Test for robustness
The critical question now is, “How robust are the foregoing results?” We followed the following measures to assess the robustness of the aforesaid results. First, we consider four additional economic variables that may influence tax avoidance. As additional regressors, we have included the share of agricultural value added to GDP (), trade to GDP ratio (
), corruption (
) and education level (
) .Footnote1 We would anticipate that increased agricultural output, trade, corruption control, and education level will reduce tax evasion.Footnote2 We would see if the coefficients and sign of the variables in the benchmark model changed significantly in the presence of these variables. The model that follows is,
where ;
is the additional regressors—the share of agricultural value added to GDP (
), trade to GDP ratio (
), corruption (
) and education level (
). If the share of agricultural value added to GDP, trade to GDP ratio, corruption and education level were to mitigate tax evasion in Indonesia, we would expect that the relationship between
,
, and
and
to be negative; while with
and
to be positive.
Second, we examine if the ARDL model has a unique cointegration relationship with its regressors. In reality, Nkoro and Uko (Citation2016) stated that the ARDL approach is appropriate when there is only one long-run relationship present. The Johansen (Citation1991) and Johansen and Juselius (Citation1990) multivariate cointegration test procedures are recommended for determining if a single equation has a single or multiple relationships.Footnote3 Third, three different estimators were used: the Ordinary Least Squares (OLS) with robust standard error due to the Newey-West estimator (OLS-robust), the dynamic OLS (DOLS), and the Robust Least Squares M-estimation (RLS-ME). DOLS is robust to the problems of simultaneity and small-sample bias among the regressors by regressing an I(1) variable on other I(1) variables, the I(0) variables, the lags and leads of the first difference of the I(1) variables (Stock & Watson, Citation1993); and RLS-ME is robust to the presence of outliers in the sample.
Looking again at Tables , despite the fact that there is cointegration for models that include (Models 2 and 7),
(Models 3 and 8),
(Models 4 and 9) and
(Models 8 and 10), only variable
is statistically significant at the 1% level. The negative relation between tax evasion and agriculture value added share to GDP implies that increasing agricultural output or employment in the agriculture sector would lower tax evasion. In general, and more crucially, these findings show that the impacts of income, financial development, tax burden, and urbanisation on tax evasion remain unchanged.
The Johansen and Juselius (Citation1990) multivariate cointegration test are then applied to all models. We only report the Trace-statistics because studies have demonstrated that it is superior and has higher power performance than the Maximal-eigenvalue statisticFootnote4 (Cheung and Lai, Citation1993; Lutkepohl et al., Citation2001). Furthermore, because it is well known that the findings of the Johansen and Juselius cointegration test are distorted in small samples, we utilise the correction factor, (T-nk)/T, where T is the number of observations, n is the number of variables, and k is the number of lag lengths (Reinsel & Ahn, Citation1988). We show both unadjusted and adjusted Trace statistics for all 10 models in Tables , Panel D. Models 1 and 2 have a single cointegrating vector, whereas Models 3 through 10 have two or more cointegrating vectors. These findings indicate that the ARDL process is best suited for Models 1 and 2, but the remaining models were better estimated using the Johansen and Juselius cointegration method.
However, given our small sample size of 39 observations, how accurate is the Johansen and Juselius cointegration procedure? Toda (Citation1995) asserted that the Johansen and Juselius approach is insufficient to ensure reasonably high performance even with a sample size of 100 observations. He proposes that 300 observations or more are required to ensure that this test process performs well. On the one hand, Hjalmarsson and Osterholm (Citation2010) demonstrated through extensive Monte Carlo simulation that the probability of reaching a false and erroneous conclusion that completely unrelated series are cointegrated because the procedure provides much larger than the nominal size of the test.
As demonstrated in Part D Tables , the nominal size of the Trace-statistics is unusually enormous, particularly in Models 3 to 5 and 7 to 10. In fact, Model 10 registers a full rank, which means that all variables are stationary. This contradicts the results of the unit root test in . On a strong point, Zhou (Citation2001, p. 920) exerts that “when someone employs a small number of annual observations to carry out the Johansen cointegration tests with a lagged VAR model, one would expect a low probability of acquiring meaningful results. This is because, if one rejects the null hypothesis and concludes the existence of a cointegration relationship among the variables in the model by comparing the test statistics with the asymptotic critical values, the conclusion would be subject to over-rejection due to the problem of size distortion”.
Given the shortcomings of the cointegration tests proposed by Johansen (Citation1991) and Johansen and Juselius (Citation1990), we proceed with our next three estimators for our robustness test. shows the outcomes for all 10 models that used the OLS-robust technique. The results on the benchmark Models 1 and 2 are generally similar with the earlier ARDL results shown in Tables . All variables are statistically significant and exhibit the anticipated signs. Furthermore, all models show cointegration, as demonstrated by the Engle and Granger (Citation1987) two-step ADF-statistics (Dickey & Fuller, Citation1981), which were statistically significant at the 1% level. In Models 2 and 5, however, only the variables and
are statistically significant, with both displaying negative signs. This suggests that when agricultural output and education levels rise, tax avoidance will decrease. We can ensure that there are no substantial changes in the size and signs of the variables—income, financial development, tax burden, and urbanisation—in Models 2 to 5 and Models 7 to 10.
Table 5. Results of long-run model using OLS-robust
The results of the long-run model for tax evasion applying the dynamic OLS are provided in . The benchmark Models 1 and 2 produce consistent findings when compared to the earlier results obtained using ARDL and OLS-robust. All regressors—income, financial development, tax burden, and urbanisation—are statistically significant and exhibit expected signs. Only is important in the remaining models and has a negative sign in Model 7. In general, the factors—income, financial development, tax burden, and urbanisation—are statistically significant and indicate expected signs.
Table 6. Results of long-run model using DOLS
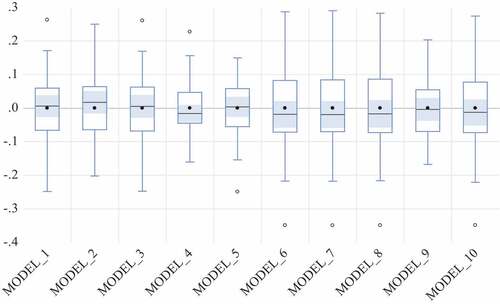
Finally, we use the M-estimator to estimate robust regression. According to Barnett and Lewis (Citation1994), the presence of outliers can result in inflated error rates and significant distortions of parameter and statistical estimates when applying either parametric or non-parametric tests. Statistically, a rise in error variance reduces the power of statistical tests, reduces normality, and significantly biases or influences parameter estimations (Perez et al., Citation2013). Rousseeuw (Citation1984) believes that robust regression is the best method for detecting outliers and producing findings that are resistant to outliers. The M-estimation approach, developed by Huber (Citation1964) is the most widely used generic method of robust regression.
shows the box plots of the residuals of all estimated regressions reported in . The box plots provide general information about the distribution of univariate data (the residuals). The core data is represented by a rectangular box, with the top and bottom quartiles of the data distribution, respectively. The data median is denoted by the horizontal line in the box. The whiskers are the lines that run above and below the box. The whiskers are 1.5 times the inter-quantile range in length, while the outliers are items positioned above or below the whiskers (Daszykowski et al., Citation2007). Outliers are present in the residuals of some of the estimated regressions, as seen in . These outliers are found at the top and/or bottom of the upper and/or lower whiskers, respectively. This is true for Models 1, 3, 8, and 10.
Figure 1. Boxplots of OLS regression residuals. EquationEquation 1(1)
(1) to EquationEquation 5
(5)
(5) for Models 1 to 5 respectively; while EquationEquation 6
(6)
(6) to Equation 10 for Models 6 to 10 respectively.
shows the results of the robust regression using the M-estimator. The estimated Models 1 and 2 show that the causes of tax evasion—income, financial development, tax burden, and urbanisation—are key factors determining tax evasion in Indonesia, similar to the findings in ARDL, OLS-robust, and DOLS. The nonlinear association between the rise of the financial sector and tax evasion is consistent with estimates made using ARDL, OLS-robust, and DOLS. Nonetheless, in Model 2, Model 8, and Model 5, ,
and
are statistically significant. While
and
have a negative link with tax evasion,
has a positive relationship with tax evasion. The Hansen
-statistics clearly show that for all models, the null hypothesis of cointegration cannot be rejected.
Table 7. Results of long-run model using robust regression using M-estimation
In conclusion, based on the findings, this study concludes that income, financial development, tax burden, and urbanisation are significant factors influencing tax evasion in Indonesia from 1980 to 2019. One noteworthy finding is that the relationship between tax evasion and financial development is nonlinear. Tax evasion is prevalent at lower levels of financial development; but, as financial development continues to a higher level, we would expect tax evasion to reduce. On the other end, more income reduces tax evasion, whereas increased tax burden and urbanisation enhance tax evasion in Indonesia.
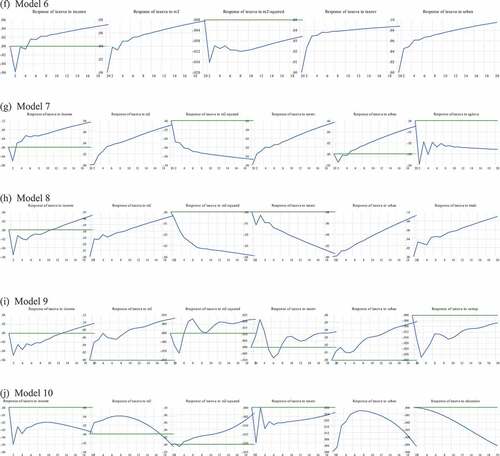
As an additional analysis, we would like to see how tax evasion responds to a shock in each of the regressors. show the dynamic effects of tax evasion models on the regressors in response to various shocks. depicted the impulse response function of tax evasion as a result of shocks to all variables over a 20-period period. In most models, a shock to income reduces tax evasion until the second period, after which it increases; a shock to financial development shows a positive linear upward trend in tax evasion while a shock to the quadratic term shows a negative impact on tax evasion; and a shock to tax burden and urbanisation show that tax evasion increases over the 20 periods horizon. Generally, the impulse response function support the expected relationship between tax evasion and its determinants—income, financial development, tax burden and urbanisation.
Figure 2a. Tax evasion response to Cholesky One S.D. innovation to its determinants.
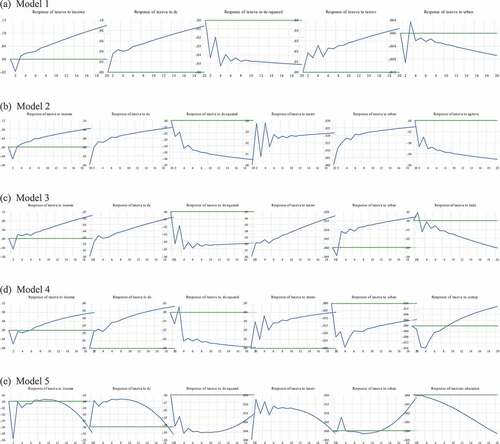
Figure 2b. Tax evasion response to Cholesky One S.D. innovation to its determinants.
7. Conclusion
The purpose of this study is to assess the size of tax evasion in the Indonesian economy from 1980 to 2019. The size of the share of tax revenue losses to GDP was calculated using the modified-cash-deposit-ratio (MCDR) approach proposed by Pickhardt and Sarda. Following that, we analyse the drivers of tax evasion by including a number of regressors, including income (or economic development), financial development, tax burden, and urbanisation. Recent literature has hypothesised that financial development can play a key role in reducing tax evasion—tax evasion increases at lower levels of financial development only up to a certain point, then decreases as financial development progresses. Aside from these major determinants, we have included the share of agricultural output to GDP, the trade-to-GDP ratio, the amount of corruption, and the level of education as potential factors influencing tax evasion in Indonesia.
In terms of our key variable of interest, our regression results indicate a nonlinear relationship between tax evasion and Indonesian financial progress. The involvement of the financial sector in minimising tax evasion is an important policy conclusion of this study. By making finance more accessible, people and/or businesses will be more ready to disclose their wealth and/or assets and, as a result, will be unable to evade tax. However, it is not only a willingness but also a necessity because individuals and businesses must be honest and make some personal declarations in their transactions with financial institutions. According to ADB studies, enterprises in Indonesia are eager to enter the official credit market in order to obtain larger loans for large capital investments, export their products, and compete for government contracts. On the other side, improving economic conditions, lowering tax rates, and building infrastructure, as well as creating job possibilities in metropolitan areas, will lessen the scale of Indonesia’s shadow economy and tax evasion.
Acknowledgements
This project is funded by the Research Grant NKB-1912/UN2.R3.1/HKP.05.00/2019 from the Hibah Kolaborasi Riset Internasional 2019, Universitas Indonesia.
Disclosure statement
No potential conflict of interest was reported by the author(s).
Additional information
Funding
Notes on contributors
Sugiharso Safuan
Sugiharso Safuan is an Associate Professor and Head of Research Cluster International Trade, Finance, and Monetary Economics, Faculty of Economics, Universitas Indonesia. His research interests include Applied Macroeconomics, International Finance, monetary economics, financial development, and banking. He leads a research project on exploring the relationship between financial-banking development and economic growth.
Muzafar Shah Habibullah
Muzafar Shah Habibullah is currently a Professor at the Putra Business School, Malaysia. He is a former Professor at the Faculty of Economics and Management, Universiti Putra Malaysia. His research interest includes Applied Macroeconomics, Monetary Economics, and Banking. The present paper is very much related to our work on the shadow economy and its relationship with banks and financial development.
Eric Alexander Sugandi
Eric Alexander Sugandi is a Project Consultant at the Asian Development Bank Institute, Japan. His research interests include monetary economics, financial economics, and international economics.
Notes
1. We thank an anonymous referee for suggesting this point.
2. Data for the share of agricultural value added to GDP was taken from United Nations Statistical Division database at https://unstats.un.org/unsd/snaama/Index; Corruption index from the International Country Risk Guide (1984–2018) risk ranking; Trade (% GDP) from World Development Indicator available at https://data.worldbank.org/indicator?tab=all; while Education level was taken and interpolated yearly from Barro and Lee (Citation2013) and expanded to 2019 (http://www.barrolee.com/)
3. We thank an anonymous referee for suggesting this point.
4. To conserve space, readers are referred to the paper by Johansen and Juselius (Citation1990) to perform the test. The procedure employs the vector autoregressive (VAR) and vector autoregressive error-correction model (VECM) and use the Trace and Maximal-eigenvalue statistics to infer cointegration.
References
- Allingham, M. G., & Sandmo, A. (1972). Income tax evasion: A theoretical analysis. Journal of Public Economics, 1(3–4), 323–27. https://doi.org/10.1016/0047-2727(72)90010-2
- Alm, J. (2019). Can Indonesia reform its tax system? Problems and options. Tulane Economics Working Paper Series 1906, Tulane University, USA.
- Alm, J., McClelland, G. H., & Schulze, W. D. (1992). Why do people pay taxes? Journal of Public Economics, 48(1), 21–38. https://doi.org/10.1016/0047-2727(92)90040-M
- Andreoni, J., Erard, B., & Feinstein, J. (1998). Tax compliance. Journal of Economic Literature, 36(2), 818–860. https://www.jstor.org/stable/2565123
- Asian Development Bank (ADB). (2011). The informal sector and informal employment in Indonesia: country report 2010. Asian Development Bank and BPS-Statistics Indonesia.
- Bajada, C., & Schneider, F. (2005). The shadow economies of the Asia-Pacific. Pacific Economic Review, 10(3), 379–401. https://doi.org/10.1111/j.1468-0106.2005.00280.x
- Barnett, V., & Lewis, T. (1994). Outliers in statistical data. Wiley.
- Barro, R., & Lee, J. W. (2013). A new data set of educational attainment in the world, 1950-2010. Journal of Development Economics, 104(September), 184–198. https://doi.org/10.1016/j.jdeveco.2012.10.001
- Basri, M. C., Felix, M., Hanna, R., & Olken, B. A. (2021). Tax administration versus tax rates: Evidence from corporate taxation in Indonesia. American Economic Review, 111(12), 3227–3871. https://doi.org/10.1257/aer.20201237
- Beck, T., Lin, C., & Ma, Y. (2014). Why do firms evade taxes? The role of information sharing and financial sector outreach. The Journal of Finance, 69(2), 763–817. https://doi.org/10.1111/jofi.12123
- Becker, G. (1968). Crime and punishment: An economic approach. Journal of Political Economy, 76(2), 169–217. https://doi.org/10.1086/259394
- Berger, W., Pickhardt, M., Pitsoulis, A., Prinz, A., & Sarda, J. (2014). The hard shadow of the Greek economy: New estimates of the size of the underground economy and its fiscal impact. Applied Economics, 46(18), 2190–2204. https://doi.org/10.1080/00036846.2014.896984
- Bittencourt, M., Gupta, R., & Stander, L. (2014). Tax evasion, financial development and inflation: Theory and empirical evidence. Journal of Banking and Finance, 41(April), 194–208. https://doi.org/10.1016/j.jbankfin.2014.01.009
- Blackburn, K., Bose, N., & Capasso, S. (2012). Tax evasion, the underground economy and financial development. Journal of Economic Behavior & Organization, 83(2), 243–253. https://doi.org/10.1016/j.jebo.2012.05.019
- Bose, N., Capasso, S., & Wurm, M. A. (2012). The impact of banking development on the size of shadow economies. Journal of Economic Studies, 39(6), 620–638. https://doi.org/10.1108/01443581211274584
- Brata, A. G. (2008). Vulnerability of urban informal sector: Street vendors in Yogyakarta, Indonesia. MPRA Paper No. 12541. Munich Personal RePEc Archive, The University Library, Geschwister-Scholl-Platz 1. https://mpra.ub.uni-muenchen.de/12541/
- Busse, M., & Hefeker, C. (2007). Political risk, institutions and foreign direct investment. European Journal of Political Economy, 23(2), 397–415. https://doi.org/10.1016/j.ejpoleco.2006.02.003
- Caballe, J., & Panades, J. (2004). Inflation, tax evasion and the distribution of consumption. Journal of Macroeconomics, 26(4), 567–595. https://doi.org/10.1016/j.jmacro.2003.06.001
- Cebula, R. J. (1998). Determinants of aggregate income-tax-evasion behavior: The case of the US. BNL Quarterly Review, 51(206), 273–290. https://doi.org/10.13133/2037-3643/10599
- Cebula, R., & Foley, M. (2010). Personal income tax evasion determinants revisited: An exploratory study using newly available data. Academy of Economics and Finance Journal, 2(1), 17–24. https://mpra.ub.uni-muenchen.de/id/eprint/52028
- Cerqueti, R., & Coppier, R. (2011). Economic growth, corruption and tax evasion. Economic Modelling, 28(1–2), 489–500. https://doi.org/10.1016/j.econmod.2010.07.006
- Cheung, Y. W., & Lai, K. S. (1993). Finite-sample sizes of Johansen’s likelihood ratio tests for cointegration. Oxford Bulletin of Economics and Statistics, 55(3), 313–328. https://doi.org/10.1111/j.1468-0084.1993.mp55003003.x
- Cowell, F. A. (1990). Cheating the government: The economics of evasion. The MIT Press.
- Cowell, F. A., & Gordon, J. P. F. (1988). Unwillingness to pay: Tax evasion and public good provision. Journal of Public Economics, 36(3), 305–321. https://doi.org/10.1016/0047-2727(88)90013-8
- Crane, S. E., & Nourzad, F. (1986). Inflation and tax evasion: An empirical analysis. The Review of Economics and Statistics, 68(2), 217–223. https://doi.org/10.2307/1925500
- Dahles, H. (1998). Tourism, government policy and petty entrepreneurs in Indonesia. South East Asia Research, 6(1), 73–98. https://doi.org/10.1177/0967828X9800600105
- Damayanti, T. W. (2012). Changes on Indonesia tax culture, is there a way? Studies through theory of planned behaviour. Journal of Arts, Science and Commerce, 3(4), 8–15.
- Daszykowski, M., Kaczmarek, K., Heyden, Y. V., & Walczak, B. (2007). Robust statistics in data analysis – A review basic concepts. Chemometrics and Intelligent Laboratory Systems, 85(2), 203–219. https://doi.org/10.1016/j.chemolab.2006.06.016
- Dell’Anno, R., Gomez-Antonio, M., & Pardo, A. (2007). The shadow economy in three Mediterranean countries: France, Spain and Greece. A MIMIC approach. Empirical Economics, 33(1), 51–84. https://doi.org/10.1007/s00181-006-0084-3
- Dickey, D. A., & Fuller, W. A. (1981). Likelihood ratio statistics for autoregressive time series with a unit root. Econometrica, 49(4), 1057–1077. https://doi.org/10.2307/1912517
- Ehrhardt-Martinez, K., Crenshaw, E. M., & Jenkins, J. C. (2002). Deforestation and the environmental Kuznets curve: A cross-national investigation of intervening mechanisms. Social Science Quarterly, 83(1), 226–243. https://doi.org/10.1111/1540-6237.00080
- Eka, I. W. A. (2019). The impact of the Indonesian tax administration reform on tax compliance and tax revenue. Jurnal Ekonomi Dan Pembangunan, 27(1), 1–24. https://doi.org/10.14203/JEP.27.1.2019.1–24
- Engle, R. F., & Granger, C. W. J. (1987). Co-integration and error correction: Representation, estimation and testing. Econometrica, 55(2), 251–276. https://doi.org/10.2307/1913236
- Estri, R., & Djamaludin, S. (2019). Does the progressive personal income tax drives tax evasion in Indonesia? Proceeding of the 3rd International Conference on Accounting, Business & Economics (UII-ICABE 2019). pp. 23–30. Faculty of Business & Economics, Universitas Islam Indonesia, Yogyakarta, Indonesia. https://journal.uii.ac.id/icabe/article/view/14691
- Feld, L. P., & Frey, B. S. (2006). Tax evasion in Switzerland: The roles of deterrence and tax morale. Working Paper Series No. 284. Institute for Empirical Research in Economics, University of Zurich, Switzerland.
- Fisher, I. (1911). The purchasing power parity of money: Its determination and relation to credit, interest and crisis. MacMillan.
- Fjeldstad, O.-H. (2001). Taxation, coercion and donors. Local government tax enforcement in Tanzania. The Journal of Modern African Studies, 39(2), 289–306. https://doi.org/10.1017/S0022278X01003627
- Franzoni, L. A. (1998). Tax evasion and tax compliance. Working Paper Series, University of Bologna, Italy.
- Fromentin, V., & Leon, F. (2019). Remittances and credit in developed and developing countries: A dynamic panel analysis. Research in International Business and Finance, 48(April), 310–320. https://doi.org/10.1016/j.ribaf.2018.12.010
- Fuest, C., & Riedel, N. (2009). Tax evasion, tax avoidance and tax expenditures in developing countries: A review of the literature. Report prepared for the UK Department for International Development (DFID), Oxford University Centre for Business Taxation.
- Gaspareniene, L., Remeikiene, R., & Heikkila, M. (2016). Evaluation of the impact of shadow economy determinants: Ukrainian case. Intellectual Economics, 10(2), 108–113. https://doi.org/10.1016/j.intele.2017.03.003
- Gatti, R., & Honorati, M. (2008). Informality among formal firms: Firm-level, cross-country evidence on tax compliance and access to credit. Policy Research Working Paper 4476, The World Bank, New York.
- Gerxhani, K., & Wintrobe, R. (2021). Understanding tax evasion: Combining the public choice and new institutionalist perspectives. In E. Douarin & O. Havrylyshyn (Eds.), The palgrave handbook of comparative economics (pp. 785–810). Palgrave Macmillan. https://doi.org/10.1007/978-3-030-50888-3_30
- Gordon, R., & Li, W. (2009). Tax structures in developing countries: Many puzzles and a possible explanation. Journal of Public Economics, 93(7–8), 855–866. https://doi.org/10.1016/j.jpubeco.2009.04.001
- Gravelle, J. G. (2015). Tax havens: International tax avoidance and evasion. Congressional Research Service 7-5700. CRS Report Prepared for Members and Committees of Congress.
- Hajawiyah, A., Suryarini, T., & Tarmudji, T. (2021). Analysis of a tax amnesty’s effectiveness in Indonesia. Journal of International Accounting, Auditing and Taxation, 44(September), 100415. https://doi.org/10.1016/j.intaccaudtax.2021.100415
- Hanousek, J., & Palda, F. (2004). Quality of government services and the civic duty to pay taxes in the Czech and Slovak Republics and other transition countries. Kyklos, 57(2), 237–252. https://doi.org/10.1111/j.0023-5962.2004.00252.x
- Hanousek, J., & Palda, F. (2005). The evasional Kuznets curve: A possible shadow economy dynamics during the transition. Japanese Journal of Comparative Economics, 52(1), 1–17. https://www.jstage.jst.go.jp/article/jjce/52/1/52_1_1/_pdf
- Hansen, B. E. (1992). Tests for parameter instability in regressions with I(1) processes. Journal of Business and Economic Statistics, 10(3), 321–335. https://www.jstor.org/stable/1392149
- Harris, J. R., & Todaro, M. P. (1970). Migration, unemployment and development: A two-sector analysis. American Economic Review, 60(1), 126–142. https://www.jstor.org/stable/1807860
- Hjalmarsson, E., & Osterholm, P. (2010). Testing for cointegration using the Johansen methodology when variables are near-integrated: Size distortions and partial remedies. Empirical Economics, 39(1), 51–76. https://doi.org/10.1007/s00181-009-0294-6
- Huber, P. J. (1964). Robust estimation of a location parameter. The Annals of Mathematical Statistics, 35(1), 73–101. https://doi.org/10.1214/aoms/1177703732
- Indupurnahayu I, & Walujadi, D. (2019). Shadow economy and loss of potential taxes in Indonesia: Empirical study 1990-2018. Opcion, 35(20), 2899–2921. https://produccioncientificaluz.org/index.php/opcion/article/view/31628
- Iskandar A, & Mulyawan, A. W. (2017). Analisis underground economy Indonesia dan potensi penerimaan pajak. Jurnal Info Artha, 1(1), 60–78. https://doi.org/10.31092/jia.v1i1.18
- Jappelli, T., & Pagano, M. (2002). Information sharing, lending and defaults: Cross-country evidence. Journal of Banking & Finance, 26(10), 2017–2045. https://doi.org/10.1016/S0378-4266(01)00185-6
- Johannesen, N. (2014). Tax evasion and Swiss bank deposits. Journal of Public Economics, 111(March), 46–62. https://doi.org/10.1016/j.jpubeco.2013.12.003
- Johansen, S. (1991). Estimation and hypothesis testing of cointegration vectors in Gaussian vector autoregressive models. Econometrica, 59(6), 1551–1580. https://doi.org/10.2307/2938278
- Johansen, S., & Juselius, K. (1990). Hypothesis testing for cointegration vectors with an application to the demand for money in Denmark and Finland. Oxford Bulletin of Economics and Statistics, 52(2), 169–210. https://doi.org/10.1111/j.1468-0084.1990.mp52002003.x
- Johnson, S., Kaufman, D., McMillan, J., & Woodruff, C. (2000). Why do firm hide? Bribes and unofficial activity after communism. Journal of Public Economics, 76(3), 495–520. https://doi.org/10.1016/S0047-2727(99)00094-8
- Kafkalas, S., Kalaitzidakis, P., & Tzouvelekas, V. (2014). Tax evasion and public expenditures on tax revenue services in an endogenous growth model. European Economic Review, 70(August), 438–453. https://doi.org/10.1016/j.euroecorev.2014.06.014
- Kirchgassner, G. (2010). Tax morale, tax evasion and the shadow economy. Discussion Paper No. 2010-17. Department of Economics, University of St. Gallen, Switzerland.
- Kristianto, A. H., Widya, P. R., & Nadapdap, J. P. (2021). The portrait of the underground economy and tax evasion: Descriptive analysis from border region. Journal of Socioeconomics and Development, 4(2), 156–165. https://doi.org/10.31328/jsed.v4i2.2211
- Kwiatkowski, D., Phillips, P. C. B., Schmidt, P., & Shin, Y. (1992). Testing the null hypothesis of stationarity against the alternative of a unit root. Journal of Econometrics, 54(1–3), 159–178. https://doi.org/10.1016/0304-4076(92)90104-Y
- Loayza, N. V., & Rancière, R. (2006). Financial development, financial fragility and growth. Journal of Money, Credit, and Banking, 38(4), 1051–1076. https://doi.org/10.1353/mcb.2006.0060
- Lopez, J. J. (2017). A quantitative theory of tax evasion. Journal of Macroeconomics, 53(September), 107–126. https://doi.org/10.1016/j.jmacro.2017.06.005
- Lutkepohl, H., Saikkonen, P., & Trenkler, C. (2001). Maximum eigenvalue versus trace tests for the cointegrating rank of a VAR process. Econometrics Journal, 4(2), 287–310. https://doi.org/10.1111/1368-423X.00068
- MacKinnon, J. G., Haug, A. A., & Michelis, L. (1999). Numerical distribution functions of likelihood ratio tests for cointegration. Journal of Applied Econometrics, 14(5), 563–577. https://doi.org/10.1002/(SICI)1099-1255(199909/10)14:5<563::AID-JAE530>3.0.CO;2-R
- Moore, M. (2004). Revenues, state formation, and the quality of governance in developing countries. International Political Science Review, 25(3), 297–319. https://doi.org/10.1177/0192512104043018
- Naidoo, R., & Adamowicz, W. L. (2001). Effects of economic prosperity on numbers of threatened species. Conservation Biology, 15(4), 1021–1029. https://doi.org/10.1046/j.1523-1739.2001.0150041021.x
- Narayan, P. K. (2005). The saving and investment nexus for China: Evidence from cointegration tests. Applied Economics, 37(17), 1979–1990. https://doi.org/10.1080/00036840500278103
- Ng, S., & Perron, P. (2001). Lag length selection and the construction of unit root tests with good size and power. Econometrica, 69(6), 1519–1554. https://doi.org/10.1111/1468-0262.00256
- Nizar, M. A., & Purnomo, K. (2011). Potensi penerimaan pajak dari underground economy. Kajian Ekonomi Dan Keuangan, 15(2), 1–35. https://doi.org/10.31685/kek.v15i2.93
- Nkoro, E., & Uko, A. K. (2016). Autoregressive distributed lag (ARDL) cointegration technique: Application and interpretation. Journal of Statistical and Econometric Methods, 5(4), 63–91. http://www.scienpress.com/Upload/JSEM%2fVol%205_4_3.pdf
- OECD. (2012). Improving the tax system. OECD economic Surveys: Indonesia 2012.
- OECD. (2019). Raising more public revenue in Indonesia in a growth- and equity-friendly way. Economics Department Working Papers No. 1534, OECD Publishing, Paris.
- Panjaitan, F. P. (2007). Estimation of the Size of Indonesia’s Shadow Economy. Economics and Finance in Indonesia, 55(2), 149–176. https://doi.org/10.7454/efi.v55i2.114
- Perez, B., Molina, I., & Pena, D. (2013). Outlier detection and robust estimation in linear regression models with fixed group effects. Journal of Statistical Computation and Simulation, 84(12), 2652–2669. https://doi.org/10.1080/00949655.2013.811669
- Pesaran, M. H., Shin, Y., & Smith, R. J. (2001). Bounds testing approaches to the analysis of level relationships. Journal of Applied Econometrics, 16(3), 289–326. https://doi.org/10.1002/jae.616
- Pickhardt, C., & Sarda, J. (2011). The size of the underground economy in Germany: A correction of the record and new evidence from the modified-cash-deposit-ratio approach. European Journal of Law and Economics, 32(1), 143–163. https://doi.org/10.1007/s10657-010-9186-7
- Pickhardt, C., & Sarda, J. (2015). Size and causes of the shadow economy in Spain: A correction of the record and new evidence from the MCDR approach. European Journal of Law and Economics, 39(2), 403–429. https://doi.org/10.1007/s10657-013-9431-y
- Pohan, C. A., Kusuma, M., & Arimbhi, P. (2019). Evaluation of tax amnesty policy in an effort to increase tax revenue. Jurnal Reformasi Administrasi, 6(1), 30–37. https://ojs.stiami.ac.id/index.php/reformasi/article/view/330
- Quintin, E. (2008). Contract enforcement and the size of the informal economy. Economic Theory, 37(3), 395–416. https://doi.org/10.1007/s00199-007-0295-7
- Rahayu, S. K. (2018). Tax amnesty policy as tax reform foundation. Advances in Social Science, Education and Humanities Research, 225, 7–12. https://www.atlantis-press.com/proceedings/icobest-18/25906788
- Ramadhan, F. M. (2019). Estimation the size of underground economy and tax potential loss in Indonesia from 2000-2017. Jurnal Ilmiah Mahasiswa FEB, 7(2), 1–13. https://jimfeb.ub.ac.id/index.php/jimfeb/article/viewFile/5855/5152
- Reinsel, G. C., & Ahn, S. K. (1988). Asymptotic distribution of the likelihood ratio test for cointegration in the nonstationary vector AR model. Technical Report, University of Wisconsin.
- Richardson, G. (2006). Determinants of tax evasion: A cross-country investigation. Journal of International Accounting, Auditing and Taxation, 15(2), 150–169. https://doi.org/10.1016/j.intaccaudtax.2006.08.005
- Rousseeuw, P. J. (1984). Least median of squares regression. Journal of the American Statistical Association, 79(388), 871–880. https://doi.org/10.1080/01621459.1984.10477105
- Sabnita, N. (2019). What is known about tax amnesty: A scoping review. Jurnal Pajak Indonesia (Indonesian Tax Journal), 3(2), 36–50. https://doi.org/10.31092/jpi.v3i2.669
- Samargandi, N., Fidrmuc, J., & Ghosh, S. (2015). Is the relationship between financial development and economic growth monotonic? Evidence from a sample of middle-income countries. World Development, 68(April), 66–81. https://doi.org/10.1016/j.worlddev.2014.11.010
- Sari, D., & Mulyati, Y. (2018). The impact of tax amnesty on tax revenue and tax ratio: Case in Indonesia. International Journal of Engineering & Technology, 7(4.34), 245–247. Special Issue 34. https://doi.org/10.14419/ijet.v7i4.34.23899
- Schneider, F. (2005). Shadow economies around the world: What do we really know? European Journal of Political Economy, 21(3), 598–642. https://doi.org/10.1016/j.ejpoleco.2004.10.002
- Schneider, F. (2008). Shadow economy. In C. K. Rowley & F. Schneider (Eds.), Readings in public choice and constitutional political economy (pp. 511–526). Springer.
- Stock, J. H., & Watson, M. (1993). A simple estimator of cointegrating vectors in higher order integrated systems. Econometrica, 61(4), 783–820. https://doi.org/10.2307/2951763
- Suharto, E. (2002). Profiles and dynamics of the urban informal sector in Indonesia: A study of “Pedagang Kakilima” in Bandung. Unpublished PhD thesis. Massey University.
- Sunani, A. (2016). The ethics of tax evasion: A study of public accountants in Indonesia. Media Mahardhika, 15(1), 126–139.
- Tatariyanto, F. (2014). Taxing the underground economy: The case of Indonesia. Journal of Economics and Sustainability Development, 5(27), 236–250. https://www.iiste.org/Journals/index.php/JEDS/article/view/18354
- The Tax Justice Network. (2011). The cost of tax abuse: A briefing paper on the cost of tax evasion worldwide. The Tax Justice Network.
- Toda, H. Y. (1995). Finite sample performance of likelihood ratio tests for cointegration ranks in vector autoregressions. Econometric Theory, 11(5), 1015–1032. https://doi.org/10.1017/S0266466600009956
- Torgler, B. (2005). Tax morale in Latin America. Public Choice, 122(1–2), 137–157. https://doi.org/10.1007/s11127-005-5790-4
- Yitzhaki, S. (1974). A note on income tax evasion: A theoretical analysis. Journal of Public Economics, 3(2), 201–202. https://doi.org/10.1016/0047-2727(74)90037-1
- Zhou, S. (2001). The power of cointegration tests versus data frequency and time spans. Southern Economic Journal, 67(4), 906–921. https://doi.org/10.1002/j.2325-8012.2001.tb00380.x
- Zucman, G. (2013). The missing wealth of nations: Are Europe and the U.S. net debtors or net creditors? Quarterly Journal of Economics, 128(3), 1321–1364. https://doi.org/10.1093/qje/qjt012