
 ?Mathematical formulae have been encoded as MathML and are displayed in this HTML version using MathJax in order to improve their display. Uncheck the box to turn MathJax off. This feature requires Javascript. Click on a formula to zoom.
Abstract
Indonesian rice production has exhibited a positive increasing trend over the years. On the other hand, rice retail prices tend to fluctuate, even though the country has imported rice. One reason for this is that not all of the rice produced is sold to the market or marketed surplus. The objective of this study is to analyse the marketed surplus of Indonesian rice production and its determinants. The rice farmers’ survey conducted by Statistics Indonesia in 2014 was utilised. The Heckman two-step procedure was utilised to address the sample selectivity bias. The results indicate that the rice marketed surplus in Indonesia was 50 percent, with the highest in Java at 57percent, while outside Java, the marketed surplus was 48 percent. From the variables analysed, three variables were significant, and the sign was consistent among locations. Meanwhile, the output price has different effects on the three locations.
1. Introduction
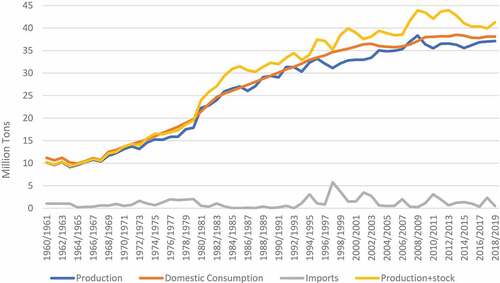
Rice is a staple food for Indonesia. Most of the rice produced by smallholder farmers may be sold to the market or kept for consumption or other purposes. Indonesia’s rice production has increased in recent years. From 1960 to 2019, rice production increased by 2.4 percent annually (). Meanwhile, consumption increased by an average of 2.2 percent annually in the same period (). In recent years, domestic consumption has exceeded domestic production, causing the government to import rice to have buffer stock to avoid price increases.
Figure 1. Production, consumption, stock and import of rice in Indonesia.
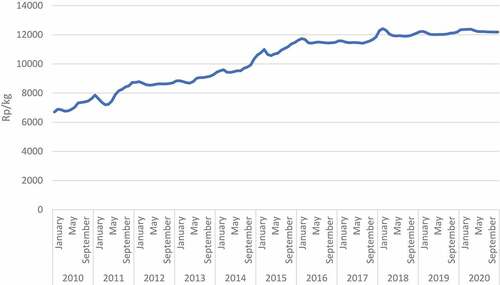
In Indonesia, rice is a commodity which contributes to inflation. Maintaining a stable consumer price of rice is one of the objectives of the government. Although imports have been conducted, the consumer price has an increasing trend. From the monthly data from January 2010 to December 2020, the consumer price increases by an average of 0.47 percent monthly () (Statistics Indonesia, Citation2021). The highest increase occurred in 2010, with an average increase of 1.18 percent; in 2012, the average price decreased by 0.02 percent (Statistics Indonesia, Citation2021).
Figure 2. Wholesale rice price in Indonesia, January 2010-December 2020.
One of the reasons that the price still has an increasing trend despite rice imports is that not all the production is sold by the farmers, or it is called a marketed surplus. There are three concept of marketed surplus, namely gross marketed surplus, net marketed surplus and marketable surplus (Sharma & Wardhan, Citation2017). In this study the author used the term of marketed surplus. Marketed surplus is defined as the total quantity of gross output produced by the farming household minus the part used for payments to labour and landowners and for household consumption and other uses or, in other words, the quantity sold to the market (Raquibuzzaman, Citation1966). At the macro level, the marketed surplus is important because it indicates the supply of products in the market. It is assumed that production equals the amount of product sold in the market, which can be biased. Therefore, it is important to analyse the amount and determinants of marketed surplus and how to increase the rice supply in the market. The objective of this research is to calculate the amount of rice marketed surplus and analyse its determinants of rice marketed surplus in Indonesia.
2. Literature review
Research on marketed or marketable surpluses has been conducted since the 1960s. Several authors have constructed a theoretical and empirical framework for marketed and marketable surplus, such as Krishna (Citation1962, Citation1965), Mubyarto (Citation1965), Behrman (Citation1966), Bardhan (Citation1970), Toquero et al. (Citation1975), and Chinn (Citation1976). Most of these early studies analysed the response of price and output to the marketed and marketable surplus. Strauss (Citation1984) added not only price and output, but also all prices (including wages), household characteristics, farm characteristics, and any exogenous income. Sawit (Citation1993) calculated the elasticity of marketed surplus as part of a complex household model which involved more than one commodity and more than one season.
Recent research on marketed surplus is mostly concerned with its determinants, not only price and output. Abdullah et al. (Citation2019) for the case of Pakistanis rice farmers showed that the determinants of marketed surplus were the gender of the household head, age, number of family member who assists in farming, household size, vocational training, and the farmer being landlord and farm size. In the case of rice farmers in India, Sharma (Citation2016) revealed that price received, access to credit, access to regulated markets, farm size, and awareness about minimum support price (MSP) affect marketed surplus, while family size is not significant. In other areas of India, Goyal and Berg (Citation2004) concluded that, besides price adjustment, technological improvement and non-price factors are also of critical importance for increasing output supply and, hence, marketed surplus. Kyaw et al. (Citation2018) studied rice in Myanmar and used a two-step Heckman procedure and concluded that the amount of marketed surplus is determined by household characteristics such as household head age, education, size, income, livestock ownership, access to roads, distance to market, and market information. In addition, it is also affected by farm characteristics such as rice production, rice price, membership of farmers’ organisations, and access to extension services. In the case of Northern Thailand, the determinants of rice commercialization have been mostly affected by the state policies towards farmers’ access to resources (land and water) and inputs which includes seed, fertilizer, extension and credit (Suebpongsang et al., Citation2020).
Three measurements were used to calculate the marketed surplus. First, Harahap H.S. Nusril and Sukiyono (Citation2007), Romdhon M. Nusril and Listaris (Citation2008), Ilham et al. (Citation2010), Sharma (Citation2016), and Cazzuffi et al. (Citation2020) used the share of products sold to the total production in value or quantity. Secondly, using the quantity of sold as a measurement of marketed surplus which is used by Alam and Afruz (Citation2002), Goyal and Berg (Citation2004), Masyhuri and Novia (Citation2014), and Bakari (Citation2018). Using this measurement and a double log regression, the coefficient is elasticity. Lastly, we use a binary variable and calculate the regression using a probit or logit. Abdullah et al. (Citation2019) conducted this measurement.
In Indonesia, Indonesian rice farmers commonly keep the rice produced for their own necessity. Indonesian farmers maintain their production for three reasons. First, farmers still pay hired labour to rice (Ellis et al., Citation1992; Harahap H.S. Nusril & Sukiyono, Citation2007; Ilham et al., Citation2010). Farmers pay for services by allocating or proportion from production. Java has two systems of payment by production: open and closed (Ellis et al., Citation1992). The open system is when the harvest is conducted by only a few hired labourers, while the open system anyone can participate in harvesting. The close system has a proportion of 1:4 to 1:6 and a close system between 1:9 and 1:10 (Ellis et al., Citation1992). The proportion used depends on the availability of labour in the village; the more abundant the labour, the less hired the labour received (Ilham et al., Citation2010). In some areas, farmers also paid land rent using harvested rice, and some paid input, such as fertiliser, with harvested rice and will be paid after harvest (Harahap H.S. Nusril & Sukiyono, Citation2007).
Second, rice will be used for farming in the coming season as a seed. According to a survey conducted by Statistics Indonesia (Citation2014), 50.6 percent of the farmers used their own seeds. Finally, the main objective of farmers keeping their rice is family consumption (Ellis et al., Citation1992; Harahap H.S. Nusril & Sukiyono, Citation2007; Ilham et al., Citation2010). Based on previous research, the share of rice production for consumption varies below 10 percent (Harahap H.S. Nusril & Sukiyono, Citation2007; Ilham et al., Citation2010) but these studies mainly focused on limited areas, such as villages or sub-districts. There is also a tendency for rice consumption in Java to be higher than in other areas (Ellis et al., Citation1992).
Mubyarto (Citation1965) pioneered research on the marketed surplus in Indonesia. The model postulates that the marketable surplus of rice of Indonesian farmers is a function of the income and price elasticity of rice production, the income and price elasticity of demand, and the output marketing ratio. In recent years, researchers have focused more on the determinants of the marketed surplus rather than calculating elasticity. Masyhuri and Novia (Citation2014) for the case in Banyumas conclude that production, seed price, pesticide price, total revenue, food expenditure, land area, farmers’s age, number of family members, number of plot and irrigation affected the marketed surplus. Meanwhile, in the case of villages in Bengkulu Province, Harahap H.S. Nusril and Sukiyono (Citation2007) found that production, family members, rice prices, and land ownership affected the share of products sold to the market. In addition, for the case of one district in Gorontalo province, Sulawesi, Bakari (Citation2018) found that production, off-farm income, and farmers’ loans significantly affect marketed surplus. For larger samples, Ilham et al. (Citation2010) indicated that rice prices affected the marketed surplus in Java, while family members affected the marketed surplus in households outside Java Island.
Most of the research on rice marketed surplus in Indonesia is limited to one district or even a village, except for Ilham et al. (Citation2010) in several locations in Indonesia. This study covers Indonesia, with a total of 87,330 farmers.
3. Theoretical framework
Strauss (Citation1984) defined marketed surplus (MS) as the difference between the amount produced (Qp) and the amount consumed (Qc). Therefore, the marketed surplus formula is as follows.
To produce Qp, farmers need to utilise the available resources by buying in the market or using their own resources. Therefore, the amount produced (Qp) is determined by the price of output (Py) and input (Px). In addition, it depends on the farmers’ farm characteristics (z) and technology (k).
Meanwhile, the amount of product consumed depends on the consumer’s food price (Pf), as farmers also act as net consumers and farmers’ household characteristics (h).
Then, the marketed surplus is the function of:
4. Methods
The data used in this research were obtained from the Rice Household Survey conducted by Statistics Indonesia in 2014. The data collected were based on the 2013 information. The complete data consisted of 87,330 respondents from all over Indonesia.
Following Abdullah et al. (Citation2019) and Mirie and Zemedu (Citation2018), the generalised Heckman two-step model was used for econometric analysis to determine the factors that influenced marketed surplus. This procedure corrects sample selection bias from randomly sampled samples (Heckman, Citation1979). The Heckman two-step model involves estimation of the two equations. Among the two dependent variables, the first is whether a household sells its rice to the market, which is predicted using a probit model or the market participation equation. The equation used is as follows:
In the first equation, the dependent variable is in the form of a dummy variable where the value equals one when the farmer sells more than 50 percent of the rice produced and the value equals zero when the farmer keeps more than 50 percent of the rice produced following Abdullah et al. (Citation2019).
The second dependent variable is the value sold by the household to the market. In the second equation, the model is solved using ordinary least squares (OLS) by adding an inverse Mills ratio (IMR) variable calculated from the first equation. The IMR variable controls for selectivity bias (Heckman, Citation1979). The equation used is as follows:
Where:
LSold = amount of rice sold (kg)
DSold = value of 1 when the farmer sells their rice and 0 when farmers keep all their rice.
Age = age of farmer (years)
Educ = number of farmer’s education year (years)
Area = amount of harvested area (m2)
Prod = amount of unhusked rice produced (kg)
FLab = amount of family labor (man hour)
Price = price of unhusked rice (Rp/kg)
DSex = dummy for household head (1 = male, 0 = female)
DOF = dummy owned finance (1 = owned, 0 = external)
DAid = dummy government assistance (1 = receive assistance, 0 = do not receive assistance).
DGro = dummy group member (1 = member, 0 = non-member)
DLtyp = dummy land type (1 = irrigated, 0 = non-irrigated)
DLStat = dummy land ownership (1 = owned, 0 = rent)
DJav = dummy location (1 = Java, 0 = others)
DSum = dummy location (1 = Sumatra, 0 = others)
IMR = inverse mills ratio
The independent variables for the two equations are relatively similar, with only a slight difference in the logarithmic form. Production and price are hypothesised to have a positive impact on marketed surplus, whereas family labour has a negative impact. Family labour is a proxy for the number of household members. Farmers’ age and education can have a positive or negative impact on the marketed surplus. For the dummy variables, assistance, group, and land ownership are hypothesised to have a positive impact on market participation and marketed surplus, whereas owned finance has a negative impact. In addition, land type, land ownership, and location can have either a positive or negative impact on market participation and marketed surplus.
These equations will also be calculated for Java, Sumatra, and outside the Java and Sumatra islands. Calculating these equations to analyse different farmers’ behaviour on marketed surplus at the three locations.
5. Characteristics of rice marketed surplus
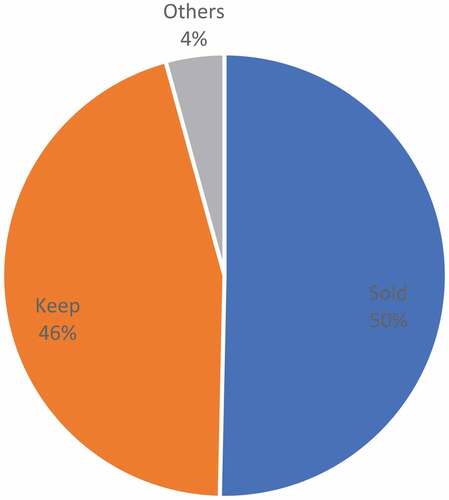
Based on the number of households, only 6 percent of the households surveyed sold all their rice in the market, while 27 percent of the households kept all their rice for their own consumption, and the other households sold and kept their rice in various percentages (). This result is supported by the findings of Noviar et al. (Citation2020) which concluded that the level of rice commercialization in Indonesia is still low. In terms of quantity, 50 percent of the rice produced was sold in the market, whereas 46 percent was consumed by the households themselves (). Rini et al. (Citation2021) for Yogyakarta, Indonesia, 59.1 percent of rice production is sold, and 40.9 percent is for household consumption. Compared to other countries, in India, the marketed surplus of rice is 78 percent (Sharma, Citation2016) meanwhile in Bangladesh, it depends on the type of rice, ranging the marketed surplus from 38 to 57.5 percent (Alam & Afruz, Citation2002). In the case of Ghana, 62 percent of farmers mostly sold their rice and 70 percent rice produced is sold (Amfo et al., Citation2022).
Figure 3. Percentage of household selling and keeping their rice production in Indonesia.
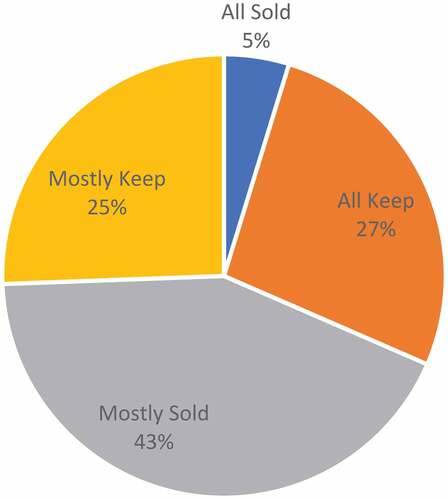
Figure 4. Percentage of rice quantity sold and kept by farmers in Indonesia.
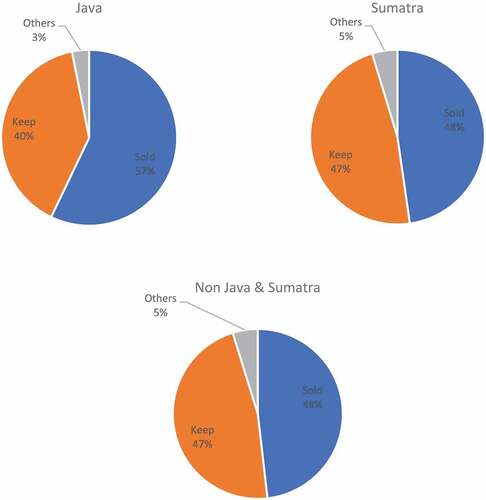
In order to analyse the different behaviour of marketed surplus in different locations, the analysis is divided into three locations: Java, Sumatra, and outside Java and Sumatra. Java had the largest percentage of households which sold all the rice (8 percent), whereas Sumatra had the largest percentage of households that consumed all the rice (29 percent; Figure ). The largest percentage of households selling their rice also resembles the quantity of rice sold in Java; 57 percent of the rice produced in Java was sold to the market, while on the other two locations, less than 50 percent was sold to the market (Figure ). According to Ilham et al. (Citation2010), the marketed surplus in wet land in Java was 81.85 percent, wet land outside Java was 77.04percent, and dry land outside Java the marketed surplus was 76.94 percent. Meanwhile, Romdhon M. Nusril and Listaris (Citation2008) found that in one village in Bengkulu Province, Sumatra, the rice marketed surplus was 57.38percent.
Figure 5. Percentage of household selling and keeping their rice production in three locations in Indonesia.
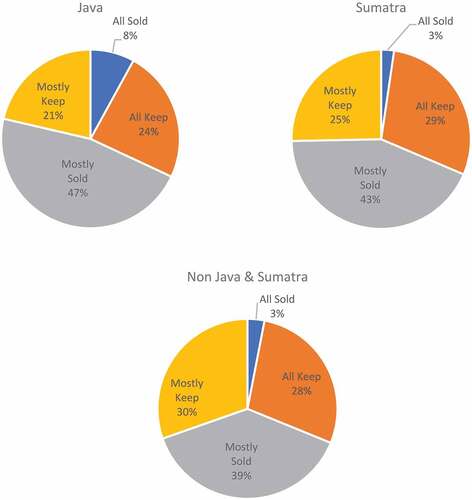
Figure 6. Percentage of rice quantity sold and kept by farmers in three locations in Indonesia.
6. Result and discussion
The first equation measures market participation and the marketed surplus in Indonesia. From the two-step Heckman procedure, 51,444 farmers were selected in the equation or 62.58 percent of the farmers were selected in the equation to avoid respondent selection bias ().
Table 1. Equation results for market participation and marketed surplus in Indonesia
In the market participation equation (EquationEquation 1(1)
(1) ), the dependent variable is a dummy variable where 1 is when the farmer sells their rice to the market more than 50 percent and 0 when the farmer keeps the rice more than 50 percent they produced (Abdullah et al., Citation2019). The results indicate that all variables are significant except for education. Land area, production, and price have a positive and significant impact on farmers’ decision to sell their rice, although the coefficients are relatively small. Kyaw et al. (Citation2018) also found that, in the case of Myanmar, an increase in production will increase market participation. Meanwhile, family labour, as a proxy for the number of family members, has a negative and significant effect, meaning that larger families tend to keep their rice for their own consumption. For the dummy variable, the largest coefficient is the owned finance variable, indicating that farmers with owned capital have a higher probability of selling their rice to the market than those with external finance. Meanwhile, for location, farmers in Java have a higher probability of selling their rice in the market than farmers outside Java and Sumatra.
For the marketed surplus equation (EquationEquation 2(2)
(2) ), the results indicate that the land area, production, and output price have a positive and significant impact on the marketed surplus. Production has a higher impact than price; an increase of one percent in farmers’ rice production will increase the rice sold by 1.06 percent, while an increase of one percent in rice price will increase the amount of marketed surplus by only 0.14 percent. The positive impact of production to marketed surplus was also hypothesized by Bardhan (Citation1970). Meanwhile, the elasticity is relatively low compared to that found by Sawit (Citation1993) in the case of West Java farmers, with a price elasticity of 2.346. Increases in production can be achieved by increasing productivity or land area, and is the most effective in increasing marketed surplus in Indonesia. Based on the data, the average productivity is 2.8 ton/ha which can still be increased in the future. Meanwhile, an increase in the producer price of unhusked rice will have farmers more incentive to sell rather than keep for consumption purposes.
Meanwhile, family labour has a negative and significant impact on the marketed surplus. The family labour variable is the proxy for the number of household members which indicates that higher family labour will decrease the amount of unhusked rice sold. A higher number of household members need higher rice consumption; instead of buying rice from the market, farmers tend to keep the rice they produce to fulfil household needs.
For the dummy variables, farmers with owned finances belonging to the farmer’s group, irrigated land, owned land, and living in Java had a higher marketed surplus. Farmers belonging to the farmer’s group and irrigated land are more active farmers and tend to be more commercialised. In the case of irrigated land, the result was similar with the case of Cambodia where farmers with irrigated land have higher value of marketed surplus (Sareth et al., Citation2020). Meanwhile, farmers living in Java have better infrastructure to sell their production or the buyer came to their land.
To analyse market participation and marketed surplus in three different locations, three pairs of equations were calculated. The equations were calculated for Java, Sumatra, Java, and Sumatra. In Java, market participation is relatively similar in terms of significance and signs. The only difference is in the household characteristics, where in Java, education has a positive and significant impact, while the head of household age is not significant (). Farmers in Java are more well-educated than farmers outside Java.
Table 2. Equation results for market participation and marketed surplus in Java
For the marketed surplus equation, the main difference is the impact of the price. In Java, a one percent increase in rice prices decreases the number of rice sold to the market by 0.07 percent. Therefore, in Java, an increase in rice prices will make households keep their rice for consumption rather than selling it to the market. Meanwhile, the elasticity of production is higher than that of Indonesia; in Java, an increase of production by one percent will increase the amount of rice sold by 1.12 percent.
For the dummy variables, Java being a member of the farmer’s group does not have any effect on marketed surplus. Meanwhile, the effect of irrigation was higher in Java than in Indonesia. In Java, farmers with irrigation sell 21 percent more rice to the market than non-irrigated farmers, while the difference in Indonesia is only 7 percent.
The next equation is for Sumatra; the rice price variable does not have any significant effect on market participation, whereas the other variables are relatively similar to Indonesia’s case (). For the marketed surplus equation, compared to the other two locations and Indonesia, the Sumatra-owned finance variable is the largest, with a coefficient of 0.11. This indicates that farmers with their own finances sell 12 percent more rice to the market than farmers with external financing do. Farmers in Sumatra usually own other crops, such as estate crops which act as cash crops. Therefore, they do not depend solely on rice for their income.
Table 3. Equation results for market participation and marketed surplus in Sumatra
The last equation is used for Java and Sumatra. In the market participation equation, is relatively similar to other locations except for outside Java and Sumatra (), where both age and education variables are significant. For the marketed surplus equation, compared with the other two locations, the coefficient of rice price is the highest. An increase of one percent in rice prices increases the amount of rice sold to the market by 0.23 percent.
Table 4. Equation results for market participation and marketed surplus in outside Java and Sumatra
Comparing the three locations, production has a positive and significant impact on the marketed surplus, although the magnitude is relatively small. Meanwhile, family labour has a negative and significant impact on the marketed surplus. Rice price was also a significant variable at the three locations, although the sign was different. In Java, the relationship between rice prices is negative, whereas in the other two locations, it is positive.
For the dummy variables, only own financing is significant and has a similar sign in all three locations. This means that farmers with their own finances sell more rice to the market than farmers with external finances.
From the three equations and three locations, three variables are significant, and the impact is consistent in all locations. These variables are production, family labour, and finance. The impact of production is relatively higher in the marketed surplus equation compared to market participation. It can be inferred that increasing rice production can increase the number of rice sold by farmers who are already selling their rice to the market, and making farmers sell their rice to the market which previously consumed all the rice for their family. However, the increase in production only slightly affected the percentage of rice sold to total production.
Family labour, as a proxy for the number of household members, is also consistent for all equations and locations, and the impact is relatively moderate. Higher family labour will decrease the amount of rice sold in the market, as it will be used for family consumption. However, the impact of the producer’s price varies between locations. This finding was similar with Bardhan (Citation1970). This indicates that the behaviour between locations differs when dealing with changes in producers. Therefore, price policy cannot be generalised to all areas to increase the marketed surplus of rice. Increasing the producer’s price will be more effectively implemented in areas other than Java rather than Java because it will increase the marketed surplus.
7. Conclusion
The amount of rice marketed surplus is 50 percent in Indonesia, and between islands, there is a different marketed surplus. Java has the highest marketed surplus at 57 percent, whereas in the other two locations, the marketed surplus is 48 percent.
The three variables are significant and the sign is consistent in the three locations affecting the marketed surplus. These variables are production, family labour, and finance. Meanwhile, the output price has different effects on the three locations. Price policy must be implemented differently between islands; in Java islands, keeping lower rice farmgate prices will increase the marketed surplus, while in other islands, increasing rice farmgate prices will increase rice sold to the market.
Acknowledgements
The author is grateful to the Department of Agribusiness, Faculty of Economics and Management, IPB University for providing the dataset for this study.
Disclosure statement
No potential conflict of interest was reported by the author(s).
Additional information
Funding
References
- Abdullah, R. F., Chandio, A. A., Chandio, A. A., Din, I. U., Ilyas, A., Din, I. U., Ilyas, A., & Din, I. U. (2019). Determinants of commercialization and its impact on the welfare of smallholder rice farmers by using Heckman’s Two-stage Approach. Journal of the Saudi Society of Agricultural Sciences, 18(2), 224–14. https://doi.org/10.1016/j.jssas.2017.06.001
- Alam, S., & Afruz, S. (2002). Marketable and marketed surpluses of some leading crops in Bangladesh: Recent trends and policy implications. Bangladesh Journal Agricultural Economics, 25(2), 115–132.
- Amfo, B., Aidoo, R., Mensah, J. O., Adzawla, W., Appiah-Twumasi, M., Akey, E. A., & Bannor, R. K. (2022). Rice marketing outlets, commercialization and welfare: Insights from rural Ghana. Journal of International Food & Agribusiness Marketing, 35. https://doi.org/10.1080/08974438.2021.2022556
- Bakari, Y. (2018). The determinant factors of rice’s marketed surplus in Bone Bolango Regency. Journal of International Conference Proceedings, 1(2), 1–8. https://doi.org/10.32535/jicp.v1i2.319
- Bardhan, K. (1970). Price and output response of marketed surplus of food grains: A Cross Sectional Study of Some North Indian Villages. American Journal of Agricultural Economics, 52(1), 51–61. https://doi.org/10.2307/1238162
- Behrman, J. R. (1966). Price elasticity of the marketed surplus of a subsistence crop. Journal Farm Economics, 48(4), 875–893. https://doi.org/10.2307/1236619
- Cazzuffi, C., McKay, A., & Perge, E. (2020). The impact of agricultural commercialisation on household welfare in rural Vietnam. Food Policy, 94, 101811. https://doi.org/10.1016/j.foodpol.2019.101811
- Chinn, D. L. (1976). The marketed surplus of a subsistence crop: Paddy rice in Taiwan. American Journal of Agricultural Economics, 58(3), 583–587. https://doi.org/10.2307/1239280
- Ellis, F., Trotter, B., & Magrath, P. (1992). Rice marketing in Indonesia: Methodology, Result and Implications of a Research Study. Natural Resources Institute.
- Goyal, S. K., & Berg, E. (2004). An analysis of marketed surplus response of Cereals in Haryana State of India. Agribusiness: An International Journal, 20(3), 253–268. https://doi.org/10.1002/agr.20014
- Heckman, J. (1979). Sample selection bias as a specification error. Econometrica, 47(1), 153–161. https://doi.org/10.2307/1912352
- Ilham, N., Kusnadi, N., Friyatno, S., & Suryani, S. (2010). Factors that determine the surplus marketed Gabah. Informatika Pertanian, 19(2), 45–75.
- Krishna, R. (1962). A note on the elasticity of the marketable surplus of a subsistence crop. Indian Journal of Agricultural Economics, 17, 79–84.
- Krishna, R. (1965). The marketable surplus function for a subsistence crop: An analysis with Indian data. Economic Weekly, 17, 309–320.
- Kyaw, N., Ahn, S., & Lee, S. H. (2018). Analysis of the factors influencing market participation among smallholder rice farmers in Magway Region, central dry zone of Myanmar. Sustainability, 10(12), 4441. https://doi.org/10.3390/su10124441
- Masyhuri, & Novia, R. A. (2014). Rice marketable surplus. In B. Krisnamurthi (Ed.), Indonesia’s rice economy. Indonesian Society of Agricultural Economics.
- Mirie, T., & Zemedu, L. (2018). Determinants of market participation and intensity of marketed surplus among Teff producers in Dera District of South Gondar Zone, Ethiopia. Journal of Development and Agricultural Economics, 10(10), 359–366. https://doi.org/10.5897/JDAE2018.0954
- Mubyarto. (1965). The Elasticity of the Marketable Surplus of Rice in Indonesia: A Study in Java-Madura [ Dissertation]. Iowa State University.
- Noviar, H., Masbar, R., Aliasuddin, S. S., Saputra, J., Saputra, J., & Saputra, J. (2020). The agricultural commercialisation and its impact on economy management: An application of duality-neoclassic and Stochastic Frontier Approach. Industrial Engineering and Management System, 19(3), 510–519. https://doi.org/10.7232/iems.2020.19.3.510
- Nusril, R. M., & Listaris, R. (2008). Marketable surplus and determinants of marketed supply and rice supply in Bengkulu City. Agrisep, 7(2), 97–108.
- Nusril, H. H. S., & Sukiyono, K. (2007). Marketable surplus of rice analysis (Case Study in Dusun Muara Aman, North Lebong Sub-district, Lebong District). Jurnal Akta Agrosia, 10(1), 32–39.
- Raquibuzzaman, M. (1966). Marketed surplus function of major agricultural commodities in Pakistan. The Pakistan Development Review, 6(3), 376–394. https://doi.org/10.30541/v6i3pp.376-394
- Rini, W. D. E., Rahayu, E. S., Harisudin, M., & Supriyadi, S. (2021). Management of Gogo Rice production in realizing the commercialization of marginal land households in Yogyakarta. International Journal of Sustainable Development and Planning, 16(2), 373–378. https://doi.org/10.18280/ijsdp.160217
- Sareth, C., Cramb, R., & Fukai, S. (2020). The role of irrigation in the commercialisation of rice farming in Southern Cambodia. In R. Cramb (Ed.), White gold: The commercialisation of rice farming in the Lower Mekong Basin. Palgrace Macmillan.
- Sawit, H. (1993). A Farm Household Model for Rural Households of West Java, Indonesia [ Dissertation]. University of Wollongong.
- Sharma, V. P. (2016). Marketable and marketed surplus of rice and wheat in India: Distribution and determinants. Indian Journal of Agricultural Economics, 71(2), 137–159.
- Sharma, V. P., & Wardhan, H. (2017). Marketed and marketable surplus of major food grains in India. Springer Nature.
- Statistics Indonesia. (2014). Rice household survey.
- Statistics Indonesia. (2021). Consumer rice price
- Strauss, J. (1984). Marketed surpluses of agricultural households in Sierra Leone. American Journal of Agricultural Economics, 66(3), 321–331. https://doi.org/10.2307/1240799
- Suebpongsang, P., Ekasingh, B., & Cramb, R. (2020). Commercialisation of rice farming in Northeast Thailand. In R. Cramb (Ed.), White gold: The commercialisation of rice farming in the Lower Mekong Basin. Palgrace Macmillan.
- Toquero, Z., Duff, B., Anden-Lacsina, T., & Hayami, Y. (1975). Marketable surplus functions for a subsistence crop: Rice in the Philippines. American Journal of Agricultural Economics, 57(4), 705–709. https://doi.org/10.2307/1238891
- United States Department of Agriculture (USDA). (2019). Indonesia’s rice milled data.