
 ?Mathematical formulae have been encoded as MathML and are displayed in this HTML version using MathJax in order to improve their display. Uncheck the box to turn MathJax off. This feature requires Javascript. Click on a formula to zoom.
Abstract
Saving is an important factor in households’ welfare in developing countries. However, most studies have focused on urban areas and at the macroeconomic level. Consequently, such studies mask the reality of rural households, which constitute a large proportion in Ethiopia. Hence, this study aims at analyzing the factors that influence the probability of saving participation at the household level in the Libokemkem District. We employed a systematic random sampling technique to select a total of 157 household heads in three kebeles in Libokemkem District, Ethiopia. We used structured questionnaires to collect data from the sampled households. We then analyzed the data using a logistic regression model. The results of the study show that family size, farm land, education status, credit access and frequency of extension contact are the determinant factors for saving participation among rural households. We recommend that the Ethiopian Ministry of Economic and Finance should strengthen the existing credit services and create awareness campaigns for the communities to enhance rural saving participation.
PUBLIC INTEREST STATEMENT
Saving is a crucial issue for rural households’ economic development. Empirical data reveals that Ethiopia is, however, marked by weak saving habits, which leave very little domestic savings accessible for investment. Additionally, the low level of saving among rural households in the Libokemkem District in particular and the Amhara Regional State as a whole is a sign that they are unable to meet their basic needs despite some farming success, which affects household capital accumulation and social wellbeing because of the socio-economic, demographic and institutional factors. As a result, the study examined the factors that influence household savings participation in rural areas, using the Libokemkem District in northwest, Ethiopia as a case study. Therefore, the ministry of economy and finance, financial extension agents, and other concerned stakeholders should make efforts to increase rural households’ participation in saving.
1. Introduction
Ethiopia is found in the Horn of Africa with a population size of more than 112 million people (as of the 2019 world bank report) accounting for a total area of 1.11 million hectares. It is the second most populous country in Africa following Nigeria and the fastest growing economy in the region. About 78.78% of its population lives in rural areas . However, it is also one of the least developed countries in the world, and the 2018 United Nations Human Development Index (HDI) categorized the country as a least developed nation and give a rank of 175 out of 189 countries in the world. Ethiopian’s 2017 HDI of 0.463 is below the average of 0.504 for countries in the low human development group and below the average of 0.537 for countries in Sub-Saharan Africa (SSA).
A large number of populations in Ethiopia are rural households, and they have a low level of literacy. The majority of the farm community is comprised of subsistence farmers who are not in a position to use high-quality seeds, sufficient fertilizers and improved farmland and limited access to credit. Because of this, smallholder farmers are generally characterized by low income, less saving and low capital formation. In line with this, rural development is hindered due to a lack of credits, weak infrastructure and poor transport systems (Wolday & Tekie, Citation2010).
Empirical evidence shows that Ethiopia is characterized by poor saving cultures which results in very small domestic savings available for investment (Aron et al., Citation2013). Countries having a higher level of saving rates have managed to reduce the burden of foreign debt and thus domestic investments will be financed by domestic savings, especially in household sectors.
Many studies have been conducted on saving in different periods and both developed and developing countries. Most of these studies focused on assessing the determinants of saving at the macro-level and there were few studies which were conducted at the household level. Although studies on the determinants of saving increasingly focus on both developed and developing countries, this phenomenon have not been well documented in Ethiopia, particularly at the household (micro) level.
In Amhara Regional State in general and in Libokemkem District in particular, saving mobilization among rural households is low and this is evident in the failure of households to provide for the basic needs of life during some convenience in farming and it has an impact on capital accumulation and thus on the economic growth of a country in general and on the financial well-being of the individual households in particular. Although significant progress has been made in recent years, in Libokemkem District expansion of saving and credit cooperatives, micro finance institutions, health insurance and the new introduction of crop insurance in pilot kebeles as well as the expansion of Bank branches in the town, they have insufficient capital, reach, and capacity to provide services at the scale they need.
In the region, in general, and Libokemkem District in particular the households’ income is characterized as seasonal and irregular, in this situation, savings are usually less considered. This is because first most of the studies carried out in the field have focused on urban areas and at the macroeconomic level rather than rural areas based on an individual or household level and are unable
to show the ground reality in the huge portion of the rural residents. And second, the limited empirical research results in Ethiopia related to household savings were conducted in rural and urban areas collectively. However, this combined research ignores the rural and urban household heterogeneity by assuming a representative household agent. Therefore, this study was carried out to analyze the determinants of rural household savings participation, which have been less addressed in the region and non in the zone, with particular reference to Libokemkem District using microeconomic evidence.
2. Literature review
2.1. Concepts and definition of saving
According to Warneryd (Citation1999), the word “saving” has a multidimensional meaning and multiple meanings. Saving is defined in economic contexts as the remaining income after deducting current spending over a given time. In contrast, saving in a psychological context refers to the process of avoiding spending money in the present to use it later. In other words, saving behaviour is the combination of future need projections, a saving decision, and a saving action. People are more inclined to define saving as investing, depositing money in a bank account, speculating, and paying off mortgages (Warneryd, Citation1999).
Saving is difficult to collect in Sub-Saharan African countries because it is often raised informally, and hence cannot be fully appraised by national accounting. Saving in OECD countries, on the other hand, is primarily comprised of property investments, and monetary and financial investments. Savings are perfectly liquid in developing countries, where households hoard money, and can be used to meet any immediate need or investment opportunity. This is especially critical given households’ lack of trust in the financial sector. Non-financial saving is also essential in developing countries (Goldstein & Barro, Citation1999). It can appear in a variety of forms as precious or semiprecious materials (jewels, carpets, etc.). In Ethiopia, precious or semi-precious commodities are regularly accumulated and exchanged against liquidities to meet lifecycle (education, marriage, immigration, etc.) or immediate expenditure needs. Non-financial household savings include real estate and other types of ownership (land, livestock, machines, etc.; Robinson, Citation1994). Robinson (Citation1994) adds construction materials, cereals, and harvest to the list of major sources of savings. In general, this type of saving accounts for a considerable portion of household savings. One of the important qualities of non-financial savings, according to Goldstein and Barro (Citation1999), is the ability to be quickly utilized in times of societal need or economic opportunity. Cereals stocks or livestock purchases can add a high motivation to economic profitability, meaning livestock accumulation is a source of profit in such a way that livestock can be easily sold; some of them produce other consumable and tradable goods (eggs, milk, wood) or others can be used as agricultural inputs in which this form of savings present some drawbacks: cattle breeding requires resources such as water, animal food, pasture, work-time and can be lost in the case of cattle breeding.
2.1.1. Types of savings
The different types of savings are mostly determined by the revenue that a home, business, or corporate body has available. Based on the sectors that account for the distribution of savings, the saving type can be categorized. Three categories, namely (a) household sector saving, (b) private sector saving, and (c) public sector saving, can be used to classify it generically. The following list of saving categories is discussed: (Nayak, Citation2013).
Household Sector saving; are those made or accumulated by the various household members. Household saving makes up a greater portion of the Indian economy, which is made up of people’s saving habits on a wider scale, including their financial and financial asset holdings. Individuals at the household level contribute to the calculation of a nation’s national income (Nayak, Citation2013).
Private Corporate Sector saving; Savings made by privately held businesses are referred to as savings made by private sector businesses. The non-governmental and non-financial corporations, private commercial banks, insurance firms, co-operative banks, credit societies, and non-credit societies, as well as non-banking financial firms operating in the private sector, make up the private corporate sector (Nayak, Citation2013).
Public Sector saving; The savings made by the public sector are divided into two categories: government savings and (ii) savings produced by the public sector enterprise in the form of internal resources. Examining the correlation between public savings and the consolidated returns insufficiency of government, a different way to calculate government savings is one method of evaluating the public sector’s savings (Nayak, Citation2013).
2.1.2. Forms of savings
Individuals and families need to decide where to save to identify their greatest fulfilment as well as to ensure the security of their money. According to Railly (Citation1992), people start saving money when their incomes exceed their current consumption needs, and an abundance of investment funds should be feasible in a variety of ways. According to Railly (Citation1992), families can choose to store money under their beds or on the terrace until a future time when expenses outweigh their current income. Generally speaking, there are two main places where families might keep any reserve money they intend to use (Railly, Citation1992).
Formal Savings; Savings that are kept in official financial institutions, such as commercial banks or other non-bank financial organizations like insurance companies, credit unions, or savings and loans firms, are known as formal savings (Boating, Citation1994). The pro-poor are greatly assisted in managing their financial resources and escaping extreme poverty by having access to formal saving services. If deposit services are properly considered and adapted to the low’s saving habits, they are just as significant for the poor as loan services.
Informal Savings Institutions; any savings that take place in the economy’s non-formal sector are referred to as informal savings. The informal financial sector engages in every commercial savings and loan transaction that occurs in the developing economy outside of the formal sector. Various forms of informal saving exist in Ethiopia (Work, Citation2000). These include privately run rotating saving and credit clubs like iddir and iqub, which were created and organized by the participants themselves based on reciprocal financial relationships. The most significant informal organizations are iddir and iqub, which are founded on pre-existing social ties. The informal saving institutions help in consumption smoothing during economic shocks and provide an opportunity to accumulate large sums of money for future investment and household outlays.
2.1.3. Benefits of saving
Saving has numerous advantages for both the saver and the country as a whole. Savings are advantageous for people since they can utilize them for education, retirement benefits, house payments, new automobile purchases, and emergency needs. Savings not only enable income growth and rising consumption but also level out spending in the face of a variety of uncertainty. Only when the causes of uncertainty decision makers face and their options for dealing with them are identified can saving behaviour be fully understood.
As Gedela et al. (Citation2012) put it, since classical times, saving has been considered one of the determinants of growth. He also suggested that to achieve a higher rate of growth with relative price stability, the marginal propensity to save should be raised by appropriate incentives and policies. In general, Defina (Citation1984) summarized that saving is crucial to a growing economy because it makes resources available for the production of physical capital, for the research and development needed to fuel economic growth, and to enhance our standard of living. Coupling this important role of saving with the anxiety of policymakers, it is not surprising that legislators have backed tax reforms aimed at eliminating perceived anti-saving biases in the code.
2.1.4. Purpose of saving
According to Robinson, Citation1994), the main reasons people save money are for their health, retirement, sudden loss of income, and to protect against seasonal fluctuations in income. They also save money for long-term household goals like consumer durables, social obligations, and future investments. Saving is one method that households and individuals in poor nations have used to manage risk (Burrit, Citation2006)).
2.2. Theoretical framework
There are several hypotheses of saving that are implied by consumption theories (hypothesis) as the amount of income not consumed is saved. These include the Keynesian Absolute Income Hypothesis, Duesenberry's Relative Income Hypothesis, Friedman’s Permanent Income Hypothesis, and Modigliani Life Cycle Hypothesis. These hypotheses are discussed very briefly as part of theoretical literature. The Keynesian absolute income hypothesis asserts that individuals save out of their current income to smooth the expected consumption over time. The effect of the precautionary savings is realized through its impact on current consumption, as individuals postpone their current consumption to maintain the utility level of consumption in the future if income drops. Thus saving is only possible if someone has more than enough to meet the basic needs and can only save what is left after paying for such basic needs. According to the relative income hypothesis of Duesenberry, higher growth rates lead to higher saving rates, which is inconsistent with the lifecycle or permanent-income theory, since the lifetime resources of an individual increase as the growth rate increases (Nayak, Citation2013). The permanent income hypothesis on the other hand states that people will spend money at a level consistent with their expected long-term average income. A household will save only if its current income is higher than the anticipated level of permanent income, to guard against future declines in income. According to this hypothesis, income growth is one of the primary determinants of domestic savings through its effect on the lifetime income of the working population. This is because, a higher rate of income growth raises the aggregate income of active workers relative to those not earning labour incomes and this will raise the lifetime resources of workers on which consumption and saving depend (Nayak, Citation2013). Finally, Franco Modigliani and Richard Brumberg’s life-cycle hypothesis presume that individuals base consumption on a constant percentage of their anticipated life income. With population growth, there are more young people than old, and more people are saving than are not saving, so the total not saving of the old will be less than the total saving of the young, and there will be net positive savings. If incomes are growing, the young will be saving on a larger scale than the old are not saving so economic growth, like population growth, causes positive saving, and the faster the growth, the higher the saving rate (Nayak, Citation2013). The life cycle hypothesis identifies growth in per capita income as one of the important determinants of saving rates because people are forward-looking and base their savings decisions on lifetime income. However, in reality, the current level of income also plays a significant role in explaining saving behaviour.
2.3. Determinants of rural household saving participation
There are several empirical evidence in Africa and Ethiopia that how rural household saving participation can be determined. According to (Birhanu, Citation2015) findings households’ savings behaviour in Ethiopia indicates that many extension contacts, illiteracy and access to market information have significant positive correlations with the likelihood that a household would save. Moreover, land holdings (bad production season last year) have significantly positive (negative) effects on the expected amount of money a household would save. Bealu, Citation2020) empirically examined the determinants of savings behaviour among rural households in the case of Boricha woreda, Sidama zone, southern Ethiopia were concluded that household head education level, livestock holdings, membership in cooperatives service, income, age, training participation have a significant positive correlation with saving.
The annual income of the household has a positive significant effect on both the decision to save and the amount of saving as predicted in the theoretical and empirical literature. An increase in incomes of households increase their tendency to participate in saving and the amount they save. This is because such households will have income left for saving after paying for consumption expenditure. Landholding size has no significant effect on their decision to save, but their level of saving increases as land size increases, which may be related to the potential of households to produce more and get more income for saving (Bogale, Citation2017).
Marital status is found another significant determinant factor for household savings. Since the descriptive statistics showed that 83.9% of the sampled households are male-headedhouseholds, the main reason for the finding might be the fact that most female partners are spouses that make their liquid money contribution very less. Furthermore, there are also social and other costs added most of the time for married individuals (Tsega & Yemane, Citation2014). The education status of household heads is another important variable in influencing their saving levels. The study analyzed the effect of education at three levels; primary, secondary and college diploma or above and found statistically significant effects on their decision to save and the amount they choose to save. This is theoretically justified by the fact that education has the probability to increase households’ awareness of saving and also their capacity to save as more educated households have wider possibilities of earning more income than not educatedones.
Distant location of saving institutions such as banks and microfinance institutions has negative significant effect on the decision of households to save (Bogale, Citation2017). Some of the significant explanatory variables of rural household savings in the study area were household head education level, livestock holdings, membership in cooperatives service, income, age, and training participation. This study shows rural farm households indeed save in respective of their low economic status. However, as these households mainly use informal saving institutions, their savings are hardly traced to the national account. Policy wise efforts should be made to encourage rural households to save through training and using the formal channel. Consequently, policies targeting and encouraging training, membership in cooperatives and access to education in rural households would promote savings in rural households in the study area.
The study conducted by Bogale (Citation2017) particularly addressed the households’ decision to save and their level of saving using the double hurdle process and confirmed the importance of family composition and age, household income and family asset holding, education and employment status of households at influencing households’ decision to save and their amount of saving. The data also confirmed the use of formal financial institutions and informal saving options for households who decide to save. The reasons for households to save are largely guided by meeting unexpected expenses in the future. Moreover, nearly 32% of households use informal saving options owing to a lack of awareness about the use of formal institutions, low annual income and distance of the institutions away from their residence.
According to (Fentahun et al., Citation2019), the study explores farm household saving habits in the southwest Amhara growth corridor by employing the ordered probit regression model results revealed that the saving habits of the farm household were found to be very low. Of the total sample farm households, only 35% and 30.2% have regular and irregular saving habits respectively while the remaining 35% of the household have no saving habits at all. Order probit model results show that saving habit is likely influenced by education, land holding size, ownership of saving account, aid, changes in expected income, spending on festive, community-based health insurance, access to technology (mobile), number of formal financial institution nearby, remittance and access to credit.
Saliya (Citation2018) studied the determinants of urban household saving behaviour in the Mekelle city dependency ratio of the household and was shown to have a negative and significant influence on household saving decisions. This means that when the dependency rate increases the saving performance of households is reduced. Thus, this finding shows a clear need to educate households to have families that are sized based on their total household income.
A study conducted on saving habits and their determinants in Amhara National Regional State that 37.9% of the respondents were found to have no saving habit, while 62.1 % of them were savers at the time of the study period. The study also found that average monthly income and income from family numbers have a direct association with the saving habits of the community in the region. The analysis established that saving habits were significantly affected by educational level, employment status, and marital status, relation to the head of the household, effects of weather conditions, current living status, and alcohol use. On the other hand, sex, marital status, any asset from parents, and social relation with others has no significant effect on the saving habits of the respondents. Educating the people and creating job opportunities improve saving habits in the community (Haile, Citation2017).
(Fentahun et al., Citation2019) study, which was conducted to explore farm household saving habits in southwest Amhara results, revealed that the saving habit of the farm household was found to be very low. Accordingly, of the total sample of farm households, only 35% and 30.2% have regular and irregular saving habits respectively while the remaining 35% of the household have no saving habits at all. The empirical finding of this result shows that saving habit is likely influenced by education, land holding size, ownership of saving account, aid, changes in expected income, spending on festive, community-based health insurance, access to technology (mobile), number of formal financial institution nearby, remittance and access to credit.
Empirical study evidence on the determinants of household saving in Amhara Regional State specifically from the former North Gondar Zone result showed that 54.1% of sample households practised saving and the common reasons for households not to save are low income, inflation, low-interest rate, cultural background, education, social affairs and unemployment. Besides the descriptive, the economic analyses show that income, age, sex, marital status, forms of institutions used for saving and frequency of getting money are significant determinants of household savings in the study area (Tsega & Yemane, Citation2014).
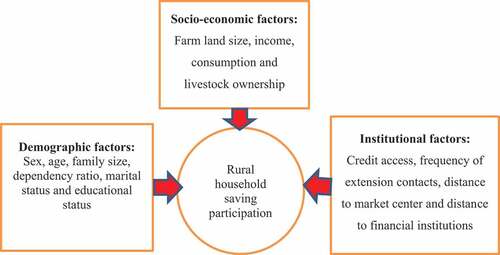
In summary, the reviews on factors that determine rural household’s saving participation indicated, that the effect of demographic, socio-economic and institutional factors was different in different areas (). This indicates that, to identify factors that determine rural household’s saving participation in different areas location and resource-specific research should be conducted. Besides, the review shows that logit was a more appropriate model.
Figure 1. Conceptual framework for determinants of rural household saving participation.
3. Materials and methods
3.1. Description of the study area
The research was done in the Libokemkem region of Amhara Regional State’s South Gondar zone. It is located south of the Central Gondar district of W/Belesa, west of Ebinat, north of the South Gondar district of Fogera, and east of Lake Tana. Addis Zemen, the district’s centre, lies roughly 80 kilometres from Bahir Dar and 652 kilometres from Addis Abeba. It is located on the highway between Bahir Dar and Gondar. Libokemkem district has a total area of 1081.57 square kilometres, of which 42% is plain, 30% is uneven, 21% is mountainous, 6%is a water body, and 1% is gorge. It is made up of 39 kebeles, 33 of which are rural. Libokemkem district is geographically located between 44.6–32.6 north latitude and 4.89 and 30.9 east longitude at an altitude of 1800 and 2850 meters above sea level (). The district contains the agro-ecological zones of Dega and Woina-Dega. Woina-Dega accounts for 78% of the district’s total area, while Dega accounts for 22%. The district’s typical temperature ranges between 18 and 250 degrees Celsius, while the average annual rainfall is between 900 and 1400 millimetres (LKWAO, 2019).
Figure 2. Map of Libokemkem District.
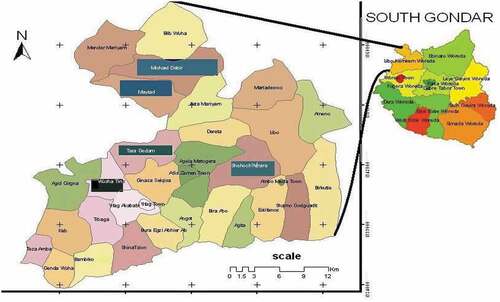
According to the district Agriculture Office, agriculture is vital to the rural people’s livelihood. The district’s population is primarily involved in mixed farming (92%). The production method, like that of the rest of the country, is traditional and heavily reliant on meher rain. It is the area’s primary source of household income and subsistence. The community’s other sources of income are minimal. Crop cultivation is the principal agricultural activity that accounts for the majority of the revenue earned by most households in the district.
Teff, finger millet, maize, wheat, and rice are the principal cereal crops grown in the area. Pulses and oil crops are also grown in the area, though on a much smaller scale. In addition, cash crops like potato, onion, tomato, cabbage, garlic, pepper, fenugreek, and spices are grown in the district.
3.2. Data type and sources
This research has attempted to integrate the quantitative and qualitative data. Generally, information has been collected from secondary and primary sources. Various documents (published and unpublished) were reviewed to collect secondary data. Different websites were browsed to obtain secondary data and ideas related to the issues under investigation. Besides, relevant theoretical literature and empirical studies were done in the country and in other developing countries were reviewed. Primary data were collected through household surveys, key informants’ interviews and focus group discussions (FGDs).
3.3. Sampling size and sampling technique
A two-stage sampling technique was used to select the representative households from the study area. Libokemkem District was selected purposively taking into consideration of time, budget, and accessibility issues to investigate the saving participation of the rural households. Three kebeles (Bura, Bira, and Agela mantogera) were selected out of 34 rural kebeles using a simple random sampling technique to yield maximum precision per cost, minimize bias and give an equal chance to be sampled for kebeles. As the household was considered a basic sampling unit, 157 households (57 household heads from Bura, 55 household heads from Bira and 45 household heads from Agelamantogera) kebeles were selected using systematic sampling techniques proportional to the population. The systematic sampling technique was preferable to the other because the technique has spatially more efficient than the other since the rural settlement is dispersed. The first household was selected by lottery method for each sample kebele and the rest survey points were selected within 25 intervals.
An interview schedule, comprising household demographic characteristics, institutional characteristics, socio-economic characteristics and other issues related to rural saving, was developed to collect quantitative and qualitative data. Before undertaking the fieldwork for data collection, the first draft interview schedule was developed in English and submitted to the research advisor for comments and suggestions. Based on the feedback, improvements/revisions were made. For the actual survey work, the interview schedule was translated to Amharic for enumerators to easily understand it and facilitate clear communication and discussion with respondents.
To collect a reliable and representative sample out of the target population the sample size was determined by applying the scientific formula (Yemane, Citation1967) as shown below. The possible justification for preferring this scientific formula was that the sampling frame of the study was below
Where n is the study’s sample size, N is the total number of rural households (savers and non-savers) (3903) in the chosen Kebele during the survey year (2020/2021), and e is the study’s precision level or sampling error, which in this study will be 0.08 because the study area’s socioeconomic characteristics and agroecology were homogenous. The formula was used to choose 157 samples. As a result, 157 samples were chosen from each chosen Kebele using the population proportion.
Then, n = 3903 = 157
1+3903(0.08)2
Descriptive statistics χ2 test was used to identify the relationship between savers and the non-savers of dummy and categorical variables and a t-test was used to compare the means of continuous variables as a method of data analysis using SPSS software.
3.4. Method of data collection
Before conducting the survey, the following activities were carried out in this study. The questionnaires are first translated into the local language (Amharic). This study’s data collection was compiled from both qualitative and quantitative primary and secondary data sources. Structured sample household head interviews were used to acquire primary data.
3.5. Data analysis
Descriptive statistics such as mean, standard deviation, percentage, and frequency distribution table were used to describe the socio-economics, institutional, and demographic characteristics of the respondents. Furthermore, inferential statistics were used to compare the mean (i.e., t-test,) and show interdependency (i.e., Chi-square test) between saving participation categories.
3.5.1. Econometric model
3.5.1.1. Specification of logistic regression
Logit model estimated to analyze the probability of household saving in the rural area. The logistic distribution function is specified as:
Where: pi the probability of participation in rural household saving is a function of n-explanatory variables (x) and expressed as:
Where: β0: is the intercept
Β1, β2, and βn are coefficients of the equation in the model.
Pi is not only non-linear in ҳ but also the β which can be written as:
This means that we cannot use the OLS producers to estimate the parameters. So, to use this equation fundamentally linear this can be shown as follows. If pi is the probability of participating in household saving l-pi is the probability of non-participating in household saving. These can be written as:
So, taking the ratio of the probability of saving to non–saving can be written as:
Now is simply the odds ratio in favour of participating in saving. It is the ratio of the probability of saving to the probability of non-saving. Finally taking the natural log of equality.
Where:
Li is a log of the odd ratio which is linear not only in x but also in the parameters thus if the stochastic distribution term (ui) is introduced.
The logit mode became:
In this study, the above econometric model would be used to analyze the data.
4. Marginal effect for logit regression
Since the logit model we employed for regression analysis is not linear, the marginal effect of each independent variable on the dependent variable is not constant but it depends on the value of the independent variables. Thus, marginal effects can be a means for summarizing how the change in response is related to change in a covariate. For dummy and categorical variables, the effects of discrete changes are computed. The marginal effects for dummy and categorical variables show how is predicted to change as participation changes from 0 to 1 holding all other explanatory variables constant. For continuous independent variables, the marginal effect measures the instantaneous rate of change. That means in this study change in the probability of household saving participation with a unit change in the continuous independent variable.
5. Results and discussion
This chapter deals with the analysis of the survey data and interpretation of the results of the analysis. Specifically, the determinants of saving of the sample households are analyzed and discussed using inferential statistics tests (χ2 and t-tests) were employed to see the relationship between the dependent and independent variables and an econometric model result of logistic regression.
5.1. Descriptive analysis of dummy and categorical variables
The χ2 results of dummy and categorical variables below in the showed that there has been a significant relationship between the saving status and educational status, credit access, distance to the market centre and distance to the institution.
Table 1. χ2 test results for categorical variables
Sex: of the sampled household heads 135 (86.4%) were male and the remaining 22 (13.6%) were female (). Of the total sampled households, 14 (16.5%) of the non-savers were female-headed households where as 72 (83.5%) of the non-savers were male-headed households. On the other hand, 8 (10%) of the sampled saver households were female-headed households were as
63 (90 %) of the sampled saver households were male-headed households. The result showed that male-headed saver and non-saver households had a greater percentage than female-headed households. Based on chi-square value (χ2 = 0.811; P < 0.253) showed that there was no statistically significant association between saving status and sex of saver and non-saver households. This implies that being male or female-headed household had no statistically
significant effect on the saving status of the households. This possibly indicates that male and female-headed households had an equal chance to access information on saving and formal financial institutions make their targeted male and female-headed households during saving mobilization.
Marital status: of the total sampled household heads 134 (85.8) were married and 23 (14.2) were single (Table: 1). Among the non-savers 71 (83.5%) were married and 15 (16.3%) were single. On the other hand, 63 (88.6%) were married and 8 (11.4%) were single savers. Regarding its association, the χ2 test indicated that there had no statistically significant association between marital status and saving status of saver and non- saver households (χ2 = 1.186; P < 0.195).
Education status: according to the survey result, savers and non-savers who were illiterate were
28 (41.4 %) and 58 (68.2%) respectively and the savers and non-savers who were literate were 47 (58.6%) and 24 (31.8%) respectively. The chi-square value (χ2 = 17.639; p < 0.001) of the sampled households indicated that there was a statistically significant difference in the education status of savers and non-savers (). The percentage difference between savers and non- savers in terms of literacy status may mean that literate household heads had more exposure to the external environment and information which helps them to easily associate them with saving from formal financial institutions. It implies that saver rural households with more education were likely to save their money in formal financial institutions. This finding was similar to the finding of Christin (Citation2016) that indicated as literacy is the ability to make informed judgments and to take effective actions regarding the current and future use and management of money. It includes the ability to understand financial choices, plan for the future, spend wisely, and manage the challenges associated with life events such as a job loss, saving for retirement, or paying for a child’s education. Therefore, literacy is a positive and statistically significant effect on rural households’ savings.
Access to credit services: the result in below showed that out of the total sampled households, 81 (51.6%) had credit access in the year 2019/20, whereas 76 (48.4 %) of the sampled households had not to credit access. Accordingly, 61 (85.7%) of the savers and 20 (23.5%) of the non-savers had credit access while 10 (14.3%) of savers and 66 (76.5%) of non-savers had no credit access. Based on this result, the percentage of non-savers who had no credit access was smaller and also revealed that savers who had credit access were higher. The Chi-square value (χ2 = 61.141; p < 0.001) of the sampled households indicated that there was a statistically significant association between credit access and saving status of savers and non-savers. The implication was that households who had more access to credit had a higher probability to save their money in formal financial institutions. This possibly credit users would have more information and awareness regarding saving in financial institutions than non-savers. Besides, rural households would have used their loan for agricultural products that can increase the income of the household. This finding was similar to the finding of Obayelu (Citation2012) but contrary to the findings of Girma et al. (Citation2014) who indicated that access to credit decreases saving in financial institutions because the available credit was mainly used to purchase agricultural inputs.
Distance to the market: it was measured in hours of walk. Distance to market and other public infrastructure may create opportunities for more income by providing an opportunity for diversifying livelihood strategies through on/off-farm employment, and easy access to input and transport facilities. The Chi-square value (χ2) = 29.918, p < 0.001 in implies that the observed difference in saving participation among the four categories of hours of the walk is statistically significant. As a result, it can be accepted that saving participation varies across different categories of hours of walking. Households nearer to the market centre have a better chance to increase income diversification and in turn to participate in the formal financial saving. Hence, it is expected that proximity to the market centre will have a positive impact on saving participation.
Distance to the financial institution: distant location of saving institutions such as banks, microfinance and saving &credit cooperative institutions have a negative significant effect on the decision of households to save. Households nearer to the financial institution have a better chance to participate in the formal saving. The χ2 = 10.929, p < 0.007 in implies that the observed difference in saving participation among the four categories of hours of the walk is statistically significant. As a result, it can be accepted that saving participation varies across different categories of hours of walking. Hence, it is expected that proximity to the financial institution will have a positive impact on saving participation.
5.2. Descriptive data analysis of continuous variables
The t-test results of continuous variables below in the showed that there has been a significant relationship between the saving status and family size, income, consumption and frequency of extension contact.
Table 2. Independent t-test results of continuous variables
Age: One of the important continuous variables that influence the amount of savings is age. The average age of the savers and non-savers was 45.72 and 45.15 years respectively and the standard deviation of the age of savers and non-savers was 11.67 and 11.24 years accordingly. Thus, the average age of sampled households indicated that the age of savers was not much greater than that of non- savers. The t-value (t = 0.309; p < 0.758) showed that there was no statistically significant difference between the mean age of savers and non-savers concerning their age. Although age was found to be a significant factor in rural households’ savings by many empirical studies, the result in this study showed that it had no significant effect on rural households’ savings. The possible explanation here would be that the mean age of savers and non- savers was relatively the same and these households would have relatively similar life experiences regarding saving.
Family size: The size of the family and composition of households may influence the demand for saving. The result indicated that the average family size of the sampled savers and non- savers was
4.68 and 5.74 respectively and the standard deviation of the family size of savers and non-savers
was 1.76 and 1.86. Thus, the average result revealed that there was a difference in the family size of the savers and non-savers to their family size. The t-value indicated that there was a statistically significant mean difference (t = −3.665; p < 0.001) between the mean family size of savers and non-savers (). The variation of the family size of the two groups had shown a difference and the result indicated that there had a significant effect on rural households’ savings.
Dependency ratio: The number of the non-productive age group individuals whose ages are less than 15 years and greater than 65 years, about the number of productive age groups in the household may affect the rural saving. The result indicated that the average dependency ratio of the sampled savers and non- savers was 0.44 and 0.41, respectively and the standard deviation of the dependency ratio of savers and non-savers was 0.16 and 0.15. Thus, the average result revealed that there was no large difference between the dependency ratio of the savers and non-savers to their dependency ratio. The t-value indicated that there was no statistically significant mean difference (t value = 1.07; p = 0.286) between the mean dependency ratio of savers and non-savers (). The variation of dependency ratio of the two groups had not shown a larger difference and the result indicated that there had no significant effect on rural households’ savings.
Annual income: Income is an important factor in the saving status of rural households. It is a positive factor that analyses the saving status of households. The mean annual income of the savers and non-savers were 1502.52 and 1199.45 USD and the standard deviation of the mean annual income of savers and non-savers was 924.45 and 615.41 USD. As the mean income indicated that there was a greater annual income difference between savers and non-savers. The t-value (t = 2.453; p < 0.015) also showed that there was a statistically significant mean difference between the annual income of savers and non-savers to their income levels. As indicated in the relative income hypothesis, higher income leads to a higher probability of households saving. This result is consistent with a study by (Aron et al., Citation2013) that showed income is a significant factor in the saving status of households and the result revealed that when the income level of households increases, the saving rate will also increase by some present. Rehman et al. (Citation2010) also showed that household income would increase households saving ability.
Annual consumption: Economic theory postulates that households’ saving is the difference between households’ income and consumption. The mean annual consumption of the savers and non-savers was 994.21 and 858.94 USD, respectively and the standard deviation of the mean annual consumption of savers and non-savers was 476.06 and 396.77 USD, respectively. As the mean consumption indicated that there was a greater annual consumption difference between savers and non-savers. The t-value (t = 1.942; p < 0.054) also showed that there was a statistically significant mean difference between the annual consumption of savers and non-savers to their consumption levels.
Livestock size: In the study area, for rural communities’ livestock is important for a household. It is the main measurement of wealth and status in the community. Accordingly, the average Livestock size in TLU of the sampled savers and non-savers was 5.25 and 4.56 respectively and the standard deviation of the livestock size of savers and non-savers in TLU was 2.73 and 2.59 Thus, the average result revealed that there was a difference in the livestock size of the savers and non-savers to their livestock size. The t-value indicated that there was a statistically significant mean difference (t = 1.608; p < 0.11) between the mean Livestock size of savers and non-savers (). The variation in Livestock size of the two groups had shown a difference and the result indicated that there had no significant effect on rural households’ savings.
Farmland size: Rural farmland is one of the livelihood assets that could determine livelihood activities /diversification and income of the rural households. Based on this the result showed that the average farm land size of savers and non-savers was 1.37 and 1.36 hectares, respectively and the standard deviation of the farm land size of savers and non-savers was 0.49 and 0.65 hectares, respectively. The results of the mean value indicated that the average farmland size of savers was greater than non-savers. The t-value indicated that there was no statistically significant mean difference (t = 0.043; p < 0.965) between the mean farmland size of savers and non-savers (). The variation of farmland size of the two groups had not shown a larger difference and the result indicated that there had no significant effect on rural households’ savings.
Frequency of the extension: This refers to the number of contacts with extension agents that the rural households made in the year. Household heads that have frequent contact with extension agents are expected to have more information that would influence farm household’s demand for credit and saving services from formal sources. According to the survey result, the average frequency of extension contact of the sampled savers and non-savers was 2.49 and 0.86 contacts respectively and the standard deviation of the frequency of extension contact of savers and non-savers was 0.89 and 0.94 number of contacts. Thus, the average result revealed that there was a large difference between the frequency of extension contact of the savers and non- savers. The t-value indicated that there was a statistically significant mean difference (t = 11.114; p < 0.001) between the mean frequency of extension contact of savers and non-savers. In Uganda, researchers found that the likelihood of owning savings account increases by roughly 33 times when a household becomes well informed about a particular bank and its services (Kiiza & Pederson, Citation2001). Therefore, it was hypothesized that this variable positively influences farmers’ access to use formal credit and saving services.
5.3. Determinants of rural household saving participation
The logistic regression was used to further analyze the factors influencing households’ saving participation, and the findings are shown in . The model’s output shows that 94.50% of the sample’s total households, 91.50% of participants’ households, and 96.50% of non-participants’ households had savings that were appropriately predicted by the logistic regression model. Because of this, the overall percentage of correct values is 94.50%, indicating that the model is likely trustworthy for generating predictions (i.e., Categorizing individual households in the saver and non-saver). Between 0.67% and 0.89% of the variation in the dependent variable is predicted to be explained by the collection of explanatory variables included in the model, according to the Cox and Snell R2 index and a Nagelkerke R2 index.
Table 3. Logistic regression result for determinants of rural households saving participation
This result from all these indicators clearly shows that the model fits well with the data. However, the close to one Nagelkerke R2 value and high p-value (p < 0.99) of the Hosmer and Lemeshow Goodness of Fit test indicated the model’s good fit. A better fit of the data to the calculated model was shown by the Hosmer-Lemeshow statistic since the significance value was higher than 0.05. Additionally, the model’s log-likelihood ratio value was extremely significant (p < 0.001), demonstrating that the chosen variables significantly affected the model’s capacity for prediction. The Hosmer-Lemeshow statistics showed a strong match of the data to the predicted model, in other words, the significance value was greater than 0.05. Out of the fourteen variables; six variables of which frequency of extension contact, access to credit, educational status, family size, distance to market and farmland size were found to be a significant factor for households’ saving participation in formal saving (Bank, Microfinance and Saving & credit cooperatives).
Accordingly, access to credit, educational status, livestock ownership, distance to market and farm land size were found to be a significant factors for households’ saving participation in the formal saving. While the remaining sex, age, marital status, livestock ownership, income, consumption, dependency ratio, and distance to the financial institution were not significant in explaining the variations in the dependent variable. Based on this result the interpretations of the significant explanatory variables are given in below.
Number of observations = 157; log likelihood = −41.704***; Cox & Snell R2 = 0.67; Nagelkerke R2 = 0.89; Hosmer and Lemeshow of fit-Test = 0.81 (p < 0.99)
Over all correct prediction = 94.50%; sensitivity = 91.50%; specificity = 96.50%
Source: authors’ calculation, 2021; ***P < 0.01, **p < 0.05, *p < 0.1 and ns p > 0.1.
The study discussion of the factors influencing rural households’ participation in saving. Households and the factors that influence their decision to participate in savings efforts are briefly discussed.
Access to credit: One of the model variables in this study is households’ access to credit. As it was hypothesized the variable is positively related and the coefficient is statistically at a 1% significance level. Holding other variables constant, when access to credit changes from “no access” to “credit access” the probability of saving participation increases to about 87.9%. The result was since rural households with more access to credit would have a higher tendency to participate in formal financial savings. This would have possibly meant that credit user households used their loan for the purchase of improved agricultural inputs and investment and in turn, increases their income. The finding is consistence with the finding of Paulos (Citation2018) that credit can increase an opportunity to invest and participate in different income-generating activities which can enhance income and saving levels at the same time. The focus group discussion and the key informant interview have confirmed that credit user households have practised formal saving as a result of saving is one of the criteria to get credit.
Frequency of extension contact: It was correlated positively with saving participation and was significant at a 1% probability level. The interpretation of positive correlation is that those households ‘who have frequent contact with extension agents are expected to have more information that would influence the household’s demand for saving participation in formal financial institutions. The result for this explanatory variable shows that keeping other variables constant, household saving participation increases at about 57.6% when the frequency of extension increases by 1 time of contact. This finding is consistent with other studies. The study by (Kibet et al., Citation2009) shows households that experience a higher number of extension contacts are more likely to save, holding all other factors constant, by up to 0.8%.
Educational status: It was correlated positively with saving and was significant at a 1% probability level. The interpretation of the positive correlation is that those households ‘who were literate in /her educational status were more participants than the illiterates. The result for this explanatory variable shows that keeping other variables constant, household saving participation increased at about 77.9% when the households were literate. This implies that literate rural households would have a higher tendency to participate in saving more in formal financial institutions.
Farmland size: Farmland size owned by the households has an important influence on rural household saving participation. The model result shows that the variable farmland size of the households had a negative relation and was significant at a 10% probability level. The result for this explanatory variable shows that keeping other variables constant, household saving participation decreases at about 41% when the farmland size of the households increases by one hectare. The possible justification might be since there is a lack of awareness about the importance of saving in the study area, considers saving to meet emergencies and credit lead saving households having more land holdings cannot participate throughout the year. They have less capacity to save in response to more land holdings.
Distance to market: Expectedly, remote distance to the market centre has a negative association with rural households’ saving participation at a significant level of 1% holding all other explanatory variables constant. The model result indicates that as the distance from the market centre decrease by a one-hour walk, the probability of participation in saving increases by about 53.6%. The implication is that the longer the distance between households’ residences and the market centre, the lower will be the probability of participating in the rural household saving.
Family size: The family size of the household was negatively related to the probability of household saving participation and the coefficient is statistically at a 10% significance level. Holding all other variables constant at their mean values, when household family size increase by one individual, the probability of household saving decrease by about 8.4%. This result is because when family size increases with its existing high rate of fertility, less employment opportunity, and weak work habits members of the family become unemployed and coupled with a low rate of payment. Therefore, additional household member shares the limited resources that lead the household to save less. This is consistent with the study by (Kibet et al., Citation2009).
6. Conclusion and recommendation
6.1. Conclusion
This study undertook an appraisal of saving participation for rural development in Libokemekem District, North-west, Ethiopia. The study employed a cross-sectional survey with qualitative and quantitative methods. Both primary and secondary sources of data were used. The two-stage sampling technique was used to select 157 sampled respondent households from three rural kebeles namely; Bura, Bira and Agela Mantogera. Inferential statistics and a logistic regression model were used to identify the saving participation pursued by rural households in the study area.
According to the inferential statistics, results show that there is a significant difference between savers and non-saver in annual income, consumption, family size, extension contact, credit access, educational status, distance to the market centre and distance to the financial institutions of the rural households.
Besides, the logistic regression model shows that saving participation was significantly determined by credit access, educational status, family size, frequency of extension contact, farm land size and distance to the market centre of the rural households.
6.2. Recommendation
Based on the findings of the study the following recommendations are forwarded:
i. Access to credit significantly and positively determined both saving participation. Hence, the study suggested that strengthening the existing credit services will enhance rural saving participation.
ii. As observed from the study, educational status had a positive influence on the households’ saving participation. Hence, the saving institutions should create awareness about their financial services for those illiterate households to enhance their participation and governments should provide free educational materials and scholarships to the students at school, college and university levels. So that households can save more rather than spend on their children’s education.
iii. Farm land sizes owned by the households have a negative influence on rural household saving participation. Households having more land holdings can spend a very large amount of money throughout the year. They have less capacity to save in response to more land holdings. The study suggests that providing continuous training and follow-up of rural households about savings is important. This calls for more efforts by the government and NGOs to increase rural households’ training on the roles of savings.
iv. The study showed that households that have large family sizes would have fewer participants in the rural formal saving. Therefore, the saving institutions should encourage households who have a large number of family sizes to enhance their participation by limiting their family size through family planning and related measures.
v. Distance to the market centre had a negative and significant effect on saving participation.
Therefore, developing market infrastructure such as building market places and improving the road to reduce trekking time, transportation costs and other marketing costs can improve the saving status of rural households. According to the findings of the research, the frequency of extension contact had a positive effect on households’ participation in formal savings. Therefore, development agents should strengthen their support by providing training and technical support for rural households to improve household saving participation in the study area.
6.3. Limitation of the study and areas for further research
This study is restricted to South Gondar in Ethiopia’s Libokemkem District and the factors that influence household savings participation there. The results of this study may apply to other northern regions of the country where these saving participation practices are used. An annual cross-sectional survey was used to gather the data. The data do not account for potential alterations in household demographics and resource endowments that might have taken place over the several years. The analysis assumes that the rural household’s demographics and resource endowments remained constant over the years the household was saved. According to what the household heads who were interviewed could recall from the prior year, which may not be representative years, estimates of the average yearly crop yield and income were made. Future research is recommended to include a temporal component to examine whether the variables that affect rural household saving participation have changed over time.
Ethical approval
The study can be carried out with approval from Bahir Dar ethical committee. The study’s participants gave their verbal consent.
Disclosure statement
No potential conflict of interest was reported by the author(s).
Additional information
Funding
Notes on contributors

Melsew Nibret Mazengiya
Melsew Nibret Mazengiya is a lecturer and researcher at the Department of Rural Development and Agricultural Extension, Mekdela Amba University, Ethiopia. His main research activities are adoption, food security and impact studies.
Girmachew Seraw
Girmachew Seraw is a lecturer and researcher at the Department of Rural Development and Agricultural Extension, Bahir Dar University, Ethiopia. His main research activities are adoption, food security and impact studies.
Birhanu Melesse
Birhanu Melesse is a lecturer and researcher at the Department of Rural Development and Agricultural Extension, Bahir Dar University, Ethiopia. His main research activities are adoption, rural cooperative, community development and impact evaluation studies.
Tesfaye Belete
Tesfaye Belete is a rural cooperative and small enterprise expert in Addis Zemen. His main research activities are adoption, rural cooperative, community development and impact evaluation studies.
References
- Aron, H., Nigus, A., & Getnet, B. (2013). Assessment of saving culture among households in Ethiopia. Journal of Economics and Sustainable Development, 4(15), 199–21.
- Atryeetey, E., & Grockel, F. A. (1991). Mobilizing domestic resources for capital formation in Ghana: The role of informal financial sectors, AERC research paper 3.
- Bealu, T. (2020). Determinants of savings behavior among rural households. Department of Economics, College of Business and Economics, Hawassa University Ethiopia.
- Birhanu, M. (2015). Factors affecting rural households’ savings: The case of Gedeb Hasasa District, West Arsi Zone, Oromia Regional State. In partial fulfillment of the requirements for the degree of Master of Science in Rural Development and Agricultural Extension (pp. 155–178). Haramaya University.
- Boating, I. K. (1994). Basic business knowledge and consumer skills. Anu unpublished master’s thesis, University of Ghana.
- Bogale, Y. (2017). Determinants of savings behavior of farm households in rural Ethiopia. Journal of Economics and Sustainable Development, 8(19), 201–405.
- Burrit, K. (2006). Expanding access to financial services in Malawi, United Nations Capital Development Fund 10017, retrieved from http://www.uncdf.org
- Christin, M. (2016). Guide to the use of digital financial services in agriculture. Senior digital finance advisor.
- Deaton, A. S. (2005). Franco Modigliani and the life cycle theory of consumption. Working Paper. http://ssrn.com/abstract=686475.
- Defina, R. H. (1984). The link between saving and interest rates: A key element in tax policy debate. In Business review index, business review federal reserve bank of Philadelphia. Ten Independence Mall.
- Fentahun, A., Belainew, B., & Melaku, B. (2019). Farm household saving habit in Ethiopia: collage of business economics, economics department. Bahir Dar University, Academic Journal of Economic Studies, 5(3), 112–119.
- Gedela, S., Reynolds, T. Q., Gedela, S., Kochanek, P. M., & Bell, M. J. Determinants of saving behavior in rural and tribal households: An empirical analysis of Visakhapatnam district. (2012). Therapeutic Hypothermia and Temperature Management, 2(3), 144–149. Ljrss. https://doi.org/10.1089/ther.2012.0013
- Girma, T., Belay, K., Bezabih, E., & Jema, H. (2014). saving patterns of rural households in East Hararghe. Journal of Development and Development Economics, 6(4), 177–183.
- Goldstein, G., & Barro, I. (1999). Etude sure le role et impact des services et produitsd’épargne du sector informal et des institutions de micro-finance en Afrique de l’Ouest, PNUD-FENU, Unite Special pour la Microfinance (SUM).
- Haile, M. (2017). Saving habits and its determinants in Amhara National Regional. Department of Statistics, Bahir Dar University.
- Hebbe, S., Loayza, N. K., & Serven, L. (2000). “What drives private saving around the world.”world. World Bank Policy Research Working Paper 2309., s.l.: s.n.
- Kibet, L. K., Mutai, B. K., Ouma, D. E., Ouma, S. A., & Owuor, G. (2009). Determinants of household saving: Case study of smallholder farmers, entrepreneurs and teachers in rural areas of Kenya. Journal of Development and Agricultural Economics, 1(3), 137–143.
- Kiiza, B., & Pederson, G. (2001). Household financial savings mobilization: Empirical evidence from Uganda. Journal of African Economies, 10(4), 390–409. https://doi.org/10.1093/jae/10.4.390
- Nayak. (2013). Determinants and pattern of saving behaviour in rural households of westornOdish. National Institute of India.
- Obayelu, A. (2012). Saving behavior of rural households in Kwara State, Nigeria. African Journal of Basic Applied Science, 4(4), 115–123.
- Paulos, B. (2018). Determinants of household saving, department of economics, Wolaita Sodo University. Open Journal of Economics and CommerceV1, 13.
- Railly. (1992). Investment (3rd ed., pp. 6). the Dryden Press.
- Rehman, H., Faridi, M., & Bashir, F. (2010). Households saving behavior in Pakistan: A case of Multan District. Pakistan Journal of Social Sciences, 30(1), 17.
- Robinson, J. (1994). Squaring the circle? Some thoughts on the idea of sustainable development. Ecological Economics, 48(4), 369–384. https://doi.org/10.1016/j.ecolecon.2003.10.017
- Saliya, A. Y. (2018). Determinants of urban household saving behavior in Ethiopia: A survey study in Mekelle City. Üniversitepark Bülten, 7(2), 82–95. https://doi.org/10.22521/unibulletin.2018.72.1
- Tsega, H., & Yemane, M. (2014). Determinants of household saving in Ethiopia: A case of North Gondar Zone, Amhara Regional State, Ethiopia. International Journal of Development and Economic Sustainability, 2(4), 37–49.
- Warneryd. (1999). The psychology of saving: A study on economic psychology. Edward Elgar.
- Wolday, A., & Tekie, A. (2010). Household saving behavior and saving mobilization in Ethiopia, Ethiopian inclusive finance training and research institute. Addis Ababa.
- Work, Y. (2000). Micro finance development in Ethiopia, in Mulat Demeke (ed). The development of micro pendance in Ethiopia proceeding of the conference on the micro finance development in Ethiopia Bahirdar.
- Yemane, T. (1967). Statistics: An introductory analysis (2nd ed.). Harper and Row.