
 ?Mathematical formulae have been encoded as MathML and are displayed in this HTML version using MathJax in order to improve their display. Uncheck the box to turn MathJax off. This feature requires Javascript. Click on a formula to zoom.
Abstract
China is considered the largest emerging economy and thus investors perceived as an attractive investment. We examine the spillover effect from Chinese stock exchange to stock exchanges of Asia and Latin America, namely, India, Indonesia, Mexico, and Brazil. For empirical purpose, the study employs VARMA-Multivariate Generalized Autoregressive Conditional Heteroskedasticity (MGARCH) model with BEKK, diagonal, Constant Conditional Correlation (CCC), and finally, Dynamic Conditional Correlation (DCC) specifications. DCC model outperforms among others and identifies two diversification opportunities with Mexican (MEXICAN) and Indian stock market (BSE). Finally, the hedge ratio and portfolio weights have been calculated. The hedge ratios between China and Mexico (SSE/MEX), and China and India (SSE/BSE) were 0.01 and 0.06, respectively. This implies that a $1 long position in Chinese market (SSE) could be hedged with a 1 cent short position in Mexico (MEXICAN) and a 6 cent short position in the Indian Market (BSE). The findings of this paper provide an insight into investors and policymakers.
PUBLIC INTEREST STATEMENT
Investors want to mitigate the risk by identifying the suitable diversification opportunities. One of the ways is to check the spillover effect and find either diversification is feasible or not. In this context, this paper examines the spillover effect from Chinese stock exchange to Asian and Latin American stock exchanges. We employ VARMA-Multivariate Generalized Autoregressive Conditional Heteroskedasticity (MGARCH) model with BEKK, diagonal, Constant Conditional Correlation (CCC) and finally, Dynamic Conditional Correlation (DCC) specifications. It is found that DCC model outperforms among others and identifies two diversification opportunities with Mexican (MEXICAN) and Indian stock market (BSE).
1. Introduction
Economic integrations across the various regions of the globe have not just facilitated synergies of business, they have also assisted in integration of financial markets. Pandemic has set an example of extreme integrations of the social and economic life of all the nations and regions. Post-pandemic economic recovery and growth prospects, however, have been different for different regions and countries, leading to a varied risk profile of international financial and capital markets for investors. These differences in capital markets enhance the opportunities available for investors to hedge their risk and improve the performance of their portfolios. However, developed and emerging economies have been investigated in the past to understand the integration of capital markets across these regions and studies have established the diversification opportunities available in this mix of markets (; Zeng et al., Citation2021; Iqbal et ;).
The emerging significance of the climate concerns was the genesis of the Global Green New Deal (GGND) formulated by the United Nations Environmental Program (UNEP) and G20 countries which have promulgated the deal. To understand the paradigms of global risk diversification, it becomes pertinent to identify countries that are emerging, with highest growth prospects, and progress towards sustainability. Sustainable economic growth is achieved only through mobilization and productive utilization of economic resources in the economy. Financial transactions involving institutions and markets play a pivotal role in economic growth (Rubbaniy et al., Citation2020; Tsakalos et al., Citation2015). In existing studies, researchers explored the relationship between financial development and economic growth involving market-based or bank-based financial development. As per a past study on Capital markets and economic growth Bekaert and Harvey (Citation2003), it was concluded that Stock Market development is positively correlated with economic growth.
The contribution of the financial market to economic development has manifested in form of capital formation and productive investment. Efficient financial markets play a fundamental role through pooling savings and mobilizing funds into productive investments (Bekaert & Harvey, Citation2003), promoting domestic capital formation, encouraging savings by offering diversified investments and support increase financial efficiency in turn, thus fostering economic growth.
The purpose of this study is to examine the portfolio diversification opportunities within emerging countries. According to the World Investment Report, 2019 (UNCTAD, Citation2019), Chinese market attracts the maximum inflows among all emerging countries, because China is the largest economy among developing countries having a GDP (PPP) of USD 27,804,953 million. According to the IMF report (IMF, Citation2020), the world GDP is around $90.84 trillion with the US has contributed $ 21.44 trillion. On the other hand, the emerging economies have contributed around 80% to the world GDP out of which China alone has contributed $14.41 trillion. Hence, China is considered to be one of the strongest and most attractive countries among emerging nations to invest. Thus, the study analyzes the spillover effect from the Chinese stock market to the highest growing and emerging Asian and Latin American economies to check diversification opportunities. Existing studies have analyzed the linkages and flow from developed to developing countries and have found spillover effects among emerging countries. However, this study examines the linkages between China and other emerging countries, which makes this distinct from previous studies in this area. To narrow the analysis to specific regions, Asian and Latin American countries are chosen as the two regions for this study.
This study builds on the investor’s interest in capitalizing the market returns of the largest emerging economy (China) with a catalytic mix of risk diversification through smaller emerging countries from Asia and Latin America, namely, India, Indonesia (Member of Association of South East Asian Nations), Mexico and Brazil. These countries are also the signatories of the Global Green New Deal. With the current data from the IMF, the comparable emerging and developing economies in Asia are India, China and ASEAN.Footnote1 Indonesia is a representative of the ASEAN. Among the Latin American nations, Brazil and Mexico are the emerging economies. This study explores the relationship between Asian and Latin American nations among the top emerging economies. Since these economies are connected yet, they provide a good opportunity of diversification for investors in capital markets. Hence, this paper answers the following two research questions:
Q1. Is there presence of spillover from Chinese to Asian and Latin American stock markets in short and long run?
Q2. Is there opportunity for portfolio diversification among these markets based on optimal portfolio weight?
To answer these questions, we consider four emerging markets with the highest growth expectations as diversification opportunities to hedge against the volatility of China; these countries are India, Indonesia, Brazil and Mexico. The rationale behind the selection of these four emerging countries is that these Asian and Latin American nations have the highest GDP and expected Economic growth rate as per recent estimates. This paper considers data extending from a twenty-year period, from year 2000 to 2020 to analyze the spillover effect. For empirical analysis, four different multivariate GARCH models like BEKK, diagonal, Constant Conditional Correlation (CCC) and Dynamic Conditional Correlation (DCC) are employed. It is found that DCC is the best-suited model for conditional correlation comparatively. At the end, hedge ratio and portfolio weights have been computed using DCC-GARCH model. The hedge ratios between China and Mexico (SSE/MEX), and China and India (SSE/BSE) were 0.01 and 0.06, respectively. It signifies that a $1 long position in the Chinese market (SSE) could be hedged with a 1 cent short position in Mexico (MEXICAN) and a 6 cent short position in the Indian market (BSE).
The remainder of the paper is structured as follows: section 2 includes detailed literature review. Section 3 contains the data and empirical models while sections 4 and 5 provide empirical results and conclusion along with policy implication, respectively.
2. Literature review
There are several studies have been done with reference to identifying diversification opportunities among emerging markets and the volatility transmissions from developed markets. Among the latest studies, Habiba et al. (2021), studied asymmetric volatility transmissions among Asian emerging markets. The study has applied multivariate GARCH models. The study found bidirectional volatility in most of the select stock markets. (Zeng et al., Citation2021) interestingly captured the interlinkages among European Union allowance and certified emission reduction market during various phases. (Iqbal et al., Citation2020) had identified structural break and volatility spillover among South Asian Economies found interlinkages among stock markets of Africa and Middle East by applying MGARCH-BEKK model. It has been found asymmetric interlinkages and cointegration among the countries. Nandy and Chattopadhyay (Citation2019) studied the interdependence of stock market and other domestic financial markets. To find the lead and lag relationship, the study applied VAR analysis, Granger causality test, impulse response function and variance decomposition. For capturing volatility spillover DCC-MV-TARCH) (1, 1) model has applied. Sarwar et al. (Citation2019) have captured the evidences of volatility spillover and hedging opportunities among Asian oil importing countries. However, the study is sound methodologically by applying various Multivariate GARCH models like BEKK-GARCH, DCC-GARCH, cDCC-GARCH and GO-GARCH. They also found that cDCC-GARCH is one of the robust model among all. Balli et al. (Citation2015) have captured volatility spillover from developed to emerging markets. It was captured that emerging countries are significantly receiving volatilities from developed markets. Majdoub & Mansour (Citation2014) found interlinkages among US and Islamic emerging countries. However weak transmissions of volatilities were captured by applying multivariate GARCH BEKK, CCC and DCC models. The study found diversification opportunities among them. Lee et al. (Citation2014) captured the linkages among US, Japan and six Asian countries during the long and short run periods by applying asymmetric GARCH models. The study captured the evidence of spillover from the US to Asian countries. Moreover, bidirectional volatility was captured during the Asian financial crisis. Abbas et al. (Citation2013) studied spillover transmissions among Asian countries among friendly and hostile countries. It has found shreds of evidence of volatility transmissions among hostile countries.
Several studies on diversification in the context of China have been captured in the current literature. The very recent study done by (Shahzad et al., Citation2021) studied interlinkages of sectoral indices during COVID. Similarly, Yin 2020 has also captured the asymmetric spillover among various sectors of China stock market. (Zhang et al., Citation2020), examined the spatial correlation by applying GARCH-BEKK model among volatility spillovers and G20 stock market influencing factors. It has been found that developed markets are more influential and emerging markets are more prone to receive volatility shocks. Further, the quadratic assignment procedure (QAP) method was applied to identify the factors that influence the volatility spillover. Another interesting study done by (Do et al., Citation2020), studied the Chinese shares listed in A, B, and H categories with 12 major emerging and developed markets from 2002 to 2017. The study has applied multivariate DCC-GARCH models. It has been found that Chinese equities are more related to neighboring countries. Moreover, it has found heterogeneity in the behavior of integration of various categories of shared. Although the study is related to the Chinese stock market, this study leaves scope in terms of selecting emerging G20 countries and application of more robust models. (Huang et al., Citation2000) have studied the linkages among China and Southeast Asian countries that are Vietnam, Thailand, Singapore, and Malaysia. The analysis has captured the volatility transmissions with a multivariate GARCH-BEKK model during pre and post-financial crises. Similarly, Uludag & Khurshid, (Citation2019) studied volatility spillover from the Chinese stock market to E7 and G7 stock markets. It has been found the highest volatility was captured among China and India in the group of E7 markets and among China and Japan in G7 group. Furthermore, it has been identified that investors should hold more stocks from G7 than E7 stocks. (Bissoondoyal-Bheenick et al., Citation2018) studied the volatility transmissions among three closely related countries the United States, Australia and China. In order to identify volatility transmissions meticulously, the study has taken various sectors. They had found significant bilateral volatilities among these countries and across most of the sectors within the sample. Majdoub et al (Citation2021) captured the contagion effect among China and emerging Asian Islamic countries.
The previous studies were related to a different set of countries. However, the current study encompasses among China and top emerging countries from the lens of a global sustainable vision and the growth of emerging countries. Moreover the study is sound in methodology, has applied almost all models of multivariate GARCH and able to analyze the best model. Finally able to identify diversification and portfolio hedge ratios. This makes the study dynamic and robust.
3. Data and empirical model
3.1. Data description
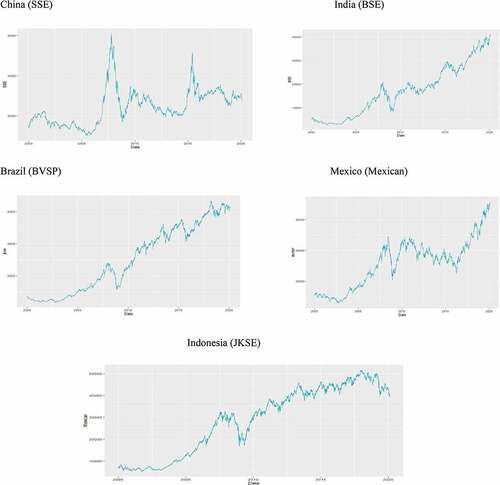
The data used in the study was sourced from Investing.com. It consists of the closing prices of the stock exchanges of five emerging countries, from the 1 Jan 2001 to 1 Jan 2020. The five G20 emerging markets and their respective stock exchanges considered in the study are China (SSE), India (BSE), Indonesia (JKSE), Brazil (BVSP) and Mexico (MEXICAN). The plot of these different markets has been visualized in Figure . It has been inferred, prima facie, from the visualization of the market plots, that the Chinese market (JKSE) has a unique and peculiar trend in comparison with other emerging markets. Mexico also reflects an unusual trend among them. The remaining three markets, i.e. India (BSE), Indonesia (JKSE) and Brazil (BVSP) exhibit similar trends. Almost all countries had shown a downturn around 2008, due to the global financial crisis. The Chinese market had also shown major volatility during that time specifically with high spikes towards downside and upside.
Figure 1. Time series plots of China, India, Brazil, Mexico and Indonesia.
The returns have been calculated for each data series by applying the formulae, ). The descriptive statistics of the data is given in Table . The mean return of the emerging countries varies from 0.046 to 0.0159. The Indonesian and Indian market have the highest yield during the period, that is, 0.046 and 0.043, respectively. The median returns in all markets have high values compared to their mean returns; therefore, the series is skewed negatively. For each series, the deviations are higher than mean values. It can be inferred that the series is volatile with low and negative skewness, and a high value of kurtosis. The shape of the returns data of each country is leptokurtic, departing from normality. The inference of the shape is that either too high or too low returns are observed over the time. The statistics of the Jarque-Bera, test provides statistical evidences that no series are statistically normal.
Table 1. Summary statistics for daily returns
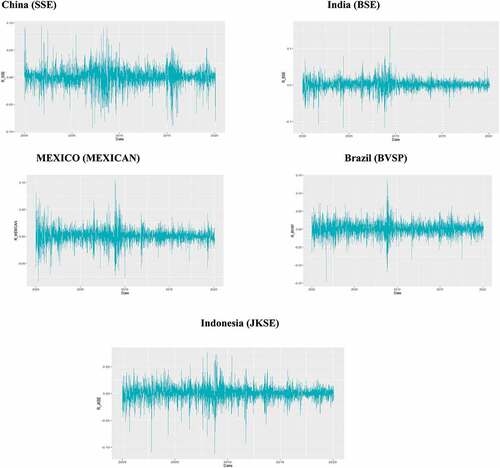
Furthermore, in applying GARCH (1, 1) model, the data must possess certain characteristics, that is, the data must be stationary and exhibit the presence of ARCH effect. The Augmented Dickey Fuller (ADF) test revealed that all the time series returns data was stationary and unit root was not present. The presence of ARCH effect was tested through the ARCH test and it was concluded that all the series had the presence of ARCH effect, further supplemented by volatility clustering. The volatility clustering is evident in Figure , which gives the plot of the emerging markets returns. It was observed that large changes tend to be followed by large changes, both negative and positive and similarly small changes tend to be followed by small changes (Mandelbrot, Citation1963).
Figure 2. Plots of daily returns.
The unconditional correlation has been encapsulated in Table . The conclusive inferences that have been drawn from the results are further strengthened from the VARMA (1, 1)-MGARCH (1, 1) models. It has been concluded that India had the highest unconditional correlation with China, with a value of 0.05, whereas Mexico exhibited the lowest correlation with China, with a value of 0.01. This could provide opportunity for investments diversification in China. Among the remaining emerging countries Brazil and Mexico have shown maximum unconditional correlation with a value of 0.18. Thus, Brazil would also prove to provide a good opportunity for diversification.
Table 2. Correlation between daily returns
3.2. The empirical model
As per modern financial literature, multivariate GARCH (MGARCH) models are the best-suited models to capture spillover effects in equity markets (Booth et al., Citation1997; Cha & Jithendranathan, Citation2009; Hou & Li, Citation2020; Karolyi, Citation1995; Karolyi & Stulz, Citation1996; Koutmos & Booth, Citation1995; Li, Citation2020; Lin et al., Citation1994; McIver and Kang, (Citation2020); Vo & Tran, Citation2020). In this study, the volatility spillover from Chinese stock market to other emerging stock exchanges has been examined through four MGARCH models that is, BEKK, diagonal, CCC and DCC models. In this analysis, the BEKK model has been considered as the benchmark model while other models like diagonal, CCC and DCC have been estimated by following two steps. First, variances have been estimated by applying univariate GARCH, and then based on the residual variances identified in the first step; the correlations have been estimated in the second step.
The specifications of the econometric models considered in this paper provide auto correlation and cross autocorrelation. A vector autoregression (VAR) model has been applied with one lag. The literature of applied research has guided that, various criteria choose different lags. For example, SIC chooses 0 lags, AIC chooses 3 lags and HQ chooses 1 lag for the VAR models. The multivariate GARCH models are based on time varying covariance and variances.
According to Ling and McAleer (Citation2003), the diagonal, CCC and DCC models use conditional variance based on VARMA-GARCH (1, 1). The specifications of the MGARCH models are explained below:
In the above-mentioned Eq. (1), denotes the return of series
and
is the idiosyncratic error term containing conditional variance
, while
signifies the availability of market information at time
. The association between conditional variance (
and idiosyncratic error (
) is depicted in Eq. (2). Eq. (3) represents a GARCH (1,1) model along with the VARMA process (Ling & McAleer, Citation2003). The Ling and McAleer (Citation2003) modelling for conditional variance is simplified and easy, permitting volatility spillovers. This model allows large amounts of shocks to one variable to impact the variances of the other variables.
Eq. (4) discusses about the DCC specification, which has been developed by Engle (Citation2002). It is estimated by applying two different steps. Firstly, the GARCH parameters are calculated and correlation is calculated in the second step. In this equation, is a
conditional covariance matrix.
is a diagonal matrix, which is the diagonal of time varying standard deviations, and
is the conditional correlation matrix.
where is a symmetric positive definite matrix.
It signifies a unconditional correlation matrix based on the idiosyncratic residual
. The
and
parameters are non-negative, which should be less than the sum of unity. Below is the correlation estimator:
In the case of CCC specification, . The diagonal specification is a restrictive model, as it considers DCC to be zero between variables. In order to compute the unconditional covariance matrix, standardized residuals derived from the MGARCH diagonal is used. The MGARCH models are estimated with the help of the quasi-maximum likelihood estimation, applying the Broyden–Fletcher–Goldfarb–Shanno (BFGS) algorithm. A robust estimate of the covariance matrix assists to calculate
-statistics.
4. Empirical results and discussion
The empirical section of the paper firstly cater to the results of VARMA (1, 1)-MGARCH (1, 1) models with BEKK, diagonal, CCC and DCC specifications. Among them, BEKK specification has been considered as a benchmark model and contrasted from the other three restricted conditional correlation models. Based on the suitability, the selected MGARCH model has been used to infer the diversification opportunities. Finally, a hedging and portfolio weight has been strategized.
4.1. Evidence of VARMA (1,1)- MGARCH (1,1)
Firstly, analysis of the results of VAR have been encapsulated at the initial stage (Panel A: Mean equation) of Table . The analysis of China (SSE) among the other four countries revealed that China and Indonesia had a positive and significant association at the 0.05 significance level, according to the consensus of all the models. It meant that one period lag of Indonesia (JKSE) affected the current period of China (SSE). According to the results of BEKK and DCC models, China (SSE) and Brazil (BVSP) also had significant lead and lag relation. However, the results were not validated across all the models. In all combinations of China (SSE) with other emerging countries, there has been a positive and significant relation. Interestingly, in two combinations, China (SSE) & Mexico (MEXICAN) and China (SSE) & India (BSE), the significance value of the coefficients was found to be the lowest. The results were in consensus with BEKK and DCC models. Furthermore, a significant lead and lag structure has been inferred among India (BSE) and other emerging countries, that is, one period lagged returns of emerging countries significantly affected the current period returns of India (BSE). These inferences were not the same across the models but were in consensus with BEKK and DCC models. Another relation that emerged after the application of DCC model was that the lagged returns of all the emerging countries, except Mexico (MEXICAN), affected the current returns of Indonesia (JKSE) significantly. Furthermore, the lagged returns of Mexico (MEXICAN) also had significant negative relation with the current return of Indonesia (JKSE). The same model also inferred that Brazil (BVSP) had a positive and significant relation with China (SSE), India (BSE) and Indonesia (JKSE), but had a negative and significant relation with Mexico (MEXICAN). Finally, for Mexico (MEXICAN), all emerging countries had positive significant lag relation. However, the results were not in consensus across the models.
Table 3. VARMA (1,1)- MGARCH(1,1) parameter estimates
Analyzing the results of own conditional GARCH effects, , which captures the long-term persistence of conditional volatility, has provided evidences of the persistence of own long-term conditional volatility in all MGARCH models except CCC model. The estimated coefficients of own conditional volatility for all markets were found to be significant at the 0.05 significance level. The coefficient of
has been used to refer to the GARCH term of the equation of China (SSE); likewise,
refers to the GARCH term of the equation of India.
refers to the GARCH term of Indonesia, and
and
refer to the GARCH terms of Brazil and Mexico, respectively. There are evidences of a high value of long-term persistence of own volatility in Mexico (MEXICAN), followed by Indonesia (JKSE), Brazil (BVSP), China (SSE) and lastly, India (BSE).
The short-term persistence of own conditional volatility has been captured by the ARCH term (, which is presented in Table . There are evidences that all markets, except Mexico (MEXICAN), have shown significant short-term volatility, however, the results vary across multivariate GARCH models. As of now, one inference could be drawn about Mexico (MEXICAN), that there is a long-term persistence of volatility and the results are in consensus with BEKK and DCC models. However, in all markets the coefficients of
are greater than
, indicating that the persistence of own long-term volatility, captured by the GARCH effect, is larger than the presence of own short-term volatility, captured by the ARCH effect.
In the DCC-GARCH (1, 1) model, the evidences have been captured for significant volatility transmissions in the short-term among countries, that is,. Interesting results have been captured for the short-term transmission of volatility among China (SSE) and other four emerging countries, which have also been found to be statistically significant. Out of these,
, that is, the spillover from China (SSE) to India (BSE), and
, that is, the spillover from China (SSE) to Mexico (MEXICAN) have shown short-term negative significant spillover at the 0.05 significance level, thus providing short-term diversification opportunities. However, the results across the models are not in consensus with DCC model. For the long-term volatility transmission, DCC model provides several evidences of long-term transmission of volatility
. According to the model, China (SSE) is positively and significantly co-integrated with the rest of the emerging markets, that is, the transfer of volatility from China (SSE) to other emerging countries except Brazil (BVSP)
have shown the transmission of long-term volatility.
Looking across the overall suite of models, the spillover provides a mixed picture. Among the emerging countries the coefficients of are positive and significant in most of the instances, except from Brazil to China, that is,
, where there is a negative and significant volatility transmission. Such inferences provide the scope of hedging opportunities in short-term while investing in China. The rest of the emerging countries have shown significantly negative transmission amongst themselves, including Indonesia and China
; Indonesia and Brazil
and (
), and finally, among Mexico and Brazil (
. In summary, the strongest and significant evidences have been found in DCC (1, 1) model. The rest of the models, for instance, BEKK, diagonal and CCC models have shown lower instances of spillover. The maximum instances of significant volatility transmission have been analyzed in the DCC model, which is considered the most significant model to predict the volatility transmission among emerging countries. For the DCC model if,
is significant at 0.05 significance level, it infers the presence of short-term volatility and if
is not significant, it infers no evidence of long-term volatility among the five emerging countries.
The elements of Panel B under Table presents variance equation for the AR(1)-GARCH (1,1) model in which to
;
to
and
to
are constant. Short-term and long-term volatility of various countries are considered in this study. As per DCC model, there is a bidirectional short-term persistence (denoted by
) among the Chinese, Indian, Brazilian, Mexican and Indonesian stock markets. It analyzes how, in the short-term, the information about any news/events is captured in these stock markets. It was revealed that the Indian and Mexican stock markets have negative and significant short-term presence of volatility. This negative short-term volatility spillover provides opportunities for diversification. Furthermore, the long-term persistence among these markets has been examined (denoted by
). It has been noticed that there is transmission of information among these markets except in Chinese and Brazilian stock markets. Also, the sum of
and
is less than 1 which depicts that there is decaying in the volatility. Regarding
and
in DCC model,
is positive and statistically significant while
is negative and insignificant. It says that, overall, there is transmission of information in the short-term, while in the long-term there is no transmission of information. Lastly, it could be fairly inferred that there is a diversification opportunity that can be explored in the short-term by investing in the Mexican and Indian stock markets. The inference of diversification opportunities drawn from the DCC model is supported by the report of the Peterson Institute for International Economics (Mauro & Zilinsky, Citation2015), the report has been sourced from the IMF, direction of trade statistics. The data sheet has shown that exports from Mexico and India to China are the lowest among G20 countries. Another, report by Kenneth (Citation2015) supported the same hypothesis. The report had highlighted the top ten countries that had export dependencies on China. Indonesia and Brazil were among the top ten countries. Hence supported by the theoretical thrust from existing literature, diversification opportunities could be explored for hedging and portfolio diversification within the emerging countries.
4.2. Portfolio hedging
The study finally analyzed the diversification opportunities and respective hedge ratios of emerging countries in general and China in particular. Conditional co-variances and variances have been used to calculate hedge ratios (Kroner & Sultan, Citation1993). The hedge ratio inferred as the long position in one asset could be hedged with a short position in another asset to protect from the probable risk. The hedge ratio can be defined between two assets.
where, is the hedge ratio between asset 1, that is,
and asset 2, that is,
;
is the time varying conditional co-variances between
and
and
is the time varying conditional variances. As the DCC model has been considered the most robust among all models considered in the study, the hedge ratios were computed using the DCC model. The statistical summaries of time varying hedge ratios are encapsulated in Table . Specifically, for China (SSE), the hedge ratio with India (BSE) is 0.06; with Indonesia (JKSE) is 0.02; with Brazil (BVSP) is 0.01 and with Mexico (MEXICAN) is 0.04. Thus, two diversification opportunities emerge while investing in China (SSE), that is, with Mexico and India, as per the inferences drawn previously from VAR and DCC-MGARCH models. There is short-term negative persistence of volatility and less significant lead and lagged structure among China (SSE) and Mexico (MEXICAN), and China (SSE) and India (BSE) which provides the opportunity for diversification. The hedge ratio between China and Mexico is 0.01, which means a $1 long position in China (SSE) could be hedged with a 1-cent short position in Mexico (MEXICAN).The hedge ratio between China and India is 0.06. It means that a $1 long position in China (SSE) could be hedged with a 6-cent short position in India (BSE).
Table 4. Hedge ratio (long/short) summary statistics
4.3. Portfolio weights
Portfolio weights have been calculated taking into consideration the time varying conditional volatility (Kroner & Ng, Citation1998)
The portfolio was considered to have two asset classes, that is, and
, where
is the weight assigned to asset 1, that is,
, and (1-
was the weight of asset 2, that is,
. It means
is the proportion of $1 investment done in portfolio of two asset classes. The time varying portfolio weights have been calculated using the time varying conditional volatility and co-variances from the DCC model. The summary statistics of portfolio weights have been encapsulated in Table . The discussion of this section is limited to the diversification opportunity of Chinese market (SSE) and markets of emerging countries. The average portfolio weights between China and Mexico (SSE/MEX) is 0.37, which means every investment in portfolio of asset classes in China (SSE) and Mexico (MEXICAN) would have 37% invested in China (SSE) and 63% in Mexico (MEXICAN). Another diversification opportunity has been identified between China (SSE) and India (BSE). The average weight of the portfolio (SSE/BSE) was 0.43 which meant that out of $1 investment in portfolio, 43% would be invested in SSE and rest 57% in BSE.
Table 5. Portfolio weights summary statistics
5. Conclusion and policy implication
Post financial crisis the world economies in general and emerging economies in particular were facing multiple crises- hike in fuel & commodity prices, and unemployment. To overcome these challenges the world economic agenda that is A Global Green New Deal (GGND) has been taken by UNEP and the G20 countries. Henceforth, with this vision, the policymakers in emerging countries promote projects that ensure sustainability and green in nature. Thus, from the last decade, the FIIs investments in these economies have been increased significantly. Moreover post pandemic it has been observed that economic recovery and growth prospects however have been different for different regions and countries, leading to a varied risk profiling of international financial and capital markets for investors. This differential in capital markets enhances the opportunities available for investors to hedge their risk and improve the performance of their portfolios. The purpose of this study is to examine the portfolio opportunities within emerging countries and China among them being the most promising one. Thus, the study captures the diversification opportunities that exist among China and other emerging countries and identifies the best suitable model of capturing volatility transmission among them.
In order to examine volatility transmission and identify diversification opportunities, the four different G20 emerging countries, for instance, India (BSE), Indonesia (JKSE), Brazil (BVSP) and Mexico (MEXICAN) have been considered. The study used the VARMA (1, 1)—multivariate GARCH (1, 1) models to analyze the spillover between the Chinese Stock Exchange and other emerging countries. Four multivariate GARCH models with BEKK, diagonal, CCC and DCC specifications have been applied, and their results were compared. It has been found that DCC is the most suited among the four models, where is positive and statistically significant while
is negative and insignificant. It signifies that, overall, there is the transmission of information in the short term, while in the long-term, there is no transmission of information. As per the inferences drawn previously from VAR and DCC-MGARCH model, it has been concluded that investing in China (SSE) offers two diversification opportunities: one with Mexico and the other with India. The inferences of diversification opportunities drawn from the DCC model are supported by the report of Peterson Institute for International Economics (Mauro & Zilinsky, Citation2015) and Forbes (Kenneth, Citation2015). Hence, with theoretical thrust based on current literature, diversification opportunities could be explored for hedging. The hedge ratio between China and Mexico (SSE/MEXICAN) was 0.01, which meant a $1 long position in the Chinese market (SSE) could be hedged with a 1-cent short position in Mexico (MEXICAN). The hedge ratio between China and India (SSE/BSE) was 0.06 which meant that a $1 long position in the Chinese market (SSE) could be hedged with a 6-cent short position in the Indian Market (BSE). Finally, portfolio weights have been calculated. The average portfolio weight between China and Mexico (SSE/MEXICAN) is 0.37, which means a $1 investment in portfolio of China (SSE) and Mexico (MEXICAN), would need 37% to be invested in China (SSE) and the rest 63% in Mexico (MEXICAN). Another diversification opportunity has also been identified between China (SSE) and India (BSE). For them, the average weight of the portfolio (SSE/BSE) is 0.43, which means that out of every $1 investment in the portfolio, 43% would be invested in China (SSE), and the rest 57% in India (BSE).
The study is important for foreign institutional investors attracted by the growth emerging countries and thus looking for diversification opportunities. It has been found that Mexico and India are providing good diversification opportunities with China. These diversification opportunities provide important implications to policymakers of Mexico and India especially for authorities who are controlling the capital markets and eyeing stimulus for economic growth through capital formation. There is greater probability of investment growth because of greater hedging avenues provided by diversification and this assists in infusion of capital, thereby catalyzing growth. Past studies as mentioned earlier have shown that capital markets channelize investments and thus spur economic growth. Besides this, with advent of technology the world is becoming more integrated and these integrated capital markets are more and more significant for all nations’ economic and sustained growth. Technological advancements especially with cryptocurrency emerging very fast, also highlights the increasing role of security laws and enforcement agencies. Institutional investors play and major role in investment volumes hence any hedging opportunity clubbed with high growth prospects, as the ones identified in this paper, become especially attractive for them thereby increasing the investments from them and enhancing the role of regulation of these investors by regulatory authorities.
The study is limited to only four of the most emerging countries and thus, it could be extended by taking more countries. To get a more rigorous understanding the inclusion of financial crisis and pandemic could be considered. Further, the future study could address volatility transmission among China and the countries that are taking best practices/initiatives to promote the global sustainable vision.
correction
This article has been republished with minor changes. These changes do not impact the academic content of the article.
Disclosure statement
No potential conflict of interest was reported by the author(s).
Additional information
Funding
Notes on contributors

Miklesh Prasad Yadav
Miklesh Prasad Yadav is an Assistant Professor at Indian Institute of Foreign Trade, Kakinada, India. He has work experience of 12 years. He has contributed acclaimed publications in ABDC and Scopus indexed Journal.
Sudhi Sharma
Sudhi Sharma: She has more than 13 years of experience in teaching Finance and Econometrics. She has done PhD from MLSU, Udaipur, and a Certified Equity Research Analyst. She possesses proficiency in Advance Excel, EVIEWS, SPSS & STATA.
Vaibhav Aggarwal
Vaibhav Aggarwal is an Assistant Professor in the Accounting & Finance area at Jindal Global Business School. He has a rich experience of more than 12 years with a blend of both industry and academia.
Indira Bhardwaj
Indira Bhardwaj is an academician with more than 20 years of teaching experience across institutions in India. She has done her FDP from IIM Indore. Her PhD is from AMU in Understanding Corporate Value Using Intellectual Capital Assets.
Notes
References
- Abbas, Q., Khan, S., & Shah, S. Z. (2013). Volatility transmission in regional Asian stock markets. Emerging Markets Review, 16, 66–21. https://doi.org/10.1016/j.ememar.2013.04.004
- Balli, F., Hajhoj, H. R., Basher, S. A., & Ghassan, H. B. (2015). An analysis of returns and volatility spillovers and their determinants in emerging Asian and Middle Eastern countries. International Review of Economics & Finance, 39, 311–325. https://doi.org/10.1016/j.iref.2015.04.013
- Bekaert, G., & Harvey, C. R. (2003). Emerging markets finance. Journal of Empirical Finance, 10(1–2), 3–55. https://doi.org/10.1016/S0927-5398(02)00054-3
- Bissoondoyal-Bheenick, E., Brooks, R., Chi, W., & Do, H. X. (2018). Volatility spillover between the US, Chinese and Australian stock markets. Australian Journal of Management, 43(2), 263–285. https://doi.org/10.1177/0312896217717305
- Booth, G. G., Martikainen, T., & Tse, Y. (1997). Price and volatility spillovers in Scandinavian stock markets. Journal of Banking & Finance, 21(6), 811–823. https://doi.org/10.1016/S0378-4266(97)00006-X
- Cha, H.-J., & Jithendranathan, T. (2009). Time-varying correlations and optimal allocation in emerging market equities for the US investors. International Journal of Finance & Economics, 14(2), 172–187. https://doi.org/10.1002/ijfe.343
- Conover, C. M., Jensen, G. R., & Johnson, R. R. (2002). Emerging markets: When are they worth it? Financial Analysts Journal, 58(2), 86–95. https://doi.org/10.2469/faj.v58.n2.2525
- Do, A., Powell, R., Yong, J., & Singh, A. (2020). Time-varying asymmetric volatility spillover between global markets and China’s A, B and H-shares using EGARCH and DCC-EGARCH models. The North American Journal of Economics and Finance, 54, 101096. https://doi.org/10.1016/j.najef.2019.101096
- Engle, R. (2002). Dynamic conditional correlation: A simple class of multivariate generalized autoregressive conditional heteroskedasticity models. Journal of Business & Economic Statistics, 20(3), 339–350. https://doi.org/10.1198/073500102288618487
- Hou, Y., & Li, S. (2020). Volatility and skewness spillover between stock index and stock index futures markets during a crash period: New evidence from China. International Review of Economics & Finance, 66, 166–188. https://doi.org/10.1016/j.iref.2019.11.003
- Huang, B.-N., Yang, C.-W., & Hu, J. W.-S. (2000). Causality and cointegration of stock markets among the United States, Japan and the South China Growth Triangle. International Review of Financial Analysis, 9(3), 281–297. https://doi.org/10.1016/S1057-5219(00)00031-4
- IMF. (2020). World economic outlook: The great lockdown. International Monetary Fund. Investing.com www.investing.com
- Iqbal, H. R., Saeed, S. K., & Ali Shah, S. Z. (2020). Structural breaks and volatility spillover in South Asian economies. SEISENSE Journal of Management, 3(1), 1. https://doi.org/10.33215/sjom.v3i1.260
- Karolyi, G. A. (1995). A multivariate GARCH model of international transmissions of stock returns and volatility: The case of the United States and Canada. Journal of Business & Economic Statistics, 13(1), 11–25. https://doi.org/10.2307/1392517
- Karolyi, G. A., & Stulz, R. M. (1996). Why do markets move together? An investigation of U.S.-Japan stock return comovements. Journal of Finance, 51(3), 951–986. https://doi.org/10.1111/j.1540-6261.1996.tb02713.x
- Kenneth, R. (2015), ‘Top 10 China dependent countries’, Forbes, November 26, 2015. https://www.forbes.com/sites/kenrapoza/2015/11/26/top-10-china-dependent-countries/#25c06dad4932
- Khalfaoui, R., Sarwar, S., & Tiwari, A. K. (2019). Analysing volatility spillover between the oil market and the stock market in oil-importing and oil-exporting countries: Implications on portfolio management. Resources Policy, 62, 22–32. https://doi.org/10.1016/j.resourpol.2019.03.004
- Koutmos, G., & Booth, G. G. (1995). Asymmetric volatility transmission in international stock markets. Journal of International Money and Finance, 14(6), 747–762. https://doi.org/10.1016/0261-5606(95)00031-3
- Kroner, K. F., & Ng, V. K. (1998). Modeling asymmetric comovements of asset returns. Review of Financial Studies, 11(4), 817–844. https://doi.org/10.1093/rfs/11.4.817
- Kroner, K. F., & Sultan, J. (1993). Time-varying distributions and dynamic hedging with foreign currency futures. Journal of Financial and Quantitative Analysis, 28(4), 535–551. https://doi.org/10.2307/2331164
- Lee, Y. H., Wu, C. Y., & Huang, Y. L. (2014). Dynamic correlations and volatility spillovers between crude oil and stock index returns: The implications for optimal portfolio construction. International Journal of Energy Economics and Policy, 4(3), 327–336.
- Li, H. (2020). Volatility spillovers across European stock markets under the uncertainty of Brexit. Economic Modelling, 84, 1–12. https://doi.org/10.1016/j.econmod.2019.03.001
- Lin, W.-L., Engle, R. F., & Ito, T. (1994). Do bulls and bears move across borders? International transmission of stock returns and volatility. Review of Financial Studies, 7(3), 507–538. https://doi.org/10.1093/rfs/7.3.507
- Ling, S., & McAleer, M. (2003). Asymptotic theory for a Vector ARMA-GARCH model. Econometric Theory, 19(2), 280–310. https://doi.org/10.1017/S0266466603192092
- Majdoub, J., & Mansour, W. (2014). Majdoub, J., & Mansour, W. (2014). Islamic equity market integration and volatility spillover between emerging and US stock markets. The North American Journal of Economics and Finance, 29, 452–470. https://doi.org/10.1016/j.najef.2014.06.011
- Majdoub, J., Sassi, S. B., & Bejaoui, A. (2021). Can fiat currencies really hedge Bitcoin? Evidence from dynamic short‑term perspectiveDecis. Econ. Financ. https://doi.org/10.1007/s10203-020-00314-7
- Mandelbrot, B. B. (1963). The variation of certain speculative prices. Journal of Business, 36(4), 394–419. https://doi.org/10.1086/294632
- Mauro, P., & Zilinsky, J. (2015), ‘Which countries are most exposed to China?’, China Economic Watch, August 28, 2015, Peterson Institute for International Economics. https://www.piie.com/blogs/china-economic-watch/which-countries-are-most-exposed-china
- McIver, R. P., & Kang, S. H. (2020). Financial crises and the dynamics of the spillovers between the US and BRICS stock markets. Res. Int. Bus. Finance, 54, 101276. https://doi.org/10.1016/j.ribaf.2020.101276
- Nandy, S., & Chattopadhyay, A. K. (2019). ‘Indian stock market volatility’: A study of inter-linkages and spillover effects. Journal of Emerging Market Finance, 18(2_suppl), S183–S212. https://doi.org/10.1177/0972652719846321
- *Rubbaniy, G., Cheema, A., & Samitas, A., (2020). Are cryptos safe-haven assets during COVID-19? Evidence from Wavelet Coherence Analysis (preprint).
- Shahzad, S. J. H., Naeem, M. A., Peng, Z., & Bouri, E. (2021). Asymmetric volatility spillover among Chinese sectors during COVID-19. International Review of Financial Analysis, 75, 101754. https://doi.org/10.1016/j.irfa.2021.101754
- Tsakalos, I., Samitas, A., & Kinias, I. (2015). Volatility spillovers between energy market and international financial markets. Investment Management and Financial Innovations, 12(2), 136–149.
- Uludag, B. K., & Khurshid, M. (2019). Volatility spillover from the Chinese stock market to E7 and G7 stock markets. Journal of Economic Studies, 46(1), 90–105. https://doi.org/10.1108/JES-01-2017-0014
- UNCTAD (2019), World Investment Report 2019 - Special Economic Zones, UNCTAD/WIR/2019, United Nations.
- Vo, X. V., & Tran, T. T. A. (2020). Modelling volatility spillovers from the US equity market to ASEAN stock markets. Pacific-Basin Finance Journal, 59, 101246. https://doi.org/10.1016/j.pacfin.2019.101246
- Zeng, S., Jia, J., Su, B., Jiang, C., & Zeng, G. (2021). The volatility spillover effect of the European Union (EU) carbon financial market. Journal of Cleaner Production, 282, 124394. https://doi.org/10.1016/j.jclepro.2020.124394
- Zhang, W., Zhuang, X., Lu, Y., & Wang, J. (2020). Spatial linkage of volatility spillovers and its explanation across G20 stock markets: A network framework. International Review of Financial Analysis, 71, 101454. https://doi.org/10.1016/j.irfa.2020.101454