
 ?Mathematical formulae have been encoded as MathML and are displayed in this HTML version using MathJax in order to improve their display. Uncheck the box to turn MathJax off. This feature requires Javascript. Click on a formula to zoom.
Abstract
This study examined the impact of financial inclusion on economic growth disaggregated into traditional finance and digital finance with its sub-dimension for 29 Sub-Saharan African countries, 2012–2020. The study employed the panel feasible generalised least squares and panel system generalised method of moment procedures, and the panel vector autoregression Granger causality test. The results revealed that for the full sample; (1) Both the traditional and digital financial inclusion have positive and significant impact on economic growth, (2) The impact of the traditional financial inclusion in magnitude is more than that of the digital financial inclusion which also is replicated in the access sub-dimensions, (3) Unlike the access sub-dimensions the relative impact of the usage sub-dimension shows no large difference between the traditional and the digital finance. For the sub samples divided into low-income and middle-income countries; (4) The impact of traditional and digital financial inclusion is different across income levels. Both traditional and digital finance are positive and significant in middle income countries while only digital finance is significant in low income countries, (5) Economic growth Granger caused more of traditional finance than the traditional finance Granger caused economic growth, (6) The access sub-dimension to financial services Granger caused more of economic growth than the usage sub-dimension, (7) Digital financial inclusion is neutral in middle-income countries but not in low-income countries. The study recommends that even as digital finance is the new concept in the context of a developing economy, the traditional banking structures should not be neglected.
1. Introduction
Over recent years, exploring the dynamics of economic growth and its various determinants has been widely discussed in literature. Amongst the numerous factors influencing economic growth, financial inclusion has gained attention among scholars, stakeholders, and policymakers (Schonerwald & Vernengo, Citation2016). The focus on financial inclusion stemmed from several global demands, such as the Alliance for Financial Inclusion Initiative (AFI) in 2009 and the G20 summit in 2010 (Klapper et al., Citation2016; Polloni Silva et al., Citation2021). Consequently, it has led to empirical research on the proliferation of financial inclusion globally (Anarfo et al., Citation2020); its impact on economic growth (Dahiya & Kumar, Citation2020), and income inequality and poverty (Polloni Silva et al., Citation2021). The contribution of financial inclusion prompted development institutions such as the International Monetary Fund (IMF), the World Bank and African Development Bank (AfDB) to fund research on financial inclusion (Ndlovu & Toerien, Citation2020).
However, around 1.7 billion adults in the world are still unbanked, with 65% of the people in the poorest nations without transaction accounts and just 20% saving in the formal financial system (Pazarbasioglu et al., Citation2020). In 2017, the Global Findex report documents that only 33% of bankable adults have a transaction account in sub-Saharan Africa (SSA), signifying the region as the highest in the number of non-transaction accounts compared to other regions of the world (Demirgüç-Kunt et al., Citation2018). The poor financial inclusion in Africa prompted the development of mobile money, a financial technology-based payment method. Mobile money in SSA has grown 11 times between 2011 and 2020, whereby it accounted for 64% of all global mobile money transaction values, reaching $490 billion in 2020 (GSMA, Citation2021). The region also accounted globally for 53% of monthly active accounts, 45% of global registered mobile money accounts and 48% of registered agents in 2019. Presently, on average, in over 20 fragile states with mobile money services (digital financial services), there are about 47 mobile money agents for every commercial bank branch, leading to the spread of innovative financial products and access to financial services (Espinosa-Vega et al., Citation2020).
The low financial inclusion is worrisome considering that financial inclusivity can arguably create inclusive economic wealth. However, the introduction of digital finance has reduced the burden of transaction costs and other inconveniences associated with opening a formal bank account for low-income households in developing countries (Pazarbasioglu et al., Citation2020). Digital financial services have made finance more accessible to people in developing countries by making it easier and cheaper to get financial services (Fouejieu et al., Citation2020). Besides the traditional means of financial services open to customers in the banks, digital financial services in developing countries have been transformational with the objective of linking the unbanked to the formal financial system (Kim et al., Citation2017). The financial landscape in developing countries has been reshaped due to mobile money, and the traditional banking giants have been bypassed. The likelihood of receiving financial services using mobile phones has meaningfully improved financial inclusion (Blancher et al., Citation2019), bridging the prevailing financial infrastructural gap in developing countries (Chatterjee, Citation2020).
Although theoretical underpinnings imply that finance drive economic growth, specific empirical evidence is limited concerning both traditional and digital financial inclusion. However, while traditional financial inclusion positively affects growth, do digital financial inclusion show the same effect in the SSA? And if they do, how much impact comparatively? Does their impact differ across different income levels? These questions are relevant and begs for empirical answers. Existing empirical research by Menyelim et al. (Citation2021), Ifediora et al. (Citation2022), and Adedokun and Ağa (Citation2021) have focused on the influence of traditional or comprehensive financial inclusion on the SSA economy. While Mawejje and Lakuma (Citation2019), Nan (Citation2019), and Alhassan et al. (Citation2021) looked at the impact of mobile money on economic activities in Uganda and SSA countries respectively. There is no study that have examined the comparative impact of traditional and digital financial inclusion considering the multidimensional nature of each construct in the SSA. Therefore, the motivation for this study is the evidence that traditional financial services and mobile money can coevolve (Gosavi 2015) but there is no empirical result to show their relative importance in SSA economies with the current growth of financial technology in the region. Our study empirically departs from the existing studies, as it compares relative importance of traditional and digital finance in the SSA with the advent of and proliferation of digital financial services in the SSA region.
Consequently, this study contributes to the financial inclusion–economic growth nexus in the SSA by developing separate indexes for both traditional and digital financial inclusion and their impact on economic growth in the SSA. It provides an opportunity to see how each of the indexes has fared in contributing to economic growth in the SSA. This becomes more apparent with the recent COVID-19 crisis, where digital finance served as a contactless, secure, and low-cost financial tool. Secondly, this study added a wider range of financial inclusion indicators to construct a robust composite index of financial inclusiveness, albeit in the dimension of traditional and digital finance in the SSA. Thirdly, another contribution is the bundling of both the traditional and digital financial inclusion indicators into their access and usage sub-dimensions using principal component analysis (PCA) and estimating their impact on economic growth. This provides the opportunity for focused policy actions in relation to each dimension. Fourth, we assume income heterogeneity across SSA countries and account for differences in income groupings for low- and middle-income countries using World Bank Categorisation 2020. This allows us to understand the role the economic stage of a country plays in the different impacts of both traditional and digital financial inclusion. Finally, this study applied the generalised least squares (GLS), generalised method of moment (GMM), and Panel Granger causality tests to the relationship between financial inclusion (disaggregated and sub-dimensions) and economic growth in Sub-Saharan Africa from 2012 to 2020. The set of techniques was used to scrutinise the sensitivity of the result and create a robust, efficient, and reliable estimation.
This paper is structured as follows; Section 2 presents the review of related literature and hypothesis development; Section 3 presents the methodology; Section 4 presents the empirical results and discussion; and Section 5 is the conclusion remarks and policy implications.
2. Review of Relevant Literature and Hypotheses Development
Generally, the financial sector can be discussed within two broad areas:—financial development (financial depth and liquidity) and financial inclusion (financial access; Lenka, Citation2021). The focus of financial development is the integration of financial markets, institutions, and foreign capital flows to reduce information, enforcement, and transaction costs (Ibrahim & Alagidede, Citation2018). However, the major objective of financial inclusion is to link the financially underserved to transparent, affordable, and reliable financial services to the benefits of mostly the poor (Sarma, Citation2015; Siddik et al., Citation2019). Financial inclusion and financial development are largely relative concepts; it is important to note that a country can be financially developed while still having many people who do not have access to formal financial services (Lenka, Citation2021; Sarma, Citation2008). Thus, the two concepts support economic growth to varying degrees (Li & Wong, Citation2018). Financial inclusion enables the utilisation of financial services such as deposits, loans, and payment systems, resulting in investments in businesses, health, and education, thus, influencing the economy (Demirgüç-Kunt et al., Citation2018; Klapper et al., Citation2016; Von Fintel & Orthofer, Citation2020).
A large body of theoretical literature has highlighted the importance of the financial sector in economic growth (Mckinnon, Citation1973; Schumpeter, Citation1912; Shaw, Citation1973). In the distribution of scarce economic resources, the role of the financial sector is vital in providing low-cost financial services, thus encouraging economic growth (Chen et al., Citation2021). Financial inclusiveness improves the economy through multiple channels—(1) provision of low and efficient payment methods (Ahmad et al., Citation2021). (2) improvement in the distribution of economic resources (Omar & Inaba, Citation2020). (3) risk sharing and innovation (Jack & Suri, Citation2014; Yao et al., Citation2022). (4) provision of information on availability and possible investment opportunities (Abramova et al., Citation2022; Ozili, Citation2018). Besides, the effect of traditional financial inclusion on economic growth is felt in two major ways. The first is the provision of low-cost financial services to the underserved, which encourages more economic activity, increased total output, and better wellbeing (Adedokun and Aga 2021; Nanda & Kaur, Citation2016). The second channel is creating a pool of savings through giving the unbanked access to deposit and insurance services, which flows to the financial markets. Of course, the second channel guarantees long term investments through efficient allocation of funds, leading to increased employment and more productivity (Ramkumar, Citation2017; Yoko, Citation2010). Yet, traditional finance is often inundated by risk taking and higher cost, which marks the beginning of financial crises (Maruta et al., Citation2020). On the other hand, in the last decade, Financial Technology (FinTech), also known as digital finance, has developed and grown popular in bringing innovative financial services and products to people via mobile phones, personal computers, the internet, and cards (Manyika et al., Citation2016). FinTech has introduced innovative means of interaction and communication between borrowers and lenders.
Digital financial services are revolutionising the payment, savings, and lending environments, especially in the context of financial inclusion (Ozili, Citation2018). The fintech growth may successfully reduce transaction costs and ease information asymmetry within the financial system due to more customer testing, information sharing and risk assessment that are made easier. It therefore boosts entrepreneurship (Honglei, Citation2021; Yin et al., Citation2019), increases household income (Zhang et al., Citation2020), increases household consumption (Li et al., Citation2019), encourages international trade (Fernandes et al., Citation2019), improves financial development (Fu et al., Citation2020; Meifang et al., Citation2018; Wu et al., Citation2020) with these proxies widely documented to contribute to economic growth (Appiah‐Otoo & Song, Citation2022; Peia & Roszbach, Citation2015; Hook, and Singh 2014). However, modern technologies even with its positive impacts, also attracts people that abuse the technology for financial gains such as cybercriminals and fraudsters (M. A. Ali et al., Citation2019; McAfee, Citation2018). Disruptive technology emerged the same time with new fraud vectors making existing detection systems obsolete (Ryman-Tubb et al., Citation2018). While there is progress in the fight against digital crime, it requires a lot of resources (Achim et al., Citation2021; Gogolin, Citation2010), which could result in a net loss to the economy.
Previous empirical literature has shown that financial inclusion positively influences economic growth. For example, Thomas et al. (Citation2017) discovered in South Asia that financial accessibility positively influences economic growth. Kim et al. (Citation2017) examined how financial inclusion relates to economic growth of 55 Organisation of Islamic Countries. The study found that financial inclusion affects economic and, they have mutual causality. While Menyelim et al. (Citation2021) and Adedokun and Ağa (Citation2021) used a panel of several sub-Saharan African countries and discovered that financial inclusion positively influences economic growth. Several other empirical studies have discovered that financial inclusion, both traditional and digital financial inclusion, have a positive effect on economic growth (Alhassan et al., Citation2021; Dahiya & Kumar, Citation2020; Emara & Said, Citation2021). In relation to the relationship between financial inclusion and economic growth, Shen et al. (Citation2021) found that digital financial inclusion positively affects economic growth, with spatial effect to other neighbouring countries. Mawejje and Lakuma (Citation2019) and Nan (Citation2019) discovered that mobile money has a positive effect on aggregate economic activity in Uganda and SSA, respectively. While Myovella et al. (Citation2020) discovered that digitization of the economy fosters economic growth in OECD and SSA economies. Ahmad et al. (Citation2021) reported that digital financial inclusion affects economic growth in China significantly. M. A. Ali et al. (Citation2019) empirically observed that financial inclusion encouraged economic growth in Islamic Development Bank member countries. Thus, due to the significant growth of the digital financial services over the traditional financial services, reflecting in more financial inclusion (Espinosa-Vega et al., Citation2020), we hypothesis that:
H1: Both traditional and digital finance influence economic growth with differing magnitudes in SSA countries.
Additionally, providing an explanation of the cross-country and time differences in economic growth led to two major economic growth models—exogenous and endogenous growth models. The highpoints of the exogenous growth model are labour productivity (Domar, Citation1946) and technological progress that happened outside the system (Solow, Citation1956), which are referred to as factors that explain the economic growth differentials around the world economies. However, the model does not recognise the efficiency factors like a suitable regulatory environment, macroeconomic conditions, and savings-investment transforming institutions (Chirwa & Odhiambo, Citation2018). In contrast, the interest of the endogenous growth model lies in human, intellectual, and innovative capital in describing the growth differentials over time and across countries (Chirwa & Odhiambo, Citation2018; Romer, Citation1986). The new growth theory assumes that technological progress happens through innovation in the form of processes, products, and markets; mostly determined by economic outcomes. Quite a few scholars in the endogenous growth framework have documented the part played by traditional financial services (Ibrahim & Alagidede, Citation2018) and financial technology (e.g., mobile money; Srouji, Citation2020). The impact of traditional or digital finance on economic growth could vary according to income levels or groupings of a country. The difference in income level might increase the use of financial technology and then economic growth by increased investment and employment (Feng et al. 2019). Besides, the growth effect of financial inclusion is contingent on numerous factors, such as the level of financial development, income level, investment, education level and employment (Bekele, Citation2022; Zins & Laurent, Citation2016). These factors are mostly found in higher-income countries than low-income countries. These factors aid to expand the spill-over effect of digital finance on economic growth. Digital financial inclusion can benefit the economy in a variety of ways, including increased firm operational efficiency, which leads to increased income and savings (Schneider, Citation2018); meeting the needs of low-income users through lower financial service costs (Lu et al., Citation2022) and closing the rural-urban income gap (Zhang et al., Citation2019). Also, it facilitates the reduction of financial constraints for micro, small, and medium enterprises (Lu et al., Citation2022; Yang & Zhang, Citation2020). Thus, we present the following hypothesis:
H2: The impact of traditional and digital finance on economic growth is heterogeneous across different income groups is the SSA
In addition, it is difficult to ascertain the direction of the casual relationship between economic growth and financial inclusion without empirics. Previous research on the finance-growth nexus proposed four hypotheses: supply-leading hypothesis (SLH), demand-following hypothesis (DFH), feedback hypothesis (FH), and neutrality hypothesis (NH). The SLH proposed that the financial sector precedes economic growth, and it happens through accelerating efficiency in financial services and institutions and enhancing capital accumulation. Cihak et al. (Citation2016) put forward that a significantly greater rate of growth is observed in sectors that, to an extent, rely on external finance in economies with higher levels of financial depth. Sharma (Citation2016) and Lenka and Sharma (Citation2017) found that causality runs from financial inclusivity to economic growth in India. Second, the DFH suggests that the growth of the economy precedes the financial sector. The argument presented by DFH is that economic expansion drives the demand for financial services, which improves institutional efficiency, payment mechanisms, and diversifies investment risks. Pradhan et al. (Citation2015) observed a causal relationship running from economic growth to the financial sector. Third, the FH suggests a bidirectional causal relationship between economic growth and the financial sector. It is that the economy and the financial sector are interconnected so that they cause each other at the same time. Empirical studies such as M. A. Ali et al. (Citation2019), Singh and Stakic (Citation2020), and Thathsarani et al. (Citation2021) documented a feedback mechanism between financial inclusion and economic growth. Also, Siddik et al. (Citation2019), Sethi and Acharya (Citation2018) and Gourene and Mendy (2019) found in their study that economic growth and financial inclusion have bidirectional relationship. Other studies such as Bara et al. (Citation2016) and Bara et al. (Citation2016) confirmed bidirectional causality between financial innovation and economic growth. However, Sharma (Citation2016), and Gourène and Mendy (Citation2019) provide indications for the neutrality hypothesis between financial inclusion and economic growth. Since there is no consensus on the direction of causality between financial inclusion and economic growth, it is imperative to investigate the causal relationship between disaggregated financial inclusion levels and economic growth in the SSA countries. Therefore, we outline the following hypothesis:
H3: There is no causality between economic growth and, traditional and digital finance in the SSA
3. Methodology
3.1. Data
Panel data was used to investigate the impact of financial (traditional and digital) inclusion on the economic growth of 29 SSA countries, further divided into low-income and middle-income, from 2012–2020. The 13 low-income countries are Benin, Burkina Faso, Chad, Guinea, Madagascar, Mali, Mozambique, Niger, Rwanda, Sudan, Togo, Uganda and Zimbabwe while the 16 middle-income countries are Angola, Botswana, Cameroon, Congo Republic, Cote d’Ivoire, Eswatini, Ghana, Kenya, Lesotho, Mauritius, Namibia, Nigeria, Senegal, Seychelles, South Africa and Zambia. It is important to note that 2012 was chosen as the starting year because of the introduction of mobile money in that year, reflecting the expansion of digital financial services in developing countries (Demirguc-Kunt & Klapper, Citation2012; Nguyen, Citation2020). The choice of the countries included in the study was based on data availability.
We choose GDP per capita (GDPPC) at constant 2010 US$ as proxy for economic growth (Adedokun & Ağa, Citation2021; Kim et al., Citation2017; Thathsarani et al., Citation2021). The GDPPC value is sourced from the World Bank’s World Development Indicators (World Bank, Citation2020) and expressed in natural logarithm. We measured financial inclusion in this study in accordance with the work of Khera et al. (Citation2021), Ismael and Ali (Citation2021), and Nguyen (Citation2020), who measured both traditional (TFI) and digital (DFI) financial inclusion and its dimensions—traditional access sub-dimensions (TADI), digital access sub-dimensions (DADI), traditional usage sub-dimensions (TUDI), and digital usage sub-dimensions (TADI). The indicators for financial inclusion were obtained from the Financial Access Survey Database of the International Monetary Fund (IMF, Citation2020) and normalised with a natural logarithm.
Evidence from literature has also shown that economic growth could be influenced by macroeconomic as well as demographic factors. Therefore, for the control variables, we included total investment as a share of GDP (INV), total population of ages 15–64 (POP), trade openness (TROP), government expenditure as a share of GDP (GEX), primary school enrolment ratio (PSE) and inflation rate (INF) following other previous empirical studies (see, Adedokun & Ağa, Citation2021; Ahmad et al., Citation2021; Menyelim et al., Citation2021) and were sourced from the World Bank World Development Indicators (World Bank, Citation2020). Table is the summary of variables, description, and sources.
Table 1. Variables, Description and Sources
3.2. Measurement and Construction of Financial Inclusion Index
Predictably, there is no consensus when it comes to measuring financial inclusiveness, as there is with defining financial inclusion, and it has given rise to several scholars using varied financial inclusion indicators. Some of the studies (see, Demirguc-Kunt & Klapper, Citation2012; Demirgüç-Kunt et al., Citation2018, Citation2015) used individual indicators which could only provide a fractional indication of the financial inclusiveness and coverage level in an economy (Sarma 2016; Nguyen, Citation2020). Considering the limitation of the individual measures of financial inclusion, a multidimensional approach has been deemed appropriate, combining different dimensions—access, penetration, usage, and barriers (Sarma, Citation2008). Sarma (Citation2008) used the United Nations Development Program (UNDP) for the human development index (HDI) in constructing the financial inclusion index. Many studies have used this method (see, Huang & Zhang, Citation2019; Kim, Citation2016; Sethi & Sethy, Citation2019). However, the limitation of the UNDP’s approach is that it assigns arbitrary or equal weights based on experience or academic intuition of the researcher (Singh & Stakic, Citation2020). Therefore, another approach—principal component analysis—was introduced by Clamara and Tuesta (2014) and has been employed by other studies (see, Nguyen, Citation2020). This approach normalised each variable with a weighted geometric mean. Due to the multidimensionality of financial inclusion, there is still controversy over the variables to be included. Variables that capture payments, loans, and deposits are deemed appropriate and are aggregated to measure financial inclusion, especially the access and usage dimensions of financial services (Demirguc-Kunt & Klapper, Citation2012; Demirgüç-Kunt et al., Citation2018, Citation2015).
For the access dimension, the financial system is inclusive when it is reachable and widely penetrated in society. In our study, we used six indicators to measure traditional access dimensions; number of deposit accounts with commercial banks, credit unions, and credit cooperatives per 1,000 adults (TAD1); number of commercial banks, microfinance institutions, and credit unions and credit cooperatives loan accounts per 1,000 adults (TAD2); number of commercial banks, microfinance institutions, and credit unions and credit cooperatives branches per 100,000 adults (TAD3) number of ATMs per 100,000 adults (TAD4) (demographic spread); number of commercial banks, microfinance institutions, and credit unions and credit cooperatives branches per 1,000 km2 (TAD5); and number of ATMs per 1,000 km2 (TAD6) (geographic spread). On the other hand, we measured the access dimension of digital financial inclusion with four indicators: mobile money accounts per 100,000 adults (DAD1); number of mobile money agents per 100,000 adults (DAD2) (demographic spread); number of mobile money agents per 1,000 km2 (DAD3) (geographic spread); and mobile cellular subscription per 100 people (DAD4). Mobile cellular subscriptions were included to measure digital infrastructure.
On the other hand, although having access to financial services is necessary, it is not sufficient without people making use of them. In this study, we used two indicators to measure the usage of traditional financial inclusion, which are commercial banks’, credit unions’, and credit cooperatives’ outstanding deposits as a percentage of GDP (TUD1) and commercial banks’, microfinance institutions’, and credit unions’ and credit cooperatives’ outstanding loans as a percentage of GDP (TUD2). For the usage sub-dimension of digital financial inclusion, we utilised the number of mobile money transactions per 1000 adults (DUD1) and the total volume of mobile money transactions (% of GDP) (DUD2).
To construct the indexes (aggregated, disaggregated, and the dimensions) of financial inclusion in this study, the principal component analysis (PCA) was applied to guarantee robustness and circumvent the problem of multi-collinearity. The PCA method is used because financial inclusion is an unobservable construct and it cannot be measured with a quantitively straightforward method (Camara & Tuesta, Citation2014). PCA is a multidimensional method that transforms several variables that are correlated into an uncorrelated small number of variables. It uses the original variables’ weighted linear combinations to construct each component, which allows larger variances in the principal components (Jolliffe, Citation2002). This process reduces a set of observed variables into principal components which retain information from the original set of variables as much as possible. Unlike the method used by Sarma (Citation2008), the PCA method is less random in assigning weights. However, it depends on the existing data.
Table provides the descriptive statistics of the variables in our regressions. The GDPPC averaged 3.21, with the difference between the minimum and maximum greater than 1.5, showing a relative income gap between the countries. Similarly, some of the control variables maintained a fair spread, except population growth and inflation, which showed a wide gap between the minimum and maximum values. Finally, the disaggregated financial inclusion indicators (TFI, DFI) and their sub-dimensions (TADI, TUDI, DADI and DUDI) have similar values in terms of the standard deviations, although they show a large difference between the maximum and minimum values. Also, Figure reveals the association between the various indexes of financial inclusion, their dimensions, and GDP per capita. It reveals that the indexes from the traditional financial inclusion dimension have a positive relationship with GDP per capita while the indexes from the digital financial inclusion dimension have a negative relationship with economic growth. However, the trend relationship is not enough to make an inference; therefore, the regression analysis.
Figure 1. Various Indexes of Financial Inclusion and GDP per capita.
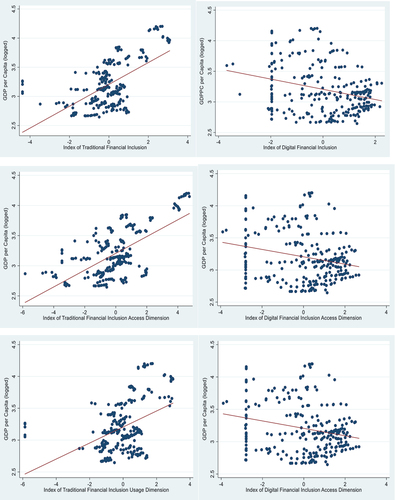
Table 2. Descriptive Statistics of Variables
3.3. Model Specification and Estimation Strategy
After the review of both theoretical and empirical literature, to estimate the impact of financial inclusion (traditional and digital finance) on economic growth in the SSA, the model specification is in line with Nizam et al. (Citation2020), and Ahmad et al. (Citation2021). The model is specified as follows:
where is the log of GDP per capita for country
at time
,
represents the index of different disaggregates of financial inclusion and its dimensions,
is the vector of control variables which include total investment as a share of GDP (INV), total population (POP), trade openness (TROP), Government expenditure as a share of GDP (GEX), primary school enrolment ratio (PSE), and inflation rate (INF).
is the intercept coefficient,
is the coefficient parameter for the financial inclusion measures,
is the vector of parameters for the control variables,
represents the country-specific effects,
is the time-invariant factor and
is the random error term.
First, to estimate EquationEquation (1)(1)
(1) , the fixed and random effect estimation is the most considered method, with the Hausman test used to select of the better suited of the two models. However, it is not consistent with autocorrelation and heteroscedasticity. Therefore, the Wooldridge autocorrelation test (Wooldridge, 2010) and the groupwise heteroskedasticity modified Wald test (Greene, Citation2002) were employed to guarantee reliable estimates. It is found that there are autocorrelation and heteroskedasticity problems (see the Wooldridge and the modified Wald tests in Table ) and these invalidates the use of traditional random and fixed effects. Thus, we employed the Feasible Generalized Least Squares (FGLS) method (Parks, Citation1967) to estimate EquationEquation (1)
(1)
(1) , due to its capability to resolve the issues of heteroskedasticity across panels and autocorrelation within panels. While Feasible Generalized Least Squares uses the approach in the random-effects estimation, we likewise estimated the fixed-effects FGLS (FE-GLS) by including the country-specific dummy variables and eliminating the intercepts.
Table 3. Baseline Result
Table 4. The Access sub dimension (Traditional and Digital) and GDP per capita
Table 5. The Usage sub dimension (Traditional and Digital) and GDP per capita
Further, in empirical growth models, another important issue worth consideration is the dynamic effects. It has been empirically shown that the present value of economic growth is related to its past value (M. A. Ali et al., Citation2019; Van et al., Citation2019). Therefore, we take account of the dynamic effect of the growth model by including the lagged GDP per capita in the RHS of EquationEquation (1)(1)
(1) . The dynamic model is expressed in EquationEquation (2)
(2)
(2) :
where is the lagged value of the dependent variable.
To estimate EquationEquation (2)(2)
(2) , the study employed the generalised method of moments, which can control for simultaneity and endogeneity in the model to improve the accuracy and consistency of the results. Specifically, in this study, we employed the Arellano and Bover (Citation1995) and Blundell and Bond (Citation1998) estimation techniques for the dynamic panel model. Also, the GMM method is appropriate for the reduced-form models, thereby giving parsimonious models relative to other regression techniques. Meanwhile, countries have differences in their macroeconomic, demographic, and governance factors, which other techniques find it difficult to handle. However, the GMM technique handles this issue of country-specific effects (unobserved heterogeneity) by employing the Helmet transformation (Arellano & Bover, Citation1995; Love & Zicchino, Citation2006). The GMM technique can handle heteroskedasticity, autocorrelation, and omitted variable biases. Furthermore, in line with other studies that have used GMM application, the Arellano and Bond autocorrelation [AR(2)] is not rejected, while the over-identification restrictions (OIR) tests of Sargan and Hansen are rejected. It shows that the model does not suffer from the problem of autocorrelation and that the instruments are valid, respectively. Similarly, to avoid instrument proliferation, the instruments used are less than the number of cross sections. Nonetheless, the Arellano and Bover (Citation1995) and Blundell and Bond (Citation1998) have two alternatives-one step and two step GMM estimators. The two-step option is more asymptotically efficient because of the optimal weighting matrix, which is not available in the one-step option. So, in this study, we implemented the two-step GMM estimator.
3.4. Panel Granger Causality Test
To estimate the causal relationship between financial inclusion (traditional and digital) and economic growth, we employ panel causality test developed by Holtz-Eakin et al. (Citation1988). The model is an offshoot of a panel vector autoregressive model developed as an alternative to simultaneous equation model (Love & Zicchino, Citation2006). The panel-vector autoregressive (PVAR) model is the combination of the traditional VAR method (looking at all variables as endogenous), and the panel-data method (allowing for unobserved individual heterogeneity) with fixed effects which gives a consistency of the estimation (Love & Zicchino, Citation2006). Thus, the study specifies the following PVAR model given that the innovations possess the following: = 0 for all t > s.
Where , is the vector of constant terms for each variable,
is the lag operator, and
represents a vector of all endogenous variables. Subscripts i and t are country and time observations respectively while ƒi denotes the fixed effect, while εi,t represents the vector of idiosyncratic errors. The above parameters in EquationEquation (3)
(3)
(3) may be estimated with the fixed effects jointly or, without the fixed effects after transformation, and applying equation-by-equation ordinary least squares (OLS). Given that lagged dependent variables will appear in the right-hand side of the system of equations even with large N, estimates would still be biased (Nickell, Citation1981), though the bias will be approaching zero with larger N. However, the GMM based approach has been proposed for consistent estimates, especially in large N and fixed T method when the moment condition assumption is not satisfied (Love & Zicchino, Citation2006). As a result of the panel data size in this study, the panel VAR model used one lag order to evade the problem of parameter deviation due to the degree of freedom (Abrigo and Love 2016). After the PVAR regression, the Granger causality can be estimated to test the direction of causality. The choice of this method is due to the micro data nature of our observations and the presence of endogeneity in the models.
4. Results and Discussion
4.1. Baseline Result
Table presents the baseline results from different estimation strategies using the indexes of disaggregated financial inclusion on economic growth. As earlier described, the FGLS and FE-GLS methods were used to estimate all the models due to heteroskedasticity and autocorrelation in the models. However, also due to the issue of endogeneity, which is significant in the models [see Durbin-Wu-Hausman (D-W-H) test in Table ], we estimated the two step GMM as they tend to reduce biasness and increase consistency. So, in the event of inconsistency in the estimation results between the models, our explanation will be focused on the GMM strategy. The results for the traditional financial inclusion index are shown in columns 1 to 3, the digital financial inclusion index is in columns 4 to 6, while the comprehensive financial inclusion index is in columns 7 to 9.
The lagged value of economic growth (GDPPC-1) has a positive and significant impact on the current value considering that all coefficients in the GMM estimation (see column 3, 6, and 9) are found to be positive. Therefore, the results demonstrate that there seems to be no conditional convergence where smaller countries in terms of income per capita grow faster than higher income countries in SSA. Regarding economic growth in sub-Sahara Africa, all financial inclusion-related indexes are positive and significant, indicating great potential to increase economic growth in the countries contained in the analysis. These results indicate that whether it is traditional financial inclusions or digital financial inclusions, increased accessibility to financial services leads to increased involvement in economic activities by firms and households that have had credit constraints. This agrees with the financial inclusion and growth literature (see, Adedokun & Ağa, Citation2021; Shen et al., Citation2021; Ahmad et al., Citation2021 and others). Financial inclusion increases the accumulation of credit and assets, and digital finance improves economic growth through efficiency in financial services. Digital financial inclusion encourages the underserved in SSA to contribute more to economic activities by utilizing smartphones to make and receive payments.
Thus, the empirical results reveal that traditional financial inclusion has more pronounced impact than the digital financial inclusion on economic growth, by this means confirming hypothesis 1. In terms of magnitude, economic growth increases by 1% and 0.2% for any 1% increase in the traditional financial inclusion index and the digital financial inclusion index, respectively. The result shows that traditional and digital financial inclusion can work effectively together in SSA. Our finding conflicts with Khera et al. (Citation2021), where the authors discovered that digital financial inclusion encourages economic growth while traditional financial inclusion hurts the economies of emerging markets and developing countries. However, Khera et al. (Citation2021) formed an index of financial inclusion with data averaged between 2011 and 2018 with a limited number of indicators of both traditional and digital financial inclusion. Therefore, the implication of our result for the SSA is that, even with the emergence of digital finance and its huge prospects, traditional finance still contributes massively to economic growth.
Similarly, concerning the control variables, the level of investment in most models is positive and significant in its contribution to economic growth, supporting Emara and Said (Citation2021). The population growth rate and the level of trade openness appear to have a negative marginal impact on GDP per capita, with almost all the coefficients of trade openness insignificantly supporting Adedokun and Ağa (Citation2021) in the SSA. The result could be explained by the level of unskilled workers and the availability of modern technology, which alienate able-bodied men in the region. The percentage of government expenditure to GDP seems to be significantly negative for the selected countries, meaning that the higher the government expenditure, the more GDP per capita is reduced; in line with the study of Van et al. (Citation2019). The major explanation could be from the dominance of primary products in the region’s export and importation of final goods and services, which turned the SSA into a dumping ground. The level of human capital measured by primary school enrolment negatively affects economic growth, with most of the GMM estimates quite insignificant. This outcome supports M. A. Ali et al. (Citation2019) and signifies the poor quality of education in the region, which requires proper capacity building for a turnaround. Finally, the inflation rate as a measure of economic stability exerts a negative and significant influence on the economic growth of the included countries in sub-Saharan Africa.
4.2. Examining the Relationships between the Sub-Dimensions and Economic Growth
Next, we applied the same methods as used in the baseline regression in the sub-dimensions (access and usage) for both traditional and digital financial inclusion. Tables present the results for the access to the traditional financial inclusion index and the access to the digital financial inclusion index, respectively. The index of access to financial inclusion has a positive and significant impact on economic growth in the SSA countries. Our findings are consistent with Ifediora et al. (Citation2022) that found the dimensions of availability and penetration indexes of financial inclusion to have encouraged economic growth in SSA countries. However, for the basic result, access to traditional financial inclusion increases economic growth by 1.2% while access to digital financial inclusion increases economic growth by 0.2% in sub-Saharan Africa. In other words, economic growth could be achieved and sustained through increased banking and digital infrastructural expansion. Again, the impact of access sub-dimension of digital financial inclusion compared to access to traditional financial inclusion could highlight the need for more digital infrastructures to admit more people and transaction points, especially for rural dwellers.
Table reveals the results for the usage of the traditional financial inclusion index and the usage of the digital financial inclusion index, respectively. The indexes of the usage sub-dimension of financial inclusion show a positive and significant influence on economic growth. Our result is consistent with that of Dahiya and Kumar (Citation2020), who discovered the usage dimension of financial inclusion to have impacted GDP per capita in India. Both the usage of traditional and digital financial inclusion reveals just a marginal difference in the magnitude of impact. A percentage increase in the usage dimension of traditional financial inclusion and digital financial inclusion increases economic growth by 0.7% and 0.9%, respectively. Like the basic result, the lagged value of economic growth (GDPPC-1) is positive and significant, showing no conditional convergence. Further, the control variables in Table appear to be relatively consistent with the basic result, giving us the flexibility of the same interpretation.
4.3. Examining the Relationship between Financial Inclusion (Traditional and Digital) and Economic Growth in Low- and Middle-Income Countries
Regarding income heterogeneity, we divided the SSA’s income group into 13 low-income countries and 16 middle-income countries according to the World Bank’s categorisation 2020. Due to the presence of endogeneity and limited space, we focused only on the GMM approach. The impact of traditional and digital financial inclusion on economic growth is different across income levels. Table presents the estimates for middle-income countries and low-income countries, respectively. For the two different income countries, the lagged coefficient of GDP per capita (economic growth) is positive and statistically significant in all the models. It shows no conditional convergence even among the same income groups. In the middle-income countries, both traditional and digital financial inclusion are statistically significant and positive. The result shows that traditional and digital financial inclusion are growth-enhancing in the middle-income countries. This mirrors the varying degrees of regulatory and institutional frameworks that have been implemented in middle-income countries to allow both traditional and digital finance to co-exist, benefiting the economy. For example, the settlement of the disagreement between banks and telecommunication companies on the commercialisation of mobile payment in most developing countries as based on jurisdiction (Chatterjee, Citation2020). However, the magnitude of the result shows that traditional financial inclusion has more impact on the economic growth of the middle-income countries in the sub-region. Again, the effect of financial inclusion on economic growth differs in low-income countries, with traditional financial inclusion being positive and insignificant while digital financial inclusion is positive and significant. Therefore, the implication is that digital financial inclusion is more meaningful in low-income countries than traditional financial inclusion. The high bank overhead costs have limited further growth in financial inclusion by the traditional method in low-income countries. This has suggested inefficiencies in operations in providing financial services, creating a gap that fintech companies have utilised to better influence the economy. Consequently, the empirical results shows that both the traditional and digital financial inclusion has differing impact on economic growth depending on the income group, therefore confirming hypothesis 2.
Table 6. GMM Estimate of the Impact of Traditional and Digital Financial Inclusion on Economic Growth for Middle- and Low-Income Countries
Equally, the control variables did not change considerably from the baseline result under the different income groupings. The level of investment is positive in both middle-and low-income countries, although it is mostly non-significant in low-income countries. The population growth rate is positive and non-significant in middle-income countries, while it is mostly negative and non-significant in low-income countries. The level of trade openness appears to have a positive but non-significant impact on GDP per capita, with almost all the coefficients of trade openness insignificant in both middle- and low-income countries. The percentage of government expenditure to GDP seems to be significantly negative for middle-income countries, while it is relatively positive for low-income countries. Primary school enrolment is positive and significant for the middle-income countries, while it is negative and non-significant in the low-income countries. Finally, the inflation rate is mostly negative and significant for the two income groups in sub-Saharan Africa.
4.4. Panel VAR Granger Causality Test
For comprehensive and sound financial inclusion policy recommendations, we applied the panel VAR Granger causality tests to examine the direction of causality between GDPPC and disaggregated financial inclusion and its sub-dimensions. The actual direction of causality suggests to policymakers how to sustain economic growth as well as achieve financial inclusion. The results are presented in Table for the full sample, the middle-income countries, and the low-income countries, focusing on the various indicators of financial inclusion and economic growth. First, for the full sample, the Granger causality results show a unidirectional causality running from GDPPC to TFI, TADI to GDPPC, GDPPC to TUDI, and GDPPC to DFI. However, there is a bidirectional causality between GDPPC and DADI and between GDPPC and DUDI. Secondly, for the middle-income countries, there is only the demand-following hypothesis and just through traditional means of financial inclusion, where GDPPC precedes TFI, TADI and TUDI. Thirdly, in low-income countries, there is bidirectional causality between economic growth and both traditional and digital financial inclusion, except for the usage sub-dimension of digital financial inclusion, where there is demand-following of financial usage. Therefore, our result did not confirm the hypothesis 3 of no causal relationship between economic growth and financial inclusion in the SSA countries except for the relationship between digital finance and economic growth in middle income countries. GDP per capita growth precedes the growth of inclusion through traditional financial inclusion, especially in middle income countries which buttressed the findings of Pradhan et al. (Citation2015). Also, the growth of access to traditional financial inclusion precedes economic growth (a supply-leading hypothesis where efficiency in the provision of access points improves the economy) supports Sharma (Citation2016) and Lenka and Sharma (Citation2017). Again, the feedback relationship observed in the sub-dimension of digital financial inclusion supports Ali et al. (Citation2019), Siddik et al. (Citation2019), and Thathsarani et al. (Citation2021), and others. While the neutrality hypothesis, especially for digital financial inclusion in middle-income countries, supports Gourène and Mendy (Citation2019).
Table 7. Panel VAR Granger causality test
The implication of our findings is that first, we discovered that economic growth Granger caused more financial inclusion and, in specific, more traditional financial inclusion than the financial inclusion Granger caused economic growth. Indeed, strong income growth can lead to more investments in efficient financial infrastructures to sustain the achieved growth level. The investment in financial infrastructure helps to increase the availability and quality of financial services, increasing the penetration of the teeming population. Also, increased income per capita implies an increase in the demand for financial services and therefore an increase in their use. Secondly, we discovered that the access sub-dimension to financial services Granger caused more economic growth than the usage sub-dimension. The implication is that increased access points such as bank branches and mobile money agents create employment opportunities, therefore, increasing per capita income growth. Again, it is the increased facilitation of financial transactions that could influence the dynamics of the economy. Thirdly, our result shows that per capita income Granger caused more of the usage sub-dimension of financial services than the access sub-dimension. As a matter of fact, the underserved may have decided to make use of the available financial services to save, make payments, and borrow funds due to increased income per capita. Finally, we found that digital financial inclusion is neutral in middle-income countries but not in low-income countries. It could probably explain why developing countries have more mobile money access and usage than developed countries, where there are more people already in the formal financial system. Therefore, the level of the economy could indicate how important digital financial inclusion is to the economy.
5. Robustness Check
To check for the robustness of our results, we first checked for the presence of cross-sectional dependence (CD) using the Pesaran’s 2004 test which is suitable for micro panels (N > T). The essence is that panel studies are mostly bedevilled with the issue of cross-sectional dependence leading to inefficient estimates (Sarafidis & Robertson, Citation2009). Our study observed that there is the presence of cross-sectional dependence (CD) in the full sample and the sub-samples (see, Table ). Therefore, due to the presence of cross-sectional dependence, we used the panel corrected standard errors (PCSE) model to re-estimate EquationEq. 1(1)
(1) . The PCSE method is suitable for a panel study with large cross country and small-time dimension, and it corrects the contemporaneous error correlation between subjects (Beck & Katz, Citation1995). The results are reported in Table (full sample) and Table (sub-samples). For the full sample result, the robust analysis in Table is consistent with the results in Table where both traditional and digital financial inclusion have a positive impact on economic growth. Also, it is consistent in the magnitude where the traditional finance has greater impact on economic growth than digital finance. In addition, the robustness analysis for the sub-sample (see, Table ) reveals also relative consistence, although, it was found that the access sub-dimension became significant in PCSE model than the GMM model. It is worth noting that in all models reported in Table , it satisfied the diagnostic test with the R-square and the Wald Chi-square measuring whether the independent variables explain the dependent variable and are collectively significant, respectively.
Table 8. Robustness Analysis of the Impact of Traditional and Digital Financial Inclusion on Economic Growth using PCSE (Full Sample)
Table 9. Robustness Analysis of the Impact of Traditional and Digital Financial Inclusion on Economic Growth using PCSE (Sub-Sample)
6. Conclusion
In this article, we attempt to evaluate the impact of financial inclusion, disaggregated into traditional and digital financial inclusion, on economic growth in sub-Saharan Africa. Additionally, we also estimated how the sub-dimensions of financial inclusion influenced economic growth. To achieve this, we applied a panel dataset of twenty-nine countries in sub-Saharan Africa, for the years 2012 to 2020. Furthermore, the twenty-nine countries were divided into middle-income countries and low-income countries according to the World Bank groupings. It further allowed us to show how these estimates contrast, given the heterogeneity in the economic capacity of every country. We used several techniques such as Feasible Generalised Least Squares (FGLS), Fixed Effect Generalised Least Squares (FE-GLS), System Generalised Method of Moment (GMM), and Panel VAR Granger causality test to analyse the available data. Also due to the presence of cross-sectional dependence, we used the panel corrected standard errors (PCSE) model for robustness analysis. The robustness test shows relative consistency in the model with the baseline estimates.
From our empirical results, we can draw the following four conclusions. First, financial inclusion, both traditional and digital financial, has a positive effect on GDP per capita. However, the positive impact of traditional financial inclusion on GDP per capita is higher when compared to digital financial inclusion in SSA countries. The sub-dimensions also show that the traditional access sub-dimension is more reflective than the digital access sub-dimension. This applied due to the well-existing banking infrastructure in the SSA, while the access points of digital finance are at its starting point. However, in the SSA, the digital usage sub-dimension had a greater influence on economic growth than the traditional usage sub-dimension. This reflects the constraints to credit access in traditional inclusion, while the digital platform has provided efficient payment and savings methods to those not linked to formal financial institutions. Second, income level may be a factor in how each of the financial inclusion disaggregates influences income per capita. The impact of traditional and digital financial inclusion on economic growth is different across income levels. Traditional and digital financial inclusion can complement or coexist to benefit the economy in middle-income countries, but only digital financial inclusion is meaningful in low-income countries. This could be due to the varying degrees of regulatory and institutional frameworks in the middle-income countries. However, even at the relevance of both traditional and digital financial inclusion in the middle-income countries’ economies, traditional financial inclusion had a greater impact on the economy. In the low-income area, inefficiencies in the operations of banks may have seen FinTech companies utilise the opportunity to deepen financial inclusion and influence economic activities. Thirdly, economic growth preceded financial inclusion more, especially traditional financial inclusion, than financial inclusion preceded economic growth. Therefore, strong income growth led to more investments in efficient financial infrastructure.
Our results present some possibilities for increasing income per capita through financial inclusion, looking at the various facets of financial inclusivity. The outcome of our study should be of great interest to policymakers in SSA countries, considering the numerous programmes designed to improve financial inclusion. If policymakers could improve financial inclusion in SSA countries by even a moderate amount, it could be more effective in changing the trajectory of the sub-region. Even as digital finance is the new concept in the context of a developing economy, the traditional banking structures should not be neglected, especially in middle-income countries. Information asymmetry bedevilling the SSA’s financial system should be resolved to allow households and firms more access to financial services. It will allow a better allocation of financial resources and give the MSMEs more opportunity to access credits without huge risks and large collaterals. Again, for the relative influence of the digital finance, governments of the SSA countries should take more initiatives to encourage the underserved in using the digital finance infrastructure available. These could be through education and sensitization programmes on how to access and use the digital financial technologies. Also, a regulatory framework should be established to treat digital finance and traditional finance as complements rather than substitutes, especially in low-income countries. Lastly, growing the economy could be a means of including more people in the financial system. So, economic growth should be at the centre of every policy consideration in sub-Saharan Africa.
Finally, we recommend that further studies should be carried-out to a larger geographical area, to see if the conclusions change, but also to see exactly which are the factors that determine these changes (size of the country, level of population, political factors, degree of development, degree of education, etc.). Due to the structural differences in these countries, there is a likelihood that their inclusion in the sample may adjust our results and further give us more insights. Therefore, an interesting future research should include every developing country with data on digital financial infrastructure.
Disclosure Statement
No potential conflict of interest was reported by the author(s).
Additional information
Funding
References
- Abramova, M., Artemenko, D., & Krinichansky, K. (2022). Transmission channels between financial deepening and economic growth: Econometric analysis comprising monetary factors. Mathematics, 10(2), 1–30. https://doi.org/10.3390/math10020242
- Achim, M. V., Borlea, S. N., & Văidean, V. L. (2021). Does technology matter for combating economic and financial crime? A panel data study. Technological and Economic Development of Economy, 27(1), 223–261. https://doi.org/10.3846/tede.2021.13977
- Adedokun, M. W., & Ağa, M. (2021). Financial inclusion: A pathway to economic growth in Sub-Saharan economies. International Journal of Finance and Economics, 1–17. https://doi.org/10.1002/ijfe.2559
- Ahmad, M., Majeed, A., Khan, M. A., Sohaib, M., & Shehzad, K. (2021). Digital financial inclusion and economic growth: Provincial data analysis of China. China Economic Journal, 14(3), 291–310. https://doi.org/10.1080/17538963.2021.1882064
- Alhassan, T. F., Guryanov, S. A., & Kouadio, A. J. (2021). The impact of mobile money, remittances, and financial development on innovative growth in sub-Saharan Africa. Economy of Region, 17(1), 276–287. https://doi.org/10.17059/ekon.reg.2021-1-21
- Ali, M. A., Azad, M. A., Centeno, M. P., Hao, F., & van Moorsel, A. (2019). Consumer-facing technology fraud: Economics, attack methods and potential solutions. Future Generation Computer Systems, 100, 408–427. https://doi.org/10.1016/j.future.2019.03.041
- Ali, M., Hashmi, S. H., Nazir, M. R., Bilal, A., & Nazir, M. I. (2021). Does financial inclusion enhance economic growth? Empirical evidence from the IsDB member countries. International Journal of Finance and Economics, 26(4), 5235–5258. https://doi.org/10.1002/ijfe.2063
- Anarfo, E. B., Abor, J. Y., Osei, K. A., & Gyeke-Dako, A. (2020). Financial inclusion and financial sector development in Sub-Saharan Africa: A panel VAR approach. International Journal of Managerial Finance, 15(3), 549–572. https://doi.org/10.1108/IJMF-07-2018-0205
- Ang, J. B. (2008). A survey of recent developments in the literature of finance and growth. Journal of Economic Surveys, 22(3), 536–576. https://doi.org/10.1111/j.1467-6419.2007.00542.x
- Appiah‐Otoo, I., & song, N. (2022). Finance-growth nexus: New insight from Ghana. International Journal of Finance and Economics, 27(3), 2682–2723. https://doi.org/10.1002/ijfe.2294
- Arellano, M., & Bover, O. (1995). Another look at the instrumental variable estimation of error-components models. Journal of Econometrics, 68(1), 29–52. https://doi.org/10.1016/0304-4076(94)01642-D
- Bara, A., Mugano, G., & Roux, P. L. (2016). Financial innovation and economic growth in the SADC. African Journal of Science, Technology, Innovation and Development, 8(5–6), 483–495. https://doi.org/10.1080/20421338.2016.1226705
- Beck, N., & Katz, J. N. (1995). What to do (and not to do) with time-series cross-section data. American Political Science Review, 89(3), 634–647. https://doi.org/10.2307/2082979
- Bekele, W. D. (2022). Determinants of financial inclusion: A comparative study of Kenya and Ethiopia. Journal of African Business, 1–19. https://doi.org/10.1080/15228916.2022.2078938
- Blancher, N., Appendino, M., Bibolov, A., & Fouejieu, A. (2019). Financial inclusion of small and medium-sized enterprises in the Middle East and Central Asia. In Middle East and Central Asia Departmental Paper No (Vol. 19/02). International Monetary Fund.
- Blundell, R., & Bond, S. (1998). Initial conditions and moment restrictions in dynamic panel data models. Journal of Econometrics, 87(1), 115–143. https://doi.org/10.1016/S0304-4076(98)00009-8
- Camara, N., & Tuesta, D. (2014). Measuring financial inclusion: A multidimensional index. SSRN Electronic Journal. https://doi.org/10.2139/ssrn.2634616
- Chatterjee, A. (2020). Financial inclusion, information and communication technology diffusion, and economic growth: A panel data analysis. Information Technology for Development, 1–29. https://doi.org/10.1080/02681102.2020.1734770
- Chen, W., Yuan, X., & Gang, J. (2021). Financial inclusion in China: An overview. Frontiers of Business Research in China, 15(4), 1–21. https://doi.org/10.1186/s11782-021-00098-6
- Chirwa, T. G., & Odhiambo, N. M. (2018). Exogenous and endogenous growth models: A critical review. Comparative Economic Research, 63–84. https://doi.org/10.2478/cer-2018-0027
- Cihak, M., Mare, D. S., & Melecky, M. (2016). The nexus of financial inclusion and financial stability a study of trade-offs and synergies. Policy Research Working Paper, 7722, World Bank.
- Dahiya, S., & Kumar, M. (2020). Linkage between financial inclusion and economic growth: An empirical study of emerging Indian economy. Vision: The Journal of Business Perspective, 1–10. https://doi.org/10.1177/0972262920923891
- Demirguc-Kunt, A., & Klapper, L. (2012). Measuring financial inclusion: The Global Findex database (No. 6025). The World Bank, available at: https://www.bbvaresearch.com/wp-content/uploads/2014/09/WP14-26_Financial-Inclusion.pdf
- Demirgüç-Kunt, A., Klapper, L., Singer, D., Ansar, S., & Hess, J. (2018). Global Findex database 2017: Measuring financial inclusion and the Fintech revolution. World Bank. https://openknowledge.worlbank.org/handle/10986/29510
- Demirgüç-Kunt, A., Klapper, L., Singer, D., & Van Oudheusden, P. (2015). The Global findex database 2014: Measuring financial inclusion around the world. Policy Research Working Paper 7255, World Bank, Washington D.C. https://openknowledge.worldbank.org/handle/10986/21865
- Domar, E. D. (1946). Capital expansion, rate of growth, and employment. Econometrica, 14(2), 137–147. https://doi.org/10.2307/1905364
- Emara, N., & Said, A. E. (2021). Financial inclusion and economic growth: The role of governance in selected MENA countries. International Review of Economics and Finance, 75, 34–54. https://doi.org/10.1016/j.iref.2021.03.014
- Espinosa-Vega, M., Shirono, K., Villanova, H. C., Chhabra, E., Das, B., & Fan, Y. (2020). Measuring financial access - 10 years of the IMF financial access survey. IMF Departmental Paper 20/08, International Monetary Fund, Washington. https://www.imf.org
- Fernandes, A. M., Mattoo, A., Nguyen, H., & Schiffbauer, M. (2019). The internet and Chinese exports in the pre-ali baba era. Journal of Development Economics, 138, 57–76. https://doi.org/10.1016/j.jdeveco.2018.11.003
- Fouejieu, A., Sahay, R., Cihak, M., & Chen, S. (2020). Financial inclusion and inequality: A cross-country analysis. The Journal of International Trade & Economic Development, 29(8), 1018–1048. https://doi.org/10.1080/09638199.2020.1785532
- Fu, J., Liu, Y., Chen, R., Yu, X., & Tang, W. (2020). Trade openness, internet finance development and banking sector development in China. Economic Modelling, 91, 670–678. https://doi.org/10.1016/j.econmod.2019.12.008
- Gogolin, G. (2010). The Digital Crime Tsunami. Digital Investigation, 7(1–2), 1–3. https://doi.org/10.1016/j.diin.2010.07.001
- Gourène, G. A. Z., & Mendy, P. (2019). Financial Inclusion and economic growth in WAEMU: A multiscale heterogeneity panel causality approach. Theoretical Economics Letters, 9(3), 477–488. https://doi.org/10.4236/tel.2019.93033
- Greene, W. H. (2002). Econometric analysis (5th) ed.). Prentice Hall.
- GSMA. (2021). State of the industry report on mobile money 2021. GSM Association. https://www.gsma.com/mobilefordevelopment/wp-content/uploads/2021/03/GSMA_State-of-the-Industry-Report-on-Mobile-Money-2021_Full-report.pdf.
- Holtz-Eakin, D., Newey, W., & Rosen, H. (1988). Estimating vector autoregressions with panel data. Econometrica, 56(6), 1371–1395. https://doi.org/10.2307/1913103
- Honglei, G. (2021). Internet finance innovation and entrepreneurship based on classification algorithm. In V. Sugumaran, Z. Xu, & H. Zhou (Eds.), Application of intelligent systems in multi-modal information analytics. MMIA 2020. Advances in Intelligent Systems and Computing, Vol. 1234. Springer. https://doi.org/10.1007/978-3-030-51556-0_111
- Huang, Y., & Zhang, Y. (2019). Financial inclusion and urban-rural income inequality: Long-run and short-run relationships. Emerging Markets Finance and Trade, 1–15. https://doi.org/10.1080/1540496X.2018.1562896
- Ibrahim, M., & Alagidede, P. (2018). Effect of financial development on economic growth in sub-Saharan Africa. Journal of Policy Modeling, 40(6), 1104–1125. https://doi.org/10.1016/j.jpolmod.2018.08.001
- Ifediora, C., Offor, K. O., Eze, E. F., Takon, S. M., Ageme, A. E., Ibe, G. I., Onwumere, J. U. J., & Read, R. (2022). Financial inclusion and its impact on economic growth: Empirical evidence from sub-Saharan Africa. Cogent Economics & Finance, 10(1), 1–27. https://doi.org/10.1080/23322039.2022.2060551
- IMF. (2020) . Financial Access Survey 2020. The International Monetary Fund.
- Ismael, D. M., & Ali, S. S. (2021). Measuring digital and traditional financial inclusion in Egypt: A new index. International Journal of Applied Research in Management and Economics, 4(2), 13–34.
- Jack, W., & Suri, T. (2014). Risk sharing and transactions cost: Evidence from Kenya’s mobile money revolution. American Economic Review, 104(1), 183–223. https://doi.org/10.1257/aer.104.1.183
- Jolliffe, I. T. (2002). Principal component analysis. Springer. https://doi.org/10.1007/b98835
- Khera, P., Ng, S., Ogawa, S., & Sahay, R. (2021). Is digital financial inclusion unlocking growth? IMF Working Paper no. 21/167, International Monetary Fund (IMF). https://doi.org/10.5089/9781513584669.001
- Kim, J. H. (2016). A study on the effect of financial inclusion on the relationship between income inequality and economic growth. Emerging Markets Finance and Trade, 52(2), 498–512. https://doi.org/10.1080/1540496X.2016.1110467
- Kim, D., Yu, J., & Hassan, M. K. (2017). Financial inclusion and economic growth in OIC countries. Research in International Business and Finance, 43(C), 1–14. https://doi.org/10.1016/j.ribaf.2017.07.178
- Klapper, L., El-Zoghbi, M., & Hess, J. (2016). Achieving the sustainable development goals: The role of financial inclusion. CGPA working paper for the united nations secretary general’s special advocate for inclusive finance for development (UNSGSA), Washington DC. https://www.cgap.org/sites/default/files/researches/documents/Working-Paper-Achieving-Sustainable-Development-Goals-Apr-2016_0.pdf.
- Law, S., & Singh, N. (2014). Does too much finance harm economic growth? Journal of Banking & Finance, 41, 36–44. https://doi.org/10.1016/j.jbankfin.2013.12.020
- Lenka, S. K. (2021). Relationship between financial inclusion and financial development in India: Is there any link? Journal of Public Affairs, e2722. https://doi.org/10.1002/pa.2722
- Lenka, S. K., & Sharma, R. (2017). Does financial inclusion spur economic growth in India? The Journal of Developing Areas, 51(3), 215–228. https://doi.org/10.1353/jda.2017.0069
- Li, C., & Wong, J. C. (2018). Financial development and inclusion in the Caribbean. IMF working paper WP/18/53, International Monetary Fund, Washington. https://www.imf.org.
- Li, J., Wu, Y., & Xiao, J. J. (2019). The impact of digital finance on household consumption: Evidence from China. Economic Modelling, 86, 317–326. https://doi.org/10.1016/j.econmod.2019.09.027
- Love, I., & Zicchino, L. (2006). Financial development and dynamic investment behaviour: Evidence from panel VAR. The Quarterly Review of Economics and Finance, 46(2), 190–210. https://doi.org/10.1016/j.qref.2005.11.007
- Lu, Z., Wu, J., Li, H., & Nguyen, D. K. (2022). Local bank, digital financial inclusion and SME financing constraints: Empirical evidence from China. Emerging Markets Finance and Trade, 58(6), 1712–1725. https://doi.org/10.1080/1540496X.2021.1923477
- Manyika, J., Lund, S., Singer, M., White, O., & Berry, C. (2016). Digital finance for all: Powering inclusive growth in emerging economies. McKinsey Global Institute.
- Maruta, A. A., Banerjee, R., & Cavoli, T. (2020). Foreign aid, institutional quality and economic growth: Evidence from the developing world. Economic Modelling, 89, 444–463. https://doi.org/10.1016/j.econmod.2019.11.008
- Mawejje, J., & Lakuma, P. (2019). Macroeconomic effects of Mobile money: Evidence from Uganda. Financial Innovation, 5(23), 1–20.
- McAfee. (2018). The economic impact of cybercrime – no slowing down. Retrieved July 28, 2022, from https://www.mcafee.com/enterprise/en-us/assets/executive-summaries/es-economic-impact-cybercrime.Pdf
- Mckinnon, R. I. (1973). Money and capital in economic development. Brookings Institution Press.
- Meifang, Y., He, D., Xianrong, Z., & Xiaobo, X. (2018). Impact of payment technology innovations on the traditional financial industry: A focus on China. Technological Forecasting and Social Change, 135, 199–207. https://doi.org/10.1016/j.techfore.2017.12.023
- Menyelim, C. M., Babajide, A. A., Omankhanlen, A. E., & Ehikioya, B. I. (2021). Financial inclusion, income inequality and sustainable economic growth in Sub-Saharan African countries. Sustainability, 13(4), 1780. https://doi.org/10.3390/su13041780
- Myovella, G., Karacuka, M., & Haucap, J. (2020). Digitalization and economic growth: A comparative analysis of Sub-Saharan Africa and OECD economies. Telecommunications Policy, 44(2), 1–12. https://doi.org/10.1016/j.telpol.2019.101856
- Nan, W. V. (2019). Mobile money and socioeconomic development: A cross-country investigation in Sub-Saharan Africa. Journal of International Technology and Information Management, 27(4), 36–65. https://scholarworks.lib.csusb.edu/jitim/vol27/iss4/3
- Nanda, K., & Kaur, M. (2016). Financial inclusion and human development: A cross-country evidence. Management and Labour Studies, 41(2), 127–153. https://doi.org/10.1177/0258042X16658734
- Ndlovu, G., & Toerien, F. (2020). The distributional impact of access to finance on poverty: Evidence from selected countries in Sub-Saharan Africa. Research in International Business and Finance, 52(C), 1–21. https://doi.org/10.1016/j.ribaf.2020.101190
- Nguyen, T. T. H. (2020). Measuring financial inclusion: A composite FI index for the developing countries. Journal of Economics and Development, 23(1), 77–99.
- Nickell, S. (1981). Biases in dynamic models with fixed effects. Econometrica, 49(6), 1417–1426. https://doi.org/10.2307/1911408
- Nizam, R., Karim, Z. A., Rahman, A. A., & Sarmidi, T. (2020). Financial inclusiveness and economic growth: New evidence using a threshold regression analysis. Economic Research-Ekonomska Istraživanja, 33(1), 1465–1484. https://doi.org/10.1080/1331677X.2020.1748508
- Omar, M. A., & Inaba, K. (2020). Does financial inclusion reduce poverty and income inequality in developing countries? A panel data analysis. Journal of Economic Structures, 9(1), 37. https://doi.org/10.1186/s40008-020-00214-4
- Ozili, P. K. (2018). Impact of digital finance on financial inclusion and stability. Borsa Istanbul Review, 18(4), 329–340. https://doi.org/10.1016/j.bir.2017.12.003
- Parks, R. W. (1967). Efficient estimation of a system of regression equations when disturbances are both serially and contemporaneously correlated. Journal of the American Statistical Association, 62(318), 500–509. https://doi.org/10.2307/2283977
- Pazarbasioglu, C., Mora, A. G., Uttamchandani, M., Natarajan, H., Feyen, E., & Saal, M. (2020). Digital Financial Services. World Bank Group.
- Peia, O., & Roszbach, K. (2015). Finance and growth: Time series evidence on causality. Journal of Financial Stability, 19, 105–118. https://doi.org/10.1016/j.jfs.2014.11.005
- Pesaran, M. H. (2004). General diagnostic tests for cross section dependence in panels. CESifo Working Paper Series No. 1229; IZA Discussion Paper No. 1240.
- Polloni Silva, E., da Costa, N., Moralles, H. F., & Neto, M. S. (2021). Does financial inclusion diminish poverty and inequality? A panel data analysis for Latin American countries. Social Indicators Research, 158(3), 889–925. https://doi.org/10.1007/s11205-021-02730-7
- Pradhan, R. P., Arvin, M., & Norman, B. M. (2015). The dynamics of information and communications technologies infrastructure, economic growth, and financial development: Evidence from Asian countries. Technology in Society, 42(42), 135–149.
- Ramkumar, G. (2017). A study on benefits of financial inclusion and cashless economy for India. EPRA International Journal of Business and Economic Review, 5(8), 182–186.
- Romer, P. M. (1986). Increasing returns and long-run growth. Journal of Political Economy, 94(5), 1002–1037. https://doi.org/10.1086/261420
- Ryman-Tubb, N. F., Krause, P., & Garn, W. (2018). How artificial intelligence and machine learning research impacts payment card fraud detection: A survey and industry benchmark. Engineering Applications of Artificial Intelligence, 76, 130–157. https://doi.org/10.1016/j.engappai.2018.07.008
- Sarafidis, V., & Robertson, D. (2009). On the impact of error cross-sectional dependence in short dynamic panel estimation. Econometrics Journal, 12(1), 62–81. https://doi.org/10.1111/j.1368-423X.2008.00260.x
- Sarma, M. (2008). Index of financial inclusion. Working Paper 215, Indian Council for Research on International Economic Relations, New Delhi. https://www.icrier.org
- Sarma, M. (2015). Measuring financial inclusion. Economics Bulletin, 35(1), 604–611.
- Schneider, M. 2018. Digitalization of Production, human capital, and organizational capital. C. Harteis. Ed., the impact of digitalization in the workplace 39–52. Springer. Professional and Practice. Professional and Practicebased Learning 21 https://doi.org/10.1007/978-3-319-63257-5_4
- Schonerwald, C., & Vernengo, M. (2016). Microfinance, financial inclusion, and the rhetoric of reaction: The evolution and limitations of microfinance in Brazil. Latin American Policy, 7(2), 356–376. https://doi.org/10.1111/lamp.12101
- Schumpeter, J. A. (1912). The theory of economic development. Harvard University Press.
- Sethi, D., & Acharya, D. (2018). Financial inclusion and economic growth linkage: Some cross country evidence. Journal of Financial Economic Policy, 10(3), 369–385. https://doi.org/10.1108/JFEP-11–2016-0073
- Sethi, D., & Sethy, S. K. (2019). Financial inclusion matters for economic growth in India. International Journal of Social Economics, 46(1), 132–151. https://doi.org/10.1108/IJSE-10-2017-0444
- Sharma, D. (2016). Nexus between financial inclusion and economic growth: Evidence from the emerging Indian economy. Journal of Financial Economic Policy, 8(1), 13–36. https://doi.org/10.1108/JFEP-01-2015-0004
- Shaw, E. S. (1973). Financial deepening in economic development. Oxford University Press.
- Shen, Y., Hu, W., & Hueng, C. J. (2021). Digital financial inclusion and economic growth: A cross-country study. Procedia Computer Science, 187, 218–223. https://doi.org/10.1016/j.procs.2021.04.054
- Siddik, M. N. A., Ahsan, T., & Kabirag, S. (2019). Does financial permeation promote economic growth? Some econometric evidence from Asian countries. Sage Open, 9(3), 1–13.
- Singh, D., & Stakic, N. (2020). Financial inclusion and economic growth nexus: Evidence from SAARC countries. South Asia Research, 41(1), 1–21. https://doi.org/10.1177/0262728020964605
- Solow, R. M. (1956). A contribution to the theory of economic growth. The Quarterly Journal of Economics, 70(1), 65–94. https://doi.org/10.2307/1884513
- Srouji, J. (2020). Digital payments, the cashless economy, and financial inclusion in the United Arab Emirates: Why is everyone still transacting in cash? Journal of Risk and Financial Management, 13(11), 1–10. https://doi.org/10.3390/jrfm13110260
- Thathsarani, U. S., Wei, J., & Samaraweera, G. R. S. R. C. (2021). Financial inclusion’s role in economic growth and human capital in South Asia: An econometric approach. Sustainability, 13(8), 4303. https://doi.org/10.3390/su13084303
- Thomas, A. E., Bhasi, M., & Chandramouli, R. (2017). Financial accessibility and economic growth- evidence from SAARC countries. Contemplations on New Paradigms in Finance, 32–52. https://www.papers.ssrn.com
- Van, L. T. H., Vo, A. T., Nguyen, N. T., & Vo, D. H. (2019). Financial Inclusion and economic growth: An International evidence. Emerging Markets Finance and Trade, 57(1), 239–263.
- von Fintel, D., & Orthofer, A. (2020). Wealth inequality and financial inclusion: Evidence from South African tax and survey records. Economic Modelling, 91(C), 568–578. https://doi.org/10.1016/j.econmod.2020.02.001
- World Bank. (2020). World development Indicator; Time-series. https://datacatalog.worldbank.org/dataset/worlddevelopment-indicators
- Wu, T.-P., Wu, H.-C., Liu, S.-B., Hsueh, H.-P., & Wang, C.-M. (2020). Causality between peer-to-peer lending and bank lending in China: Evidence from a panel data approach. Singapore Economic Review, 65(6), 1537–1557. https://doi.org/10.1142/S0217590820500332
- Yang, L., & Zhang, Y. (2020). Digital financial inclusion and sustainable growth of small and micro enterprises—evidence based on China’s new third board market listed companies. Sustainability, 12(9), 1–21. https://doi.org/10.3390/su12229625
- Yao, L., Yang, X., & Du, N. (2022). Can digital finance boost SME innovation by easing financing constraints? Evidence from Chinese GEM-listed companies. PLOS ONE, 17(3), e0264647. https://doi.org/10.1371/journal.pone.0264647
- Yin, Z., Gong, X., Guo, P., & Wu, T. (2019). What drives entrepreneurship in digital economy? Evidence from China. Economic Modelling, 82, 66–73. https://doi.org/10.1016/j.econmod.2019.09.026
- Yoko, D. (2010). Financial inclusion, poverty reduction and economic growth. World Bank. https://www.worldbank.org
- Zhang, X., Zhang, J., Wan, G., & Luo, Z. (2019). Fintech, growth, and inequality: Evidence from China’s household survey data. The Singapore Economic Review, 65(supp01), 75–93.
- Zhang, X., Zhang, J., Wan, G., & Luo, Z. (2020). Fintech, growth, and inequality: Evidence from China’s household survey data. Singapore Economic Review, 65(1), 75–93. https://doi.org/10.1142/S0217590819440028
- Zins, A., & Laurent, W. (2016). The determinants of financial inclusion in Africa. Review of Development Finance, 6(1), 46–57. https://doi.org/10.1016/j.rdf.2016.05.001