
 ?Mathematical formulae have been encoded as MathML and are displayed in this HTML version using MathJax in order to improve their display. Uncheck the box to turn MathJax off. This feature requires Javascript. Click on a formula to zoom.
Abstract
This study examines the influence of Oil Price Volatility on Banks efficiency within the BRICS countries (Brazil, Russia, India, China, and South Africa) noting the importance of the banking sector efficiency as a tool to ensure financial stability in the region. Being able to measure efficiency levels in banks determines how successful a bank is in managing its operations and achieving its goals. A sample data of 112 banks was selected using the Bank Scope database over the time interval 2003 to 2018 to inspect banking sector relative efficiency following a non-parametric methodology known as Data Envelopment Analysis (DEA). The paper applies a two-stage model to process the empirical results consisting in using the Data Envelopment Analysis (DEA) to identify the scores of banks efficiency at a first stage (Stage 1) and determining how volatility in Oil price has impact on these scores of efficiencies on a second stage (Stage 2). Findings of the study indicate that the Chinese banking system shows the highest efficiency (90%), followed by the South Africa (87%), followed by the Brazilian and Indian banking system with efficiency level of (77%), the Russian bank industry revealed the lowest efficient banking system with level of efficiency (50%).
1. Introduction
The banking industry is the main guarantor of financial system stability in any country and specifically in developing countries as it is the main channel of funds redistribution and the backbone of the economy (Jreisat et al., Citation2021; Karim et al., Citation2021; Sun et al., Citation2020). Hence, ensuring efficiency within these banks is crucial to avoid shocks to the financial industry and maintain economic growth (Aghimien et al., Citation2016). In fact, banks are the circuit used to execute monetary policy, allocate credit, transfer wealth, and act even as providers of payment services. Bank management is in charge of monitoring efficiency levels by measuring performance, this can be defined as the evaluation of various financial indicators comparing the results with the target set by management, previous performance, and peer group (Rabbani et al., Citation2022). Being able to measure efficiency levels in banks determines how successful a bank is in managing its operations and achieving its goals. In the extant literature, several models were suggested and applied to measure efficiency, some of them adopted the parametric approach, the non-parametric approaches, or even used mixed approaches.
Oil price volatility is believed to have an impact on bank efficiency in a given country and as a consequence on economic growth. In fact, increasing volatility in oil price is negatively related to economic growth since such increases generate higher inflation rates which is undesired to any economy (Awerbuch & Raphael, Citation2006). Moreover, crude oil volatility has a negative impact on exchange rate, noting that inflation, exchange rate, and many other factors are major risks to be mitigated by banks on a continuous basis to ensure bank efficiency (Ojebiyi & Wilson). In view of the above, policy makers keep a very close eye on Oil price volatility and its impact on performance within banks involved in countries that export oil (Poghosyan & Hesse, Citation2009). This topic has been researched by many scholars and practitioners for the importance of the impact Oil Price changes have on efficiency; however, despite the numerous papers investigating the factors affecting efficiency in banks, many gaps are still prevailing and are presented in the literature review.
This study focuses mainly on the gap revolving around Oil price volatility and banking efficiency, there are few studies highlighting the similar issues such as the impact of oil crisis on the banking performance. Hawaldar et al. (Citation2017) highlighted the impact of the oil crisis on the banking performance in the Kingdom of Bahrain. Whereas Abdelaziz, et al., (Citation2020), examined the oil and gas price shocks on the bank performance. Robert and Andre (Citation2020) examined the performance of Canadian banks and oil price movements. These studies mainly focus country & bank-specific variables. Our study is using cross-country panel data as a tool to illustrate the link between banking efficiency and oil price using a sample data of 112 banks, over the time interval 2003 to 2018 to inspect banking sector relative efficiency following a non-parametric methodology known as Data Envelopment Analysis (DEA). The paper applies a two-stage model to process the empirical results consisting in using the Data Envelopment Analysis (DEA) to identify the scores of banks efficiency at a first stage (Stage 1) and determining how volatility in Oil price has impact on these scores of efficiencies on a second stage (Stage 2).
While many studies inspected the impact of oil prices as an independent variable on many financial offerings and primary economic determinants; only two studies (outside the scope of Islamic banking) provided empirical evidence on the relationship between OPV-BE. Poghosyan and Hesse (Citation2009) precisely inspected Oil Price effect on bank profitability using efficiency measurements to assess profitability levels within the bank studied sample. The second paper published by Kaffash et al. (Citation2020) applied the DEA method to determine the effect of OPV on BE from 2001 to 2011 using unbalanced panel data from banks in Middle East oil exporting countries (MEOE) where macroeconomic aspects were heavily impacted by OPV.
This paper comes as an extension to previous few research adopting the same data selection technique in terms of variables to be taken into consideration over the time interval 2003–2018 for BRICS countries setting the OPV (Oil Price Volatility) as the independent variable BE (Bank Efficiency) as the dependent variable in order to provide empirical evidence on the effect of Oil price volatility on banking efficiency.
There are few studies highlighting the market reactions to oil prices changing dramatically with the level of prices and potential structural changes in oil prices using different methodologies (Baumeister & Kilian, Citation2016; Chen et al., Citation2015; Narayan & Narayan, Citation2014). Present study differs from the above studies in several ways and offers significant contribution to the existing strand of literature. The main contribution of the study is adding a brick to the existing scarce literature of the relationship between OPV on BE by deploying the DEA method in BRICS countries noting that existing studies did not investigate the topic within this region or provided numerical evidence on the level of impact of oil price volatility on Banks efficiency. In fact, a study done by Wanke et al. (Citation2018) measured banks’ efficiencies in BRICS countries without linking it to oil price volatility or taken it as the independent factor.
The aim behind focusing on BRICS countries in this paper can be summarized as follows: (1) Banks plays a very important intermediation role in reallocating capital provided by Oil fund transfers. (2) OPV may substantially affect the availability of funds of multiple industries in BRICS countries and their performance. (3) Economies in BRICS countries depend heavily on oil price yields. 4) Up to the authors knowledge, no study had measured the consequence of OPV on BE on BRICS countries and this study is the first study to shed the light on this issue.
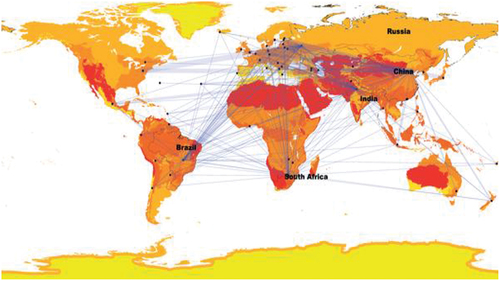
In addition, BRICS Countries worth to be investigated and examined which is that the BRICS countries have a population of more than 3 billion, which is greater than the combined population of the United States and Canada. This is a population that accounts for 42% of the world’s population. An untapped market of this size could be the most valuable hedge against globalization in the long run. They are all members of the G20, and their collective nominal GDP of USD 16 trillion represents 1/5 of the world’s gross domestic product. Overall, BRICS, however, is outperformed by the G7, and each of the BRICS nations has significantly different economic indicators and other indices. see .
Figure 1. Geographical location of BRICS countries (Measey et al., Citation2019).
Following are the remaining sections of this study. Section 2 provides a review of the literature. Our methods are described in Section 3, which includes DEA methods in two stages and regression analysis. In Section 4, we discuss the empirical results and their implications for policymaking, and in Section 5, we summarize the main findings.
2. Review of literature
The literature review is presented in two sections: (1) Bank efficiency denoted (BE) and its impact on performance within banks. (2) Oil Price Volatility denoted (OPV) and its importance as economic indicator moving other markets and its correlation with financial stability and economic growth.
2.1. Bank efficiency and performance
Many researchers have explored the importance of bank efficiency basing their studies on the most two commonly used approaches in banks efficiency measurement that are the DEA—a non-parametric approach and stochastic frontier analysis (SFA)—a parametric approach (Banker et al., Citation1984; Charnes et al., Citation1978; Kamarudin et al., Citation2016). As for the area of focus of our study which is the BRICS region, main existing researches adopted the non-parametric technique with no defined data distribution due to the possibility of having many output factors and due to the fact that the Decision making unit in a bank denoted (DMU) depends on the ability of converting inputs into outputs (Alam et al., Citation2021; Banker et al., Citation2010; Drake et al., Citation2006; Havrylchyk, Citation2006; Hussain et al., Citation2020; Isik & Hassan, Citation2003a, Citation2003b; Jreisat, Citation2020; Jreisat & Paul, Citation2010; Kao & Liu, Citation2014; Paradi et al., Citation2011; Wanke et al., Citation2018).
Other studies have adopted cross-country investigations or even mixed methodology techniques using both parametric and non-parametric methods through different stages of their research (Beccalli, Citation2007; Bonin et al., Citation2005a, Citation2005b; Casu & Girardone, Citation2009; Casu & Molyneux, Citation2003; Chortareas et al., Citation2011, Citation2012, Citation2013; Kamarudin et al., Citation2013; Pastor, Citation2002; Weill, Citation2004).
Lampe and Hilgers (Citation2015) for example conducted a document co-citation analysis and discovered that Stochastic Frontier Analysis (SFA) and DEA were mostly applied to explore the banking domain. Meanwhile, Emrouznejad and Yang (Citation2018) claimed that DEA was the second most applied method for 2015–2016 in the banking segment. Kaffash and Marra (Citation2016) reviewed the DEA techniques within financial services boundary. Essentially, this non-parametric method of DEA generates piece-wise surface of decision-making units (DMU) with the best performance, while distance from surface is measured to determine efficiency of other units (Charnes et al., Citation1978). The SFA (parametric method; Aigner et al., Citation1977; Meeusen & Den Broeck, Citation1977), with a starting point in stochastic production frontier models, presumes deviations from frontier, such as random glitches and inefficiency (Akhigbe & McNulty, Citation2003).
Kaffash et al. (Citation2020) analyzed 50 studies published from 1999 to November 2016 in order to assess the effect of environmental variables on BE based on SFA and DEA models. Main outcomes of their studies can be summarized as follows: (1) Several environment factors were validated as having impact on bank efficiency such as financial regulation & liberalization, competition level within the banking industry, acquisitions, ownership, and risk), the impact on BE was assessed using deployment of Malmquist Productivity Change Index, SFA, SDF, as well as DEA and improved DEA models. (2) Despite including many possible external factors impacting Bank performance, Oil Price volatility was not included in the list of studied variables as having impact on financial industries precisely banking or even economic growth. (3) A broad range of methods had been used to assess the effect of environmental variables on BE. Earlier work deployed the observe-and-compare technique by grouping the sample banks. In summary, the criteria of selected factors impacting bank efficiency were derived from various previous studies that focused on some of these factors.
2.2. Oil price volatility
Oil price volatility (OPV) refers to the degree of increase or decrease in the price of crude oil over a given time interval caused by demand and supply factors, deviation from anticipated limits, or even a result of some political disturbances in the countries providing the biggest share of oil exports (Poghosyan & Hesse, Citation2009). OPV’s most substantial effect has a macroeconomic dimension (stock market & monetary system). Hamilton (Citation1996) and Lee et al. (Citation1995) used asymmetric non-linear transformations of OPV, in which Hamilton (Citation2003) asserted that the linear link of economic progress with oil price is unexpected. Gisser and Goodwin (Citation1986) reported how US economy is directly impacted by an important factor that is crude oil price, while Mork et al. (Citation1994) found significantly negative link between oil price hike and gross domestic product (GDP) among seven Organization for Economic Co-operation and Development (OECD) countries (the US, Canada, the UK, France, West Germany, Japan, and Norway), except for Norway—an oil-reliant country. In assessing this link across six Asian countries, Cunado and De Gracia (Citation2005) found a significant effect of oil price on price indices and economic activity. Berument et al. (Citation2010) noted a positive and statistically significant link between OPV and economic progress in Middle East North Africa (MENA) countries—net oil exporters. Studies like Alqahtani et al. (Citation2020), concluded that the oil prices positively affect the bank indices up to the $95 per barrel mark. Ehouman (Citation2020), concluded that the if American banks are exposed to the oil market, they can influence the oil as well as financial markets. Profits are positively impacted by the positive oil price movement and if oil interrelates with the income other than the interest income then the relationship becomes stronger (Killins & Mollick, ; Lee & Lee, Citation2019; Ma et al., Citation2021). Saif-Alyousfi et al. (Citation2020), concluded that the oil and gas prices have direct impact on the banks performance especially in the GCC countries.
Many studies provided empirical evidence on the effect of OPV on inflation levels and how this inflation can harm economic output or GDP (Hamilton, Citation1983, Citation1988, Citation1996; Hooker, Citation1996, Citation1999; Huntington, Citation1998; Kahn & Hampton, Citation1990; Mork, Citation1989; Mork et al., Citation1994; Tatom, Citation1988) with some factors, such as monetary policies, business cycle, as well as interest & exchange rates. Based on co-integrated vector auto-regressive (VAR) framework for Group of Seven (G7) countries, Cologni and Manera (Citation2008) found OPV increased inflation. Using two proxies, Cunado and De Gracia (Citation2005) tested the effect of OPV on inflation, in which higher impact was noted when oil price was measured with oil price index than national real price currency, attributable to exchange rate.
Uri (Citation1996) reported a stable link between agricultural employment and OPV for 1947–1997. Similar outcome was noted by Guo and Kliesen (Citation2005) for OPV impact on US macroeconomic aspects (fixed investment, employment, & consumption) for 1984–2004. Papapetrou (Citation2001) assessed the dynamic correlations among employment, real oil prices and stock return, as well as industrial production in Greece. As a result, the effect of oil price was significant upon employment and economic activities.
Chen and Chen (Citation2007) revealed a co-integrating correlation between real exchange rate and real oil price after assessing monthly panel data retrieved for 1972–2005 from G7 countries. By employing the cash flow dividend valuation model, Jones and Kaul (Citation1996) assessed international stock market reaction towards OPV in the US, Canada, Japan, and the UK. Despite the inconclusive outcomes for the UK and Japan, the reaction of US and Canadian stock market was affected by OPV on cash flow. A positive link was noted between OPV and bank profitability when Poghosyan and Hesse (Citation2009) used ROA financial ratio to examine dynamic panel data as profitability is persistent in nature—the dependent variable.
3. Data and methodology
This study is based on a data set of a sample of 112 banks and 1,792 observations within BRICS Countries (Brazil, Russia, India, China, and south Africa) for the time interval 2003–2018. The study adopts the non-parametric data model as it presents many benefits precisely the Data Envelopment Analysis (DEA), which can handle unfixed number of output meaning that the selected sample should not follow a specific distribution or be transformed, which is not the case when using parametric methods, and can provide valuable information for the projection of the inefficient decision-making units (DMUs) on the efficient frontier (Charnes et al., Citation1985; Banker et al., Citation1984)
A two-stage methodology is applied to process the empirical results consisting in using the Data Envelopment Analysis (DEA) in order to identify the scores of banks efficiency at a first stage (Stage 1) and determining how volatility in Oil price has impact on these scores of efficiencies on a second stage (Stage 2). The scores of BE (from Stage 1) are regressed over variables that represent environmental and Oil price volatility variables.
As for Oil price data, the paper used “World Bank” database to obtain oil price and country-level aggregate data.
3.1. Stage 1: Estimating efficiency using DEA
We adopt DEA methodology in this research to compute DEA efficiency scores. The estimated efficiency score can be broken down into three categories: (1) Technical efficiency (TE), (2) pure technical efficiency (PTE) and (3) scale efficiency (SE). It was Farrell (Citation1957) work that established the DEA method of evaluating efficiency, followed by Charnes et al. (Citation1978) and Banker et al. (Citation1984).
3.2. Stage 2: Oil price volatility and efficiency of banks
Within the DEA scope, the impact of environmental factors on banking efficiency is indeed a particularly interesting topic of study (Jreisat & Bawazir, Citation2021; Zhao et al., Citation2017).
DEA was used in Stage 1 to estimate technical efficiency. Stage 2 of the analysis consisted of regressing efficiency scores against a vector of explanatory variables (x), which may have impacted efficiency. The linear conditional mean model for Efficiency (Ef) is also assumed by the OLS estimator, in addition to omitting the bounded nature of the dependent variable:
The impact of the explanatory variable cannot be assumed to be constant since the Ef is strictly bounded above and below. TE values predicted by linear specification cannot be guaranteed to range between 0 and 1 without severe constraints on x or arbitrary changes to fitted values outside the unit interval. Therefore, in order to address this issue, empirical economists have prescribed logistic correlation since it determines 0 <<1.
Equation above does not estimate directly but converts to log-odds model. Estimation was done via OLS.
The two drawbacks of the above model are: (i) Recovering E(Ef/x) from (4) is not straightforward (Papke & Wooldridge, Citation1996) and (ii) Equation above is inapt for TE boundary values of 0 and 1. As the DEA-based frontier estimator groups at least a firm to be completely efficient (Ef = 1), Equation (4) was omitted.
As part of this study, we examined the influence of other factors on technical efficiency levels so that policy makers and bankers can improve their management of regulatory policies. Therefore, the technique prescribed by Papke and Wooldridge (Citation1996) was applied.
The estimation method introduced by Papke and Wooldridge (Citation1996) eliminates the necessity of adjusting the dependent variables at extreme values of 0 or 1, in cases where the independent variables can be estimated in a straightforward manner. As a result, the predicted value of the dependent variable should range from 0 to 1. In order to implement this, we used the Bernoulli log-likelihood function:
where 0 < G (.) <1 is logit function, y_i denotes efficiency, and vector X signifies independent variable. Estimates for parameter B were gained by maximising the log-likelihood for the sample (banks) throughout 2003–2018. The maximisation problem is expressed as follows:
The estimated variance-covariance matrix is as follows: where A and B are given by
and
,
respectively, where;
,
,
and
3.3. The dependent variable “Bank efficiency”
Among the approaches that have been proposed for assessing input-output links, there are two major categories:
First, the “production approach” that defines banks as providers or producers of liquidity within loanable funds markets and that was used by many authors (Sathye (Citation2001), Neal (Citation2004), and Paul and Kourouche (Citation2008)). Alternative conceptualizations are used in this approach to describe inputs (capital costs, labour, and deposits) and outputs (financial investment & loans; Fried et al., Citation1993; Kirkwood & Nahm, Citation2006). A further way of conceptualizing inputs and outputs is as expenditures and revenues, respectively (Miller & Noulas, Citation1996).
Second, the” bank intermediation approach” derived from the intermediation role the banks occupy in any economy which is the medium point between lenders and borrowers or in other words providers of funds and demanders of these funds. As for precising which set of data will serve as the input factors and which are to serve as the output factor in this approach, it is noted that liabilities of a bank extracted from its balance sheet (which means deposit accounts belonging to providers of funds) are all set to be the input factors, and assets of a bank (which means loans granted to demanders of funds) are set to be the output factors.
The present study adopts the “intermediation approach” where the first input is denoted (X1) and non-interest expenses or the second input is denoted (X2) from one side. On a parallel side, net interest income or first output is denoted (y1), and non-interest income or second output is denoted (y2).
In order to convert nominal values into constant 2010 USD, data was deflated using the consumer price index. A correlation analysis of input–output relationships was conducted (and is presented in Table of the results section) to justify their inclusion in the model. It is vital to satisfy isotonicity demands in terms of both outputs and inputs (e.g., more inputs lead to higher outputs), according to Charnes et al. (Citation1985).
Table 1. Number of selected banks per BRICS country
Table 2. Correlation coefficients between inputs and outputs
3.4. The independent variable “Oil price volatility variable”
As for the independent variable “Oil Price”, it is defined in accordance with Korhonen and Ledyaeva (Citation2010) as the ratio between crude oil price averages over the period of 3 months and quarterly. According to US GDP deflator (2010) for Brent, Dubai, and West Texas Intermediate in US dollars per barrel. Prices for crude oil were derived from the World Bank database. Real prices reflect common shocks that all countries experience. Data on the annual oil price was used as the dependent variable. In line with Kaffash (Citation2014), OPV was used to represent oil price fluctuations in BRICS countries. In this study, the OPV was determined using monthly oil price standard deviations (Ferderer, Citation1996).
where oilpt denotes monthly oil price average in year t, while n refers to months in year t.
3.5. Environmental variables
In this study, exogenous or environmental variables were also taken into consideration as suggested by previous research, some of them are banks specific, and others are country specific (as displayed in detail in Table from the following section). It is widely recognized that many different factors determine the economic and banking conditions in a country, including inflation, capitalization, economic growth, liquidity, bank size, and credit risk (Casu & Girardone, Citation2009; Chortareas et al., Citation2012; Lozano-Vivas & Pasiouras, Citation2010; Tanna & Pasiouras, Citation2009).
Table 3. Descriptive analysis of input and output variables (in million USD)
Table 4. Descriptive statistics of variables used in cross-sectional regression
(GDP) gross domestic production can be used as a macroeconomic variable to indicate the economic situation in a particular region. Inflation is also considered to be a significant external factor that affects bank efficiency (Staikouras and Wood, Citation2003; Perry Citation1992). Our model includes the consumer price index growth rate (lnINFL) as a control variable to account for macroeconomic risk. Depending on how inflation rates are anticipated, bank performance may be positively affected if banks can revise interest rates, accordingly, which leads to a higher and faster increase in revenue compared to cost increases.
Furthermore, the four bank-specific variables considered in this study are:
1 – Liquidity Assets ratio (LIQ), noting that high liquidity ratio ensures lower liquidity risk or possibility of fire asset sales (Hasan & Marton, Citation2003).
2 – Capitalisation (EQT), which is the ratio of equity to capital (high ratio = low bank risk; Kishan & Opiela, Citation2000; Van den Heuvel, Citation2002).
3 – Loan reserve ratio (% of total gross loan), and Bank size (SIZE) and is formulated as a ratio of loan loss reserves to total loan portfolios (greater values track higher risk portfolios; Kashyap & Stein, Citation1995).
4. Results and discussion
In this section, the detailed results of the study are presented starting with the sample information in Table below:
Table indicates that the isotonicity requirement has been met as inputs and outputs exhibited significantly positive correlation coefficients. Table detects low levels of multicollinearity between the factors included which means no variable should be omitted and low redundancy as indicated by the high input-output correlations and the low correlations within inputs (outputs).
Table summarizes input and output variances over the study period. Net interest expense had a minimum outcome of USD 0.1 million compared to a maximum outcome of USD 47,840 million, noting that the average amounted USD 22,455 million and finally a USD 5,773 million attributed to standard deviation. Due to the long data period across all BRICS countries as well as value-sensitive DEA, there were high standard deviations and variation among the variables, proving heterogeneity.
Presenting the results of Table , the total assets for the study period were reported as 3.05–14.91 based on SIZE, whereas the average inflation rate was 7.16%. EQT is expressed in equity capital and total assets ratio of the bank. The mean value of the capital asset ratio is 10.22%. EQT was 0.58 million US dollars, whereas NLP was 69.75 million US dollars, whereas the highest and lowest values were 0.01 million US dollars. In both cases, these values represented the variance in the loan loss reserve ratio as a percentage of total gross loans during the study period. OPV averaged 8.86% during the study period. A correlation matrix for all the variables is shown in Table . All these variables exhibit significant correlations at the 1% level.
Table 5. Correlation coefficient matrix between DEA stage-2 variables
4.1. Stage 1: DEA of bank efficiency results
As shown in Table , Stage 1 results (DEA) are summarized. During the sample period, the efficiency scores exhibited an escalating pattern from 2003 to 2018, with some fluctuations. The mean efficiency score for banks in the study period of BRICS countries was 0.76; this translates to an increase in banking efficiency of 0.24 (24%) as full efficiency was not achieved due to several factors, including fluctuations brought about by the global financial crisis at that time. Thus, according to this result, banks are able to save up to 24% in input during business operations if they are able to maintain constant output. Building up on these results, it can be deducted that the BRICS countries’ banks performed relatively well over the period 2003–2018. It is, however, necessary boost efficiency within the banking system in order to improve its performance. This situation is probably due to the existence of numerous unsolved BRICS banks after the financial crisis of 2008–2012 (see, Figures below).
Figure 2. Yearly efficiency level in the BRICS banking industry.
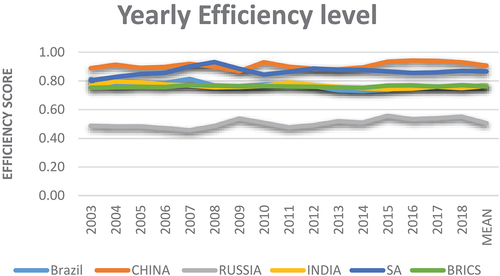
Figure 3. Technical efficiency (TE), Pure efficiency (PE) and scale efficiency (SE) of BRICS banks in the period of 2003–2018.
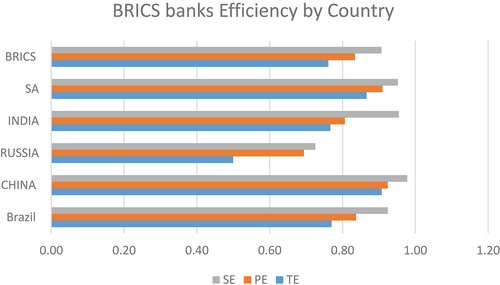
Table 6. Bank efficiency BRICS countries 2003–2018
There were some fluctuations in the Brazilian banks during the period covered by the study. This average of 0.81 was achieved in 2003, decreased to 0.76 in 2004 and returned to 0.81 in 2007, then decreased during the global financial crisis (GFC) to 0.77 and 0.76 in 2008 and 2009, respectively. Bank efficiency scores were the lowest in 2013 and 2014 (0.73% and 0.74%) and then improved to 0.76 in 2018. China’s banks averaged the highest in terms of banking efficiency, amongst the five BRICS countries from 2003 to 2018. Another deduction is that efficiency averages has followed an increasing trend through years, especially, in 2018 where Chinese banks were the more efficient with a positive marge of 0.93. These efficiency averages in Chinese banks decreased lightly during the GFC but increased to 0.93 by 2010.
India’s banks had on average an efficiency of 0.77 in 2003. In addition, the banks’ efficiency was relatively good during the study period of 0.77 and remained the same throughout the study. Accordingly, for the year 2004, banks had a score of 0.80 and were ranked third in efficiency behind only Chinese banks (0.91) and South African banks (0.83). Russia’s banking system had a rather low efficiency in 2003 at only 0.49, increasing in subsequent years, to 0.51 in 2009, but banking efficiency increased passing along the sample period for the Russian banks and increased to 0.56 by 2015. Since 2003, the average efficiency of South African (SA) banks has increased, from 0.80 to 0.93 in 2003 and 2008, respectively, then a decrease in 2009 and 2010 during the global financial crisis, the efficiency level had decreased to 0.88 and 0.87 between 2011 and 2018, when the efficiency of South Africa banks slightly fluctuated between 2011 and 2018 and reached 0.87 in 2018.
In addition, the study results revealed that each country has a different level of banking efficiency. Based on our analysis, the banking systems of each country in 2003 were ranked according to their efficiency as follows: The Chinese banking system was rated the most efficient with an average efficiency of 0.89%. For the same year 2003, Brazil was ranked second with an average efficiency of 0.81%, followed by South African banks with an average efficiency of 0.80%. The fourth ranked bank was the Indian bank with an efficiency score of 0.77% and the least efficient was the Russian bank with a score of 0.49%.
Throughout the sample period of the study, we observe that the global financial crisis period from 2008 to 2009 affected the banks, leading to a decrease in the banking system within all countries except for Russia. The efficiency of Brazilian banks was 0.77 and 0.76, respectively. There were Chinese banks which had efficiencies of 0.91 and 0.87 during the GFC whereas Russian banks had efficiencies of 0.49 and 0.54 and Indian banks efficiency level remained unchanged. Finally, the South African banking system decreased from 0.93 to 0.88 during the same period.
Table presents the efficiency level for the sample period (TE PE and SE). According to our analysis of TE, PE, and SE (0.90, 0.92, 0.98), the Chinese banking system was the most efficient and effective when compared to the other BRICS countries. With levels of efficiency of 0.87, 0.91, and 0.95, South African banks were ranked second. As for banks, Brazil and India ranked third in comparison with BRICS countries as their technical efficiency scores were 0.77 for both countries, their Pure Technical Efficiency scores were 0.84 and 0.81, and their Scale Efficiency scores were 0.92 and 0.95. Overall, the efficiency level for BRICS countries decreased during the sample period, especially during the period following the GFC. Comparing the sample period of BRICS countries, Russian banks displayed the lowest efficiency level, while Chinese banks produced the best performance efficiency scores. Results of the analysis of the BRICS countries’ levels of efficiency demonstrate a consistent improvement since 2003 (average 0.75 level of efficiency for BRICS countries), and 0.83 and 0.91, respectively, for PE and SC countries (see figures 4 and 5).
Table 7. Technical efficiency (TE), Pure efficiency (PE) and scale efficiency (SE) of BRICS banks in the period of 2003–2018
Our results are in line with other studies conducted on the efficiency of BRICS countries, what Wanke et al. (Citation2018) found was that the level of efficiency fluctuated between 0.4 and 0.9 and appeared to have pretty much stagnated over these periods. Countries tend to demonstrate similar levels of efficiency. In contrast, Chinese banks have tendency to generate better efficiency scores, while Brazilian banks have tendency to result in dispersed scores. Furthermore, banks in China enjoy a long-standing monopoly on the market, which has resulted in an increase in their efficiency (see, Shi & Zou, Citation2016). The results are in line with our finding that Chinese banks had the highest level of efficiency among the BRICS country banks, and the level of efficiency as shown in Table indicated the level was between 0.50% and 0.90% for the sample period. As compared with the other BRICS countries, China’s banking industry is still quite fragmented. There may be differences in bank efficiency within each country influenced by socioeconomic, demographic, and regulatory factors. A significant body of research has examined context-dependent effects on bank efficiency.
4.2. Stage 2 bank efficiency and oil price volatility results
In Stage 2 DEA, banking efficiency scores were regressed against alternative proxies for oil price volatility (OPV), as well as country- and bank-specific variables described in Section 5. Table lists the statistical tests deployed in Stage 2 DEA, where the estimated banking efficiency scores were regressed against a vector of explanatory variables that may affect the banking efficiency scores. Our results finding which is in line with our priors and the academic literature. As a result, banking efficiency had a negative link with OPV.
Table 8. Results of the second stage regression (GLM) and (OLS) for the BRICS country banks
The statistical significance at 1% level displayed in Table explains the effect of inflation on banking efficiency in BRICS countries. The estimated coefficient for GDP is negative and statistically significant at 1% level; signifying the negative link between economic progress and banking efficiency, which agrees with outcomes reported in (Johnes et al., Citation2014; Poghosyan & Hesse, Citation2009).
As for credit risk indicator, LNP displayed a significantly negative effect on banking efficiency. In fact, banks with lower ratios of loan loss reserves to total loans appeared to display better efficiency. Loan loss reserves denote the anticipated losses by bank managers, while higher LNP reflects the higher fraction of assets placed by banks for potential loan repayment defaults.
Referring to Table , SIZE had a significantly positive impact on banking efficiency, signifying higher banking efficiency with larger bank assets. According to Kaffash et al. (Citation2020) and Olson and Zoubi (Citation2008), since bigger banks can alter their output scale and optimal mix, they become more efficient than smaller banks. The positive SIZE-BE correlation is in agreement with results reported in several prior studies (Hauner, Citation2005; Kosmidou & Zopounidis, Citation2008; Spathis et al., Citation2002; Sufian, Citation2009).
5. Conclusions and recommendations
The two-stage DEA was used in this paper to evaluate the impact of OPV on BE within the context of BRICS countries from 2003 to 2018, mainly to define the country- and bank-specific factors of BE with the use of balanced panel data. This study first assessed the efficiency of 112 banks over 16-year period, and later investigated the effect of oil price volatility PV on banking efficiency.
We applied the dynamic panel data approach in this study and we examined the influence of other factors on technical efficiency levels so that policy makers and bankers can improve their management of regulatory policies. Therefore, the technique prescribed by Papke and Wooldridge (Citation1996) was applied. The estimation method introduced by Papke and Wooldridge (Citation1996) eliminates the necessity of adjusting the dependent variables at extreme values of 0 or 1, in cases where the independent variables can be estimated in a straightforward manner. As a result, the predicted value of the dependent variable should range from 0 to 1. To implement this, we used the Bernoulli log-likelihood function. We included the effect of financial crisis in our analysis by subdividing the full period into two sub-periods: before crisis and after crisis periods. We also considered the effect of internal (bank-specific characteristics) as well as external bank factors (macroeconomic, regulatory, and institutional variables).
In summary, the findings of the study suggest that the overall efficacy of the banks in the BRCIS has received 76% efficiency which is considered as good. It implies that with the consistency in the output the banks are expected to save up to 24% in operating cost. Therefore, the overall efficiency of the banks in BRICS countries can be considered as good during the period.
Oil price volatility affected BE in BRICS countries with inflation and economic progress serving as the primary indirect drivers. Considering credit risk indicator, LNP exemplified a significantly negative effect on BE. Evidently, banking efficiency was better with lower ratio of loan loss reserves to total loans. Expected loss by banks were reflected by loan loss reserves, while higher LNP depicted larger fraction of bank assets put aside for loan repayment defaults. High loss of loans led to lower BE, particularly among banks in BRICS countries that heavily rely on loan generation. The findings of the study have several implications for the bakers, government, customers, and portfolio investors. It is expected to help the bankers in making key managerial decisions to increase the investors wealth. Governments in BRICS countries can use it as policy documents to measure the possible changes in banks efficiency due to change in oil prices. However, it is recommended for future research and empirical studies to provide detailed investigation of impact of oil price changes on baking efficiency throughout different sub-periods, in order to capture the dynamic alteration in reaction of banking sector performance to potential structural breaks and changes in oil price behavior.
Author contributions
Conceptualization, A.J., M.R.R. and S.A.; methodology, A.J.; software, A.J.; formal analysis, A.J. M.R.R.; resources, A.J. S.A., S.O, and W.B.; data collection, A.J. S.A.; writing—original draft preparation, A.J., M.R.R., S.O. and S.A.; writing—review and editing, A.J., W.B., M.R.R., S.O. And S.A.; supervision, A.J., And S.A.; All authors have read and agreed to the published version of the manuscript. Revision; MRR.
Disclosure statement
No potential conflict of interest was reported by the author(s).
Additional information
Funding
Notes on contributors

Ammar Jreisat
Dr. Ammar Jreisat holds a Ph.D. in Finance and Economic from Western Sydney University, Sydney, Australia. Dr. Ammar Jreisat received his MSC. in Finance and Banking Science from Jordan in 2003. Currently, he is serving as an Assistant Professor at Department of Economics and Finance, University of Bahrain, Kingdom of Bahrain. Dr. Ammar Jreisat serves as Associate Editor of the International Journal of Economics and Business Research, also he serving as a reviewer in various international journals. In 2016, Dr. Jreisat received award travel grant awardees from the Middle East Economic Association (MEEA) and the Economic Research Forum (ERF) travel grant at MEEA/ASSA conference in San Francisco, USA for his scientific research.
Mustafa Raza Rabbani
Dr. Mustafa Raza Rabbani holds a Ph.D. in Banking and Financial Services from the prestigious Jamia Millia Islamia, University, New Delhi, India. His research areas are Financial Technology (Fintech) and its potential application in Islamic finance and banking industry, Integrating Halal economy with the Islamic finance and exploring the possibilities of sharia compliant cryptocurrency. Dr. Rabbani is a passionate researcher and in the last 2 years he has published more than 30 peer-reviewed research papers in the international journal of repute published by Emerald, Elsevier, Springer, Indesrscience, and indexed in Scopus, Web of Science (WoS) and ABDC listed etc.
Sara Omran
Dr. Sara Omran an Assistant Professor at Department of Economics and Finance and, College of Business Administration, the American University of the Middle East.
Somar Al-Mohamad
Dr. Somar Almohamad holds a Ph.D. in Finance from Western Sydney University, Sydney, Australia. Currently, he is serving as an Assistant Professor at Department of Economics and Finance and Department Chair, Finance and Economics, College of Business Administration, the American University of the Middle East. Somar Al-Mohamad research focuses on Financial Integration, Portfolio Diversification, Cryptocurrencies.
Walid Bakry
Dr. Walid Bakry Dr Walid Bakry is lecturer in finance and an Academic Course Advisor (Post-graduate: Economics and Finance programs) at the Western Sydney University (WSU). Walid holds a PhD in Finance from WSU, a Master of Science in Finance from Louisiana State University and an MBA from Alexandria University. He also held an Adjunct academic position internationally. Moreover, Dr. Bakry has conducted multiple training and workshops in Australia and provided financial consultation for various private organizations overseas.
References
- Aghimien, P. A., Kamarudin, F., Hamid, M., & Noordin, B. (2016). Efficiency of gulf cooperation council banks: Empirical evidence using data envelopment analysis. Review of International Business and Strategy, 26(1), 118–20. https://doi.org/10.1108/RIBS-11-2013-0111
- Aigner, D., Lovell, C. K., & Schmidt, P. (1977). Formulation and estimation of stochastic frontier production function models. Journal of Econometrics, 6(1), 21–37. https://doi.org/10.1016/0304-4076(77)90052-5
- Akhigbe, A., & McNulty, J. E. (2003). The profit efficiency of small US commercial banks. Journal of Banking & Finance, 27(2), 307–325. https://doi.org/10.1016/S0378-4266(01)00250-3
- Alam, M., Rabbani, M. R., Tausif, M. R., & Abey, J. (2021). Banks’ performance and economic growth in India: A panel cointegration analysis. Economies, 9(1), 38. https://doi.org/10.3390/economies9010038
- Alqahtani, F., Samargandi, N., & Kutan, A. M. (2020). The influence of oil prices on the banking sector in oil-exporting economies: Is there a psychological barrier? International Review of Financial Analysis, 69, 101470. https://doi.org/10.1016/j.irfa.2020.101470
- Awerbuch, S., & Raphael, S. 2006. Exploiting the oil- GDP effect to support renewables deployment. Energy Policy, 34(17), 2805–2819. crossref. https://doi.org/10.1016/j.enpol.2005.04.020.
- Banker, R. D., Chang, H., & Lee, S.-Y. (2010). Differential impact of Korean banking system reforms on bank productivity. Journal of Banking & Finance, 34(7), 1450–1460. https://doi.org/10.1016/j.jbankfin.2010.02.023
- Banker, R. D., Charnes, A., & Cooper, W. W. 1984. Some models for estimating technical and scale inefficiencies in data envelopment analysis. Manag. Sci, 30(9), 1078–1092. CrossRef. https://doi.org/10.1287/mnsc.30.9.1078.
- Baumeister, C., & Kilian, L. (2016). Forty years of oil price fluctuations: Why the price of oil may still Surprise us. Journal of Economic Perspectives, 30(1), 139–160. https://doi.org/10.1257/jep.30.1.139
- Beccalli, E. (2007). Does IT investment improve bank performance? Evidence from Europe. Journal of Banking & Finance, 31(7), 2205–2230. https://doi.org/10.1016/j.jbankfin.2006.10.022
- Berument, M. H., Ceylan, N. B., & Dogan, N. (2010). The impact of oil price shocks on the economic growth of selected MENA countries. The Energy Journal, 31(1), 149–176.
- Bonin, J. P., Hasan, I., & Wachtel, P. (2005a). Bank performance, efficiency and ownership in transition countries. Journal of Banking & Finance, 29(1), 31–53. https://doi.org/10.1016/j.jbankfin.2004.06.015
- Bonin, J. P., Hasan, I., & Wachtel, P. (2005b). Privatization matters: Bank efficiency in transition countries. Journal of Banking & Finance, 29(8–9), 2155–2178. https://doi.org/10.1016/j.jbankfin.2005.03.012
- Casu, B., & Girardone, C. (2009). Testing the relationship between competition and efficiency in banking: A panel data analysis. Economics Letters, 105(1), 134–137. https://doi.org/10.1016/j.econlet.2009.06.018
- Casu, B., & Molyneux, P. (2003). A comparative study of efficiency in European banking. Applied Economics, 35(17), 1865–1876. https://doi.org/10.1080/0003684032000158109
- Charnes, A., Cooper, W. W., Golany, B., Seiford, L., & Stutz, J. (1985). Foundations of data envelopment analysis for Pareto-Koopmans efficient empirical production functions. Journal of Econometrics, 30(1–2), 91–107. https://doi.org/10.1016/0304-4076(85)90133-2
- Charnes, A., Cooper, W. W., & Rhodes, E. (1978). Measuring the efficiency of decision making units. European Journal of Operational Research, 2(6), 429–444. https://doi.org/10.1016/0377-2217(78)90138-8
- Chen, -S.-S., & Chen, H.-C. (2007). Oil prices and real exchange rates. Energy Economics, 29(3), 390–404. https://doi.org/10.1016/j.eneco.2006.08.003
- Chen, W., Huang, Z., & Yi, Y. (2015). Is there a structural change in the persistence of WTI-Brent oil price spreads in the post-2010 period? Economic Modelling, 50, 64–71. https://doi.org/10.1016/j.econmod.2015.06.007
- Chortareas, G. E., Garza-García, J. G., & Girardone, C. (2011). Financial deepening and bank productivity in Latin America. The European Journal of Finance, 17(9–10), 811–827. https://doi.org/10.1080/1351847X.2010.538512
- Chortareas, G. E., Girardone, C., & Ventouri, A. (2012). Bank supervision, regulation, and efficiency: Evidence from the European Union. Journal of Financial Stability, 8(4), 292–302. https://doi.org/10.1016/j.jfs.2011.12.001
- Chortareas, G. E., Girardone, C., & Ventouri, A. (2013). Financial freedom and bank efficiency: Evidence from the European Union. Journal of Banking & Finance, 37(4), 1223–1231. https://doi.org/10.1016/j.jbankfin.2012.11.015
- Cologni, A., & Manera, M. (2008). Oil prices, inflation and interest rates in a structural cointegrated VAR model for the G-7 countries. Energy Economics, 30(3), 856–888. https://doi.org/10.1016/j.eneco.2006.11.001
- Cunado, J., & De Gracia, F. P. (2005). Oil prices, economic activity and inflation: Evidence for some Asian countries. The Quarterly Review of Economics and Finance, 45(1), 65–83. https://doi.org/10.1016/j.qref.2004.02.003
- Drake, L., Hall, M. J. B., & Simper, R. (2006). The impact of macroeconomic and regulatory factors on bank efficiency: A non-parametric analysis of Hong Kong’s banking system. Journal of Banking & Finance, 30(5), 1443–1466. https://doi.org/10.1016/j.jbankfin.2005.03.022
- Ehouman, Y. A. (2020). Volatility transmission between oil prices and banks’ stock prices as a new source of instability: Lessons from the United States experience. Economic Modelling, 91, 198–217. https://doi.org/10.1016/j.econmod.2020.06.009
- Emrouznejad, A., & Yang, G. (2018). A survey and analysis of the first 40 years of scholarly literature in DEA: 1978–2016. Socio-Economic Planning Sciences, 61, 4–8. https://doi.org/10.1016/j.seps.2017.01.008
- Farrell, M. J. (1957). The measurement of productive efficiency. Journal of Royal Statistical Society Association, 120(3), 253–281. https://doi.org/10.2307/2343100
- Ferderer, J. P. (1996). Oil price volatility and the macroeconomy. Journal of Macroeconomics, 18(1), 1–26. https://doi.org/10.1016/S0164-0704(96)80001–2
- Fried, H. O., Lovell, C. A. K., & Eeckaut, P. V. (1993). Evaluating the performance of US credit unions. Journal of Banking & Finance, 17(2–3), 251–265. https://doi.org/10.1016/0378-4266(93)90031-8
- Gisser, M., & Goodwin, T. H. (1986). Crude oil and the macroeconomy: Tests of some popular notions: Note. Journal of Money, Credit and Banking, 18(1), 95–103. https://doi.org/10.2307/1992323
- Guo, H., & Kliesen, K. L. (2005). Oil price volatility and US macroeconomic activity. Federal Reserve Bank of St. Louis Review, 87(6), 669–684.
- Hamilton, J. D. (1983). Oil and the macroeconomy since World War II. Journal of Political Economy, 91(2), 228–248. https://doi.org/10.1086/261140
- Hamilton, J. D. (1988). Are the macroeconomic effects of oil-price changes symmetric? A comment. Carnegie-Rochester Conference Series on Public Policy, 28(1), 369–378. https://doi.org/10.1016/0167-2231(88)90031-0
- Hamilton, J. D. (1996). This is what happened to the oil price-macroeconomy relationship. Journal of Monetary Economics, 38(2), 215–220. https://doi.org/10.1016/S0304-3932(96)01282-2
- Hamilton, J. D. (2003). What is an oil shock? Journal of Econometrics, 113(2), 363–398. https://doi.org/10.1016/S0304-4076(02)00207-5
- Hasan, I., & Marton, K. (2003). Development and efficiency of the banking sector in a transitional economy: Hungarian experience. Journal of Banking & Finance, 27(12), 2249–2271. https://doi.org/10.1016/S0378-4266(02)00328-X
- Hauner, D. (2005). Explaining efficiency differences among large German and Austrian banks. Applied Economics, 37(9), 969–980. https://doi.org/10.1080/00036840500081820
- Havrylchyk, O. (2006). Efficiency of the Polish banking industry: Foreign vs. domestic banks. Journal of Banking & Finance, 30(7), 1975–1996. https://doi.org/10.1016/j.jbankfin.2005.07.009
- Hawaldar, I. T., Rohith, B., Pinto, P., & TM, R. (2017). The impact of oil price crisis on financial performance of commercial banks in Bahrain. Banks and Bank Systems, 12(4), 4–16. https://doi.org/10.21511/bbs.12(4).2017.01
- Hooker, M. A. (1996). What happened to the oil price-macroeconomy relationship? Journal of Monetary Economics, 38(2), 195–213. https://doi.org/10.1016/S0304-3932(96)01281-0
- Hooker, M. A. (1999). Oil and the macroeconomy revisited. Macroeconomics eJournal.
- Huntington, H. G. (1998). Crude oil prices and US economic performance: Where does the asymmetry reside? The Energy Journal, 19(4), 107–132. https://doi.org/10.5547/0195-6574-EJ-Vol19-No4-5
- Hussain, H. I., Kamarudin, F., Mohamad Anwar, N. A., Nassir, A. M., Sufian, F., & Tan, K. M. (2020). Impact of country’s governance dimensions on bank revenue efficiency: overview on middle east, southeast asia, and south Asia countRIES. Transformations in Business & Economics, 19(1), 191–228. https://www.transformations.knf.vu.lt/49/article/impa
- Isik, I., & Hassan, M. K. (2003a). Financial disruption and bank productivity: The 1994 experience of Turkish banks. The Quarterly Review of Economics and Finance, 43(2), 291–320. https://doi.org/10.1016/S1062-9769(02)00194-1
- Isik, I., & Hassan, M. K. (2003b). Financial deregulation and total factor productivity change: An empirical study of Turkish commercial banks. Journal of Banking & Finance, 27(8), 1455–1485. https://doi.org/10.1016/S0378-4266(02)00288-1
- Johnes, J., Izzeldin, M., & Pappas, V. (2014). A comparison of performance of Islamic and conventional banks 2004–2009. Journal of Economic Behavior & Organization, 103(Suppl.), S93–S107. https://doi.org/10.1016/j.jebo.2013.07.016
- Jones, C. M., & Kaul, G. (1996). Oil and the stock markets. The Journal of Finance, 51(2), 463–491. https://doi.org/10.1111/j.1540-6261.1996.tb02691.x
- Jreisat, A. (2020). Credit risk, economic growth and profitability of banks. International Journal of Economics and Business Research, 20(2), 152–167. https://doi.org/10.1504/IJEBR.2020.109150
- Jreisat, A., & Bawazir, H. (2021). Determinants of banks profitability in the middle east and North Africa region. The Journal of Asian Finance, Economics and Business. Korea Distribution Science Association, 8(6), 701–711. https://doi.org/10.13106/JAFEB.2021.VOL8.NO6.0701
- Jreisat, A., & Paul, S. (2010). Banking efficiency in the Middle East: A survey and new results for the Jordanian banks. International Journal of Applied Business and Economic Research, 8(2)191–209, 2010, https://ssrn.com/abstract=1951860
- Jreisat, A., Rabbani, M. R., Hatamleh, Z. M., & Grewal, H. (2021, December). COVID-19: A closer look at the menabanking sector. In 2021 International Conference on Decision Aid Sciences and Application (DASA) (pp. 344–349). IEEE.
- Kaffash, S. (2014), Oil price and bank performance in the Middle Eastern oil exporting countries. [ Doctoral thesis, Brunel University].
- Kaffash, S., Aktas, E., & Tajik, M. (2020). The impact of oil price changes on efficiency of banks: An application in the Middle East oil exporting countries using SORM-DEA. RairoOperations Research, 54(3), 719–748. https://doi.org/10.1051/ro/2019009
- Kaffash, S., & Marra, M. (2016). Data envelopment analysis in financial services: A citations network analysis of banks, insurance companies and money market funds. Annals of Operations Research, 253(1), 307–344. https://doi.org/10.1007/s10479-016-2294-1
- Kahn, G. A., & Hampton, J. R. (1990). Possible monetary policy responses to the Iraqi oil shock. Economic Review - Federal Reserve Bank Kansas City, 75(6), 19–32.
- Kamarudin, F., Amin NORDIN, B. A., & Nasir, A. M. (2013). PRICE EFFICIENCY AND RETURNS TO SCALE OF BANKING SECTOR IN GULF COOPERATIVE COUNCIL COUNTRIES: EMPIRICAL EVIDENCE FROM ISLAMIC AND CONVENTIONAL BANKS. Economic Computation & Economic Cybernetics Studies & Research, 47(3).
- Kamarudin, F., Sufian, F., & Nassir, A. M. (2016). Global financial crisis, ownership and bank profit efficiency in the Bangladesh’s state owned and private commercial banks. Contaduría y administración, 61(4), 705–745. https://doi.org/10.1016/j.cya.2016.07.006
- Kao, C., & Liu, S.-T. (2014). Multi-period efficiency measurement in data envelopment analysis: The case of Taiwanese commercial banks. Omega, 47, 90–98. https://doi.org/10.1016/j.omega.2013.09.001
- Karim, S., Akhtar, M. U., Tashfeen, R., Raza Rabbani, M., Rahman, A. A. A., & AlAbbas, A. (2021). Sustainable banking regulations pre and during coronavirus outbreak: The moderating role of financial stability. Economic Research-Ekonomska Istraživanja, 1–18. https://doi.org/10.1080/1331677X.2021.1993951
- Kashyap, A. K., & Stein, J. C. (1995), The impact of monetary policy on bank balance sheets, in: Carnegie-Rochester Conference Series on Public Policy, Elsevier.
- Killins, R. N., & Mollick, A. V.,Performance of Canadian banks and oil price movements, Research in International Business and Finance, 54(2020), (101258), ISSN, . https://doi.org/10.1016/j.ribaf.2020.101258
- Kirkwood, J., & Nahm, D. (2006). Australian banking efficiency and its relation to stock returns. Economic Record, 82(258), 253–267. https://doi.org/10.1111/j.1475-4932.2006.00338.x
- Kishan, R. P., & Opiela, T. P. (2000). Bank size, bank capital, and the bank lending channel. Journal of Money, Credit and Banking, 32(1), 121–141. https://doi.org/10.2307/2601095
- Korhonen, I., & Ledyaeva, S. (2010). Trade linkages and macroeconomic effects of the price of oil. Energy Economics, 32(4), 848–856. https://doi.org/10.1016/j.eneco.2009.11.005
- Kosmidou, K., & Zopounidis, C. (2008). Measurement of bank performance in Greece. South-Eastern Europe Journal of Economics, 6(1), 79–95.
- Lampe, H. W., & Hilgers, D. (2015). Trajectories of efficiency measurement: A bibliometric analysis of DEA and SFA. European Journal of Operational Research, 240(1), 1–21. https://doi.org/10.1016/j.ejor.2014.04.041
- Lee, C. C., & Lee, C. C. (2019). Oil price shocks and Chinese banking performance. Do Country Risks matter?.Energy Economics, 77, 46–53. https://doi.org/10.1016/j.eneco.2018.01.010
- Lee, K., Ni, S., & Ratti, R. A. (1995). Oil shocks and the macroeconomy: The role of price variability. The Energy Journal, 16(4), 39–56. https://doi.org/10.5547/0195-6574-EJ-Vol16-No4-2
- Lozano-Vivas, A., & Pasiouras, F. (2010). The impact of non-traditional activities on the estimation of bank efficiency: International evidence. Journal of Banking & Finance, 34(7), 1436–1449. https://doi.org/10.1016/j.jbankfin.2010.01.006
- Ma, Y., Zhang, Y., & Ji, Q. (2021). Do oil shocks affect Chinese bank risk? Energy Economics, 105166. https://doi.org/10.1016/j.eneco.2021.105166
- Measey, J., Visser, V., Dgebuadze, Y., Inderjit, L. B., Li, B., Dechoum, M., Ziller, S. R., & Richardson, D. M. (2019). The world needs BRICS countries to build capacity in invasion science. PLOS Biology, 17(9), e3000404. https://doi.org/10.1371/journal.pbio.3000404,https://journals.plos.org/plosbiology/article?id=10.1371/journal.pbio.3000404
- Meeusen, W., & Den Broeck, J. V. (1977). Efficiency estimation from Cobb-Douglas production functions with composed error. International Economic Review, 18(2), 435–444. https://doi.org/10.2307/2525757
- Miller, S. M., & Noulas, A. G. (1996). The technical efficiency of large bank production. Journal of Banking & Finance, 20(3), 495–509. https://doi.org/10.1016/0378-4266(95)00017-8
- Mork, K. A. (1989). Oil and the macroeconomy when prices go up and down: An extension of Hamilton’s results. Journal of Political Economy, 97(3), 740–744. https://doi.org/10.1086/261625
- Mork, K. A., Olsen, Ø., & Mysen, H. T. (1994). Macroeconomic responses to oil price increases and decreases in seven OECD countries. The Energy Journal, 15(4), 19–35.
- Narayan, P. K., & Narayan, S. (2014). Psychological oil price barrier and firm returns. Journal of Behavioral Finance, 15(4), 318–333. https://doi.org/10.1080/15427560.2014.968719
- Neal, P. (2004). X-efficiency and productivity change in Australian banking. Australian Economic Papers, 43(2), 174–191. https://doi.org/10.1111/j.1467-8454.2004.00223.x
- Ojebiyi, A., & Wilson, D. O. (2011). Exchange rate volatility: An analysis of the relationship between the Nigerian Naira, oil prices and US dollar. Master of International Management.
- Olson, D., & Zoubi, T. A. (2008). Using accounting ratios to distinguish between Islamic and conventional banks in the GCC region. The International Journal of Accounting, 43(1), 45–65. https://doi.org/10.1016/j.intacc.2008.01.003
- Papapetrou, E. (2001). Oil price shocks, stock market, economic activity and employment in Greece. Energy Economics, 23(5), 511–532. https://doi.org/10.1016/S0140-9883(01)00078-0
- Papke, L. E., & Wooldridge, J. M. (1996). Econometric methods for fractional response variables with an application to 401(k) plan participation rates. Journal of Applied Econometrics, 11(6), 619–632. https://doi.org/10.1002/(SICI)1099-1255(199611)11:6<619::AID-JAE418>3.0.CO;2-1
- Paradi, J. C., Rouatt, S., & Zhu, H. (2011). Two-stage evaluation of bank branch efficiency using data envelopment analysis. Omega, 39(1), 99–109. https://doi.org/10.1016/j.omega.2010.04.002
- Pastor, J. M. (2002). Credit risk and efficiency in the European banking system: A three-stage analysis. Applied Financial Economics, 12(12), 895–911. https://doi.org/10.1080/09603100110065873
- Paul, S., & Kourouche, K. (2008). Regulatory policy and the efficiency of the banking sector in Australia. Australian Economic Review, 41(3), 260–271. https://doi.org/10.1111/j.1467-8462.2008.00504.x
- Perry, P. (1992). Do banks gain or lose from inflation. Journal of Retail Banking, 14(2), 25–40.
- Poghosyan, T., & Hesse, H. (2009), Oil prices and bank profitability: Evidence from major oil-exporting countries in the Middle East and North Africa. https://www.imf.org/external/pubs/ft/wp/2009/wp09220.pdf/ (accessed 6 February 2017)
- Rabbani, M. R., Kayani, U., Bawazir, H. S., & Hawaldar, I. T. (2022). A commentary on emerging markets banking sector spillovers: Covid-19 vs GFC pattern analysis. Heliyon, 8(3), e09074. https://doi.org/10.1016/j.heliyon.2022.e09074
- Saif-Alyousfi, A. Y., Saha, A., Md-Rus, R., & Taufil-Mohd, K. N. (2020). Do oil and gas price shocks have an impact on bank performance? Journal of Commodity Markets, 100147, 100147. https://doi.org/10.1016/j.jcomm.2020.100147
- Saif-Alyousfi, A. Y. H., Saha, A., Md-Rus, R., & Taufil-Mohd, K. N. (2021). Do oil and gas price shocks have an impact on bank performance?. Journal of Commodity Markets, Elsevier, 22(C).
- Sathye, M. (2001). X-efficiency in Australian banking: An empirical investigation. Journal of Banking & Finance, 25(3), 613–630. https://doi.org/10.1016/S0378-4266(00)00156-4
- Shi, X. L. B.-Z., & Zou, X. (2016). A study on risk factors impact on the efficiency of commercial banks in China—Based on fuzzy DEA model. In B.-Y. Cao, P.-Z. Wang, Z.-L. Liu, & Y.-B. Zhong (Eds.), International conference on Oriental thinking and fuzzy logic: Celebration of the 50th anniversary in the era of complex systems and big data (pp. 329–347). Cham: Springer.
- Spathis, C., Kosmidou, K., & Doumpos, M. (2002). Assessing profitability factors in the Greek banking system: A multicriteria methodology. International Transactions in Operational Research, 9(5), 517–530. https://doi.org/10.1111/1475-3995.00371
- Staikouras, C., & Wood, G. . The determinants of bank profitability in Europe. Paper presented at the European Applied Business Research Conference. June9–13, Venice, Italy.
- Sufian, F. (2009). Determinants of bank efficiency during unstable macroeconomic environment: Empirical evidence from Malaysia. Research in International Business and Finance, 23(1), 54–77. https://doi.org/10.1016/j.ribaf.2008.07.002
- Sun, H., Rabbani, M. R., Ahmad, N., Sial, M. S., Cheng, G., Zia-Ud-Din, M., & Fu, Q. (2020). CSR, co-creation and green consumer loyalty: Are green banking initiatives important? A moderated mediation approach from an emerging economy. Sustainability, 12(24), 10688. https://doi.org/10.3390/su122410688
- Tanna, S., & Pasiouras, F. (2009). The impact of foreign direct investment on total factor productivity growth: International evidence from the banking industry. Managerial Finance, 35(3), 297–311. https://doi.org/10.1108/03074350910931799
- Tatom, J. A. (1988), Are the macroeconomic effects of oil-price changes symmetric? North-Holland: Carnegie-Rochester Conference Series on Public Policy.
- Uri, N. D. (1996). The impact of crude oil price volatility on agricultural employment in the United States. Energy & Environment, 7(1), 57–74. https://doi.org/10.1177/0958305X9600700105
- Van den Heuvel, S. J. (2002). Does bank capital matter for monetary transmission? Economic Policy Review, 8(1), 259–265.
- Wanke, P., Barros, C. P., & Emrouznejad, A. (2018). A comparison between stochastic DEA and fuzzy DEA approaches: Revisiting efficiency in Angolan banks. RAIRO - Operations Research, 52(1), 285–303. https://doi.org/10.1051/ro/2016065
- Weill, L. (2004). Measuring cost efficiency in European banking: A comparison of frontier techniques. Journal of Productivity Analysis, 21(2), 133–152. https://doi.org/10.1023/B:PROD.0000016869.09423.0c
- Zhao, L., Hu, Z., Wang, J., & Zhuang, Y. (2017). Estimating the impact of contextual variables on the productivity: An enhanced slack-based DEA model. RAIRO - Operations Research, 51(4), 903–909. https://doi.org/10.1051/ro/2016063
